US President Donald Trump said Iran asked the US to lift a naval blockade of the Strait of Hormuz during talks aimed at ending a two-month conflict, Bloomberg reported on Tuesday.
In a Truth Social post on Tuesday, Trump said Iran wants the oil and gas shipping route open “as soon as possible”, while it works on its leadership situation.
Strait Of Hormuz Talks
CNN reported on Tuesday that mediators in Pakistan expect Iran to submit a revised proposal to end the war in the next few days, citing sources close to the mediation process.
At the time of writing, West Texas Intermediate (WTI) was up 2.15% on the day at $97.00.
We are seeing oil hold at $97 a barrel despite talk of de-escalation, which suggests the market remains highly skeptical of a swift resolution. This tension is keeping implied volatility elevated, with the Cboe Crude Oil Volatility Index (OVX) hovering near 55, a level indicating significant uncertainty. This environment makes selling options premium attractive, but carries substantial risk if talks collapse.
For traders who believe a diplomatic failure is more likely, holding exposure through call options remains a viable strategy. The physical market is still severely constrained by the blockade of the Strait of Hormuz, which disrupts the flow of nearly 21 million barrels per day. Any negative development from the mediation in Pakistan could easily send prices back above the $100 mark.
Options Strategies For Traders
Conversely, if we see a credible peace proposal emerge, the significant war premium currently priced into crude will evaporate quickly. This could trigger a sharp price correction down towards the low $80s, which was the prevailing range before this conflict began two months ago. Traders positioned for this outcome might consider buying put options to profit from such a decline.
This situation feels reminiscent of the volatility we experienced during the Red Sea disruptions back in 2025, where headline risk dictated price action. Given the binary nature of the outcome, using options spreads can help define risk. A bear put spread, for instance, would allow a trader to bet on a price drop while capping potential losses if the conflict unexpectedly escalates further.
The United Arab Emirates (UAE) will leave the Organization of the Petroleum Exporting Countries (OPEC) on 1 May, Reuters reported on Tuesday. The move comes during an energy crisis linked to the Iran war, with reports of growing discord among Gulf nations.
The report said the UAE has faced missile and drone attacks for weeks by Iran, which is also an OPEC member. It also said Iran’s attacks on shipping in the Strait of Hormuz have constrained the UAE’s ability to export oil, affecting a key part of its economy.
Uae Exit Impact On Oil Markets
UAE Energy Minister Suhail Al Mazrouei said the exit would have a minimum impact on oil prices and on OPEC and OPEC+. At the time of writing, West Texas Intermediate (WTI) was up 2.15% on the day at $97.00.
We are now approaching the one-year mark since the United Arab Emirates left OPEC, a move prompted by attacks from Iran last year. The initial price spike to $97 a barrel, which we saw in April 2025, was driven by war fears that overshadowed the prospect of more supply. This underlying tension between geopolitical risk and unconstrained production continues to define the market.
Since its departure, the UAE has aggressively increased output, adding an estimated 750,000 barrels per day to the market to maximize revenue. This is a significant move towards their stated capacity goal of 5 million barrels per day. This sustained increase in non-OPEC supply has created a persistent headwind for crude oil prices over the last several months.
We expect implied volatility in crude options to surge in the coming weeks, especially with ongoing shipping disruptions in the Strait of Hormuz. Looking back, similar geopolitical flare-ups, like the beginning of the Ukraine conflict in 2022, saw volatility metrics double almost overnight. Traders should consider purchasing straddles or strangles to profit from a large price move in either direction.
Brent Wti Spread And Strait Of Hormuz
The conflict’s concentration in the Strait of Hormuz puts direct pressure on seaborne crude, which primarily affects Brent pricing. This has caused the Brent-WTI spread to widen significantly, recently hitting multi-year highs of over $9. We see opportunities in positioning for this spread to widen further if regional tensions escalate.
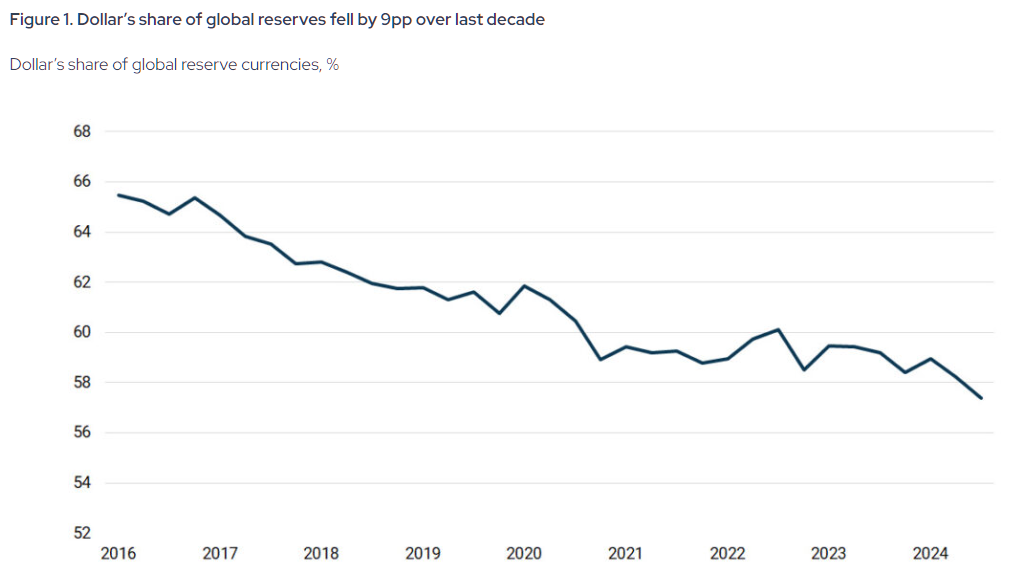
The U.S. dollar’s share of global foreign exchange reserves has declined from a 2001 peak of 72% to 57.8% by the end of 2024.
Dedollarisation is currently rated a 4 out of 10 in terms of severity, signifying a structural trend that is accelerating but not yet a crisis.
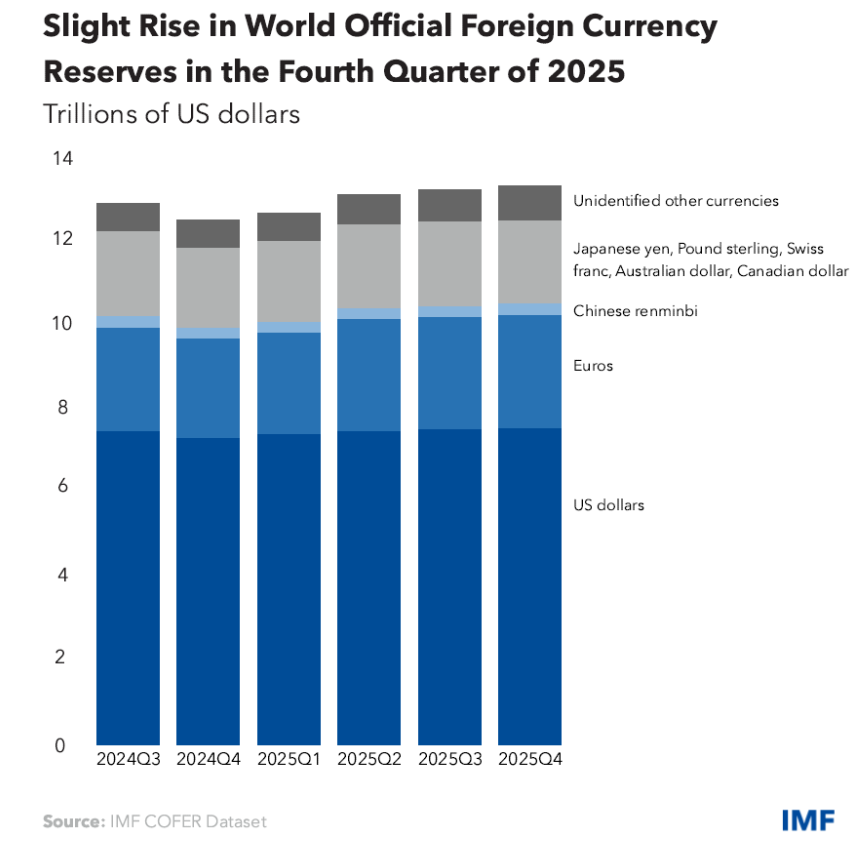
Central banks have significantly increased gold holdings, purchasing over 1,000 tonnes annually between 2022 and 2024.
The Exorbitant Privilege Is Shrinking But is America Done?
For the better part of eighty years, the United States has enjoyed something no other country in modern history has possessed. It could print money the world was forced to accept. It could borrow at rates no other sovereign could match. It could run deficits that would bankrupt any other nation and wake up the next morning with the global financial system still running on its terms. The French called it an exorbitant privilege. The rest of the world simply lived with it.
The privilege is not ending. It is eroding, slowly but structurally, and that distinction is what markets are beginning to price.
Understanding Dedollarisation: The 3-Part Monopoly
Dedollarisation is not a single event. It is a process, the slow unwinding of the dollar’s three-part monopoly over global finance. The dollar is simultaneously the world’s primary reserve currency held by central banks, the dominant currency for settling international trade, especially in oil and commodities, and the default unit of account for sovereign debt markets. Dedollarisation means chipping away at all three, not necessarily replacing the dollar with one alternative, but diluting its exclusivity across dozens of smaller shifts happening simultaneously.
It is important to be clear about what dedollarisation is not. It is not a conspiracy. It is not a clean break. It is not imminent. It is a long structural shift that has been building for two decades and is now accelerating due to decisions made in Washington itself.
Why It Is Happening
The single most consequential accelerant was the freezing of Russia’s foreign exchange reserves in February 2022 following the invasion of Ukraine. In one decision, the United States demonstrated to every government on earth that dollar assets held abroad could be immobilised by Washington at will. Russia’s own dollar holdings collapsed from 41.5% of reserves before the sanctions to just 13 to 18% by late 2024. The message was received far beyond Moscow.
Asset Class
Jan 2022 (Pre-Sanctions)
Jan 2025 (Adjustment)
Jan 2026 (Current)
Total Reserves
~$630 Billion
~$609 Billion
$769.1 Billion (Record High)
Gold Share
21.50%
~26%
~43.0%
US Dollar
20.90%
< 5% (Active)
~0% (Active)
Euro
32.10%
~10% (Active)
~0% (Active)
Chinese Yuan
17.10%
~30%
~32-35%
What followed was a layered response. By January 2025, Russia and Iran had effectively completed their own bilateral exit from the dollar, with over 95% of trade between the two countries settled in rubles and rials. China’s Cross-Border Interbank Payment System, known as CIPS, processed roughly 180 trillion yuan in transactions in 2025, equivalent to about USD25–26 trillion, providing a growing settlement alternative alongside the dollar-dominated SWIFT network.
Central banks globally purchased over 1,000 tonnes of gold annually from 2022 through 2024, more than double the average of the previous decade. In 2025, they added another 863 tonnes, reinforcing the shift toward reserve diversification. The IMF’s own data shows the dollar’s share of global foreign exchange reserves fell from a peak of 72% in 2001 to 57.8% by the end of 2024.
While most of these shifts are gradual and institutional, recent geopolitical developments have begun to operationalise these alternatives in real-world trade flows.
The Petrodollar Under Threat: The Strait of Hormuz Tolls
During the war, Iran’s Islamic Revolutionary Guard Corps began charging oil tankers and LNG carriers up to two million dollars per vessel to transit the strait, demanding payment not in dollars, but in Bitcoin, USDT, or Chinese yuan routed through Kunlun Bank via CIPS. Iran’s parliament was reported to have codified this under the Strait of Hormuz Management Plan on March 30, 2026. At current traffic volumes of roughly 21 million barrels of oil passing through the strait daily, estimates place the toll revenue at USD600 to USD800 million per month. The dollar was not just bypassed. It was explicitly excluded.
This is not an isolated provocation. It is the most visible deployment yet of infrastructure that has been quietly scaling for years, a state using crypto and yuan payment rails as a sovereign revenue mechanism at the world’s most critical oil chokepoint. The Houthis in Yemen set an earlier template by charging vessels in the Red Sea. Iran has taken it further, and in doing so has demonstrated that the petrodollar system, the 1973 arrangement that made dollar settlement the price of admission to global energy markets, is no longer the only game in town.
President Trump said the US Navy would blockade the Strait of Hormuz and interdict every vessel in international waters that paid a toll to Iran after peace talks failed https://t.co/tpzNOS3iWfpic.twitter.com/fHJJOt6KUT
What Happens to the US if Dedollarisation Continues
The dollar’s reserve status is not just a theory. It is a key part of U.S. power. Since global trade relies on dollars, there is steady demand for U.S. currency and assets even when the domestic economy is weak. This demand lets the government borrow at lower costs, run deficits without immediate pressure, and fund spending beyond what taxes alone could cover.
If that foundation weakens, the effects build up quickly. Without steady foreign demand for U.S. Treasuries, interest rates rise across the economy, increasing the cost of mortgages, business loans, and government borrowing at the same time. A weaker reserve role also puts pressure on the dollar, making imports more expensive and adding to inflation. Most importantly, the U.S. loses some of its financial influence, since sanctions are effective mainly because the dollar is widely used. If real alternatives to the dollar emerge, that influence becomes less powerful.
Businesses working with Iranian airlines risk US sanctions, Treasury Secretary Scott Bessent said, calling the warning a part of a campaign to put economic pressure on Tehran amid the US-Israeli war on Iran https://t.co/8kFQ0EqRr2
Despite these developments, the scale of the dollar’s dominance remains overwhelming. On a scale of one to ten where ten is bad, dedollarisation today sits at roughly four. Real, structural, and accelerating, but nowhere near a crisis.
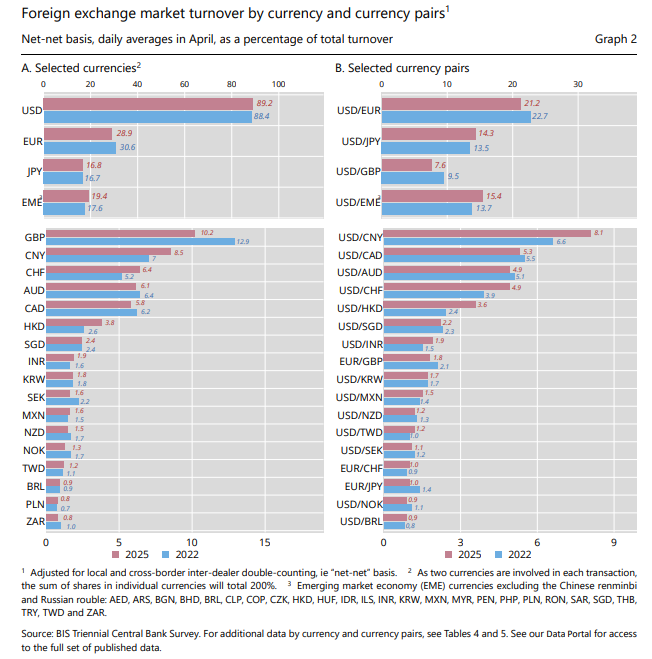
Data shows the dollar is still firmly dominant. The BIS 2025 Triennial Survey found it was involved in about 89% of all global foreign exchange trades, slightly higher than in 2022. At the BRICS summit in Rio, leaders did not even mention dedollarisation, and India stated clearly that it has no plan to replace the dollar, calling it a source of global stability. Meanwhile, China’s yuan is still limited by capital controls. In reality, no other currency or system is ready to take over the dollar’s global role anytime soon.
The score is a four and not a two because the trend is real and the infrastructure being built, CIPS, mBridge, BRICS Pay, digital yuan, local currency swap agreements, is not going away. It is a four and not a six because the dollar’s institutional moat remains enormous and no rival is close to bridging it. Yet this is where the story becomes counterintuitive.
The Investment Paradox: Why the World is Buying America While Fleeing the Dollar
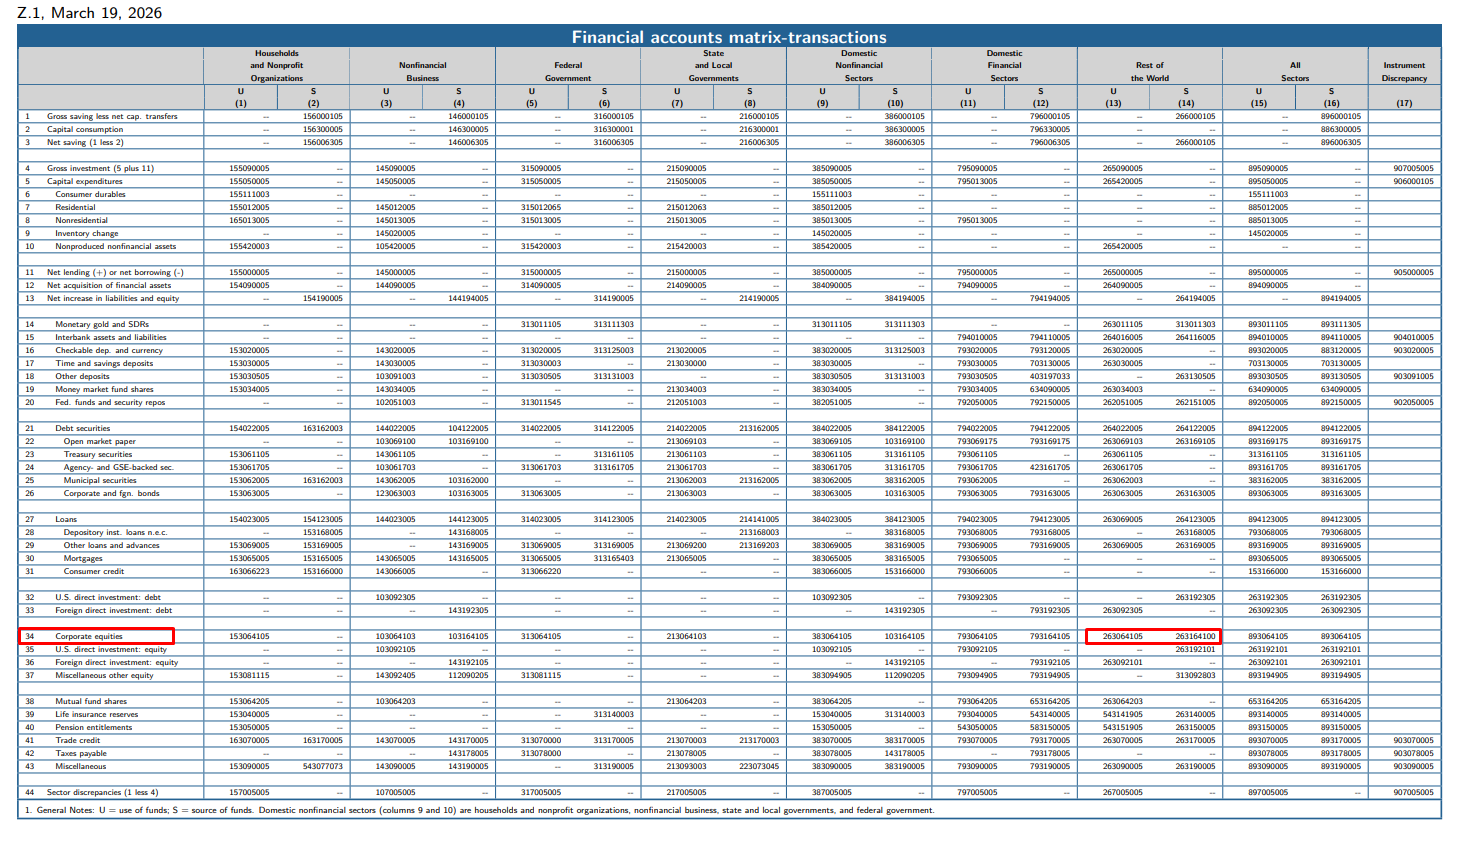
Here is the number that stops every dedollarisation argument in its tracks. In 2025, foreign investors purchased a record $1.55 trillion in US financial assets according to the Treasury Department. They now hold $21 trillion in US equities, an all-time high. The number of days in 2026 where US stocks, the dollar, and bonds all declined simultaneously has fallen to just nine, on track for the lowest annual reading in eleven years. By comparison, the 1990s saw 30 to 60 such days per year.
The world is not fleeing America. It is buying America.
The explanation is that dedollarisation and investing in US markets are not contradictions. They are parallel rational strategies. Governments diversify away from holding dollar reserves issued and controlled by Washington while simultaneously wanting ownership of the most innovative, profitable companies on earth. US equities are not a dollar bet. They are a bet on American corporate earnings, American innovation, and American institutional depth. Until a rival market offers comparable liquidity, legal protection, and returns, capital will keep flowing in even as reserve managers quietly rebalance elsewhere.
The S&P 500 and Nasdaq hit record closing highs, bolstered by optimism for possible negotiations between the US and Iran to end the war and a surge in Intel shares that extended the rally in semiconductor stocks https://t.co/rZ2obcfCs6pic.twitter.com/Reh06DEhai
The world is hedging the dollar institutionally while still trusting America commercially. That distinction matters enormously.
The Choice Facing America
The United States has two paths available to it. The first is pressure. It can threaten high tariffs on countries trying to move away from the dollar. This shows strength, but it can also backfire. If countries are already worried about the U.S. using the dollar as a weapon, more pressure will not stop them. It will push them to find alternatives faster.
The second choice is harder, but more effective in the long run. The U.S. needs to make the dollar trustworthy again. That means managing its finances responsibly, using sanctions carefully, keeping markets open, and staying involved in building the future of global payment systems instead of leaving it to China.
In the end, the dollar’s strength does not come from force. It comes from trust. Investors, governments, and institutions around the world hold dollars because they believe the U.S. will keep its word, act fairly, and remain a strong economy.
That trust is now being tested. The advantage the U.S. has enjoyed is slowly shrinking. Whether it continues or fades depends on whether the U.S. remembers that the dollar is not just money.
It is a promise, and that promise needs to be protected.
The Big Questions
1) Is the U.S. dollar losing its status as the world’s primary reserve currency?
The dollar is undergoing structural erosion rather than an imminent collapse. While its share of global foreign exchange reserves has fallen from 72% in 2001 to 56.77% by the end of 2025, it remains the world’s most utilised currency, involved in nearly 9 out of every 10 foreign exchange trades.
2) What are the primary drivers of dedollarisation in 2026?
The shift is largely fueled by the 2022 freezing of Russian foreign exchange reserves, which demonstrated that Washington can immobilise dollar assets at will. This has led nations to seek alternative payment rails like China’s CIPS and increase annual gold purchases to over 1,000 tonnes.
3) What is the investment paradox mentioned in recent market data?
The paradox describes a trend where global governments diversify away from dollar reserves while simultaneously increasing their ownership of U.S. commercial assets. In 2025, foreign investors held a record $21 trillion in the U.S. equities, signalling that they trust American innovation even as they hedge against the currency’s political risks.
4) How does the Strait of Hormuz impact the petrodollar system?
The petrodollar arrangement is no longer the exclusive system for energy trade since Iran began charging tankers up to $2 million in Bitcoin, USDT, or yuan for transit through the strait. This represents a visible deployment of non-dollar infrastructure at a critical global oil chokepoint.
5) How dominant is the U.S. dollar in global foreign exchange today?
Despite the rise of alternatives, the dollar remains overwhelmingly dominant and was involved in approximately 89% of all global foreign exchange trades according to 2025 data.
6) What are the economic risks to the United States if dedollarisation continues?
A significant weakening of the dollar’s reserve role would lead to higher domestic interest rates, increased costs for government borrowing, and higher inflation as imports become more expensive. Furthermore, the effectiveness of U.S. Financial sanctions would diminish as global trade moves to alternative systems.
7) Are other nations ready to replace the dollar?
Currently, no other currency or system is prepared to fully assume the dollar’s global role. Major economies like India continue to view the dollar as a source of global stability and have stated they have no plans to replace it.
Start trading now – Click here to create your real VT Markets account
EUR/USD traded lower near 1.1715 in early Asian trading on Wednesday, with the US Dollar supported by uncertainty over a possible Middle East ceasefire. Markets are focused on the US Federal Reserve rate decision later on Wednesday.
Donald Trump said Iran asked the US to lift a naval blockade of the Strait of Hormuz while talks continue to end a two-month war. CNN reported that mediators in Pakistan expect Iran to submit a revised proposal within the next few days.
Geopolitical Risk And Dollar Demand
Iran has said it will not open the waterway while the US blockade remains in place. This keeps uncertainty elevated and supports demand for the US Dollar.
The Fed is expected to keep rates unchanged at 3.50% to 3.75% at its April meeting, which would be the third straight hold. Traders will watch Jerome Powell’s press conference for signals on the path ahead.
Attention then turns to the ECB decision on Thursday, with expectations of a hawkish hold and possible rate rises in June or July. Goldman Sachs forecasts two 25 bps hikes, in June and September, taking the deposit rate back to 2.50%.
In 2022, the Euro accounted for 31% of FX trades, with daily turnover above $2.2 trillion. EUR/USD represents about 30% of FX turnover; EUR/JPY 4%, EUR/GBP 3%, and EUR/AUD 2%.
Central Banks And Volatility
We see echoes of the situation back in 2025, where geopolitical risk drove flows into the US Dollar, putting pressure on the Euro. With EUR/USD currently struggling around 1.05 amid renewed tensions in the Middle East, the dollar’s safe-haven appeal is once again a dominant market theme. This week’s central bank decisions will be critical for setting a direction for the coming weeks.
The market is pricing in a hold from the Federal Reserve, keeping the federal funds rate in its current 4.00% to 4.25% range. Recent inflation data, with the core Consumer Price Index (CPI) remaining stubbornly above 3% last quarter, has pushed back expectations of any near-term rate cuts. This policy stance supports a strong dollar, especially as the US economy continues to show resilience with Q1 2026 GDP growth reported at a healthy 2.1%.
Across the Atlantic, the European Central Bank is also expected to hold its deposit rate at 3.00%, but its challenge is different. While Eurozone inflation has cooled, sluggish economic performance, particularly with Germany’s manufacturing PMI contracting for a fourth straight month, makes a hawkish policy difficult to justify. This economic divergence makes a sustained rally in the Euro unlikely.
For derivative traders, this suggests owning volatility could be a prudent strategy. We believe long straddles or strangles on EUR/USD options could be effective, as they would profit from a significant price swing following the central bank announcements, regardless of the direction. Implied volatility for one-month options has already risen to 8.2%, reflecting the market’s uncertainty, but a surprise could easily push actual volatility higher.
For those with a directional view, the path of least resistance appears to be a weaker Euro. The interest rate differential, with US 2-year yields offering a premium of over 120 basis points compared to German bunds, creates a positive carry for holding short EUR/USD positions. However, any unexpected de-escalation of global tensions could trigger a sharp relief rally, making disciplined risk management essential for any short futures or forward positions.
GBP/USD fell 0.12% on Tuesday to about 1.3520, staying in a consolidation zone near 1.3500. It moved in a 115-pip range from 1.3465 to 1.3580, with early gains fading before a late bounce from the lows.
Attention turns to the Bank of England decision on Thursday at 11:00 UTC. The Bank Rate is expected to stay at 3.75%, with an MPC vote forecast at 8-1-0 versus the prior 9-0-0 hold, followed by the Monetary Policy Report and a 11:30 UTC press conference.
Central Bank Events In Focus
Energy-driven inflation risks linked to the Iran conflict are a focus, with an MPC member Pill speech due Friday at 11:15 UTC. In the US, the Federal Reserve decision on Wednesday at 18:00 UTC is expected to keep rates at 3.50% to 3.75%, with Powell’s tone on inflation watched closely.
Traders are assessing whether oil disruption at the Strait of Hormuz affects inflation beyond the near term; Friday’s US ISM Manufacturing PMI is also due. On charts, price sits near 1.3519 below 1.3538 resistance, while daily levels show support at 1.3518, the 50-day EMA at 1.3440, and the 200-day EMA at 1.3387, with Stochastic RSI near 65.
We see the GBP/USD pair is currently stalled around the 1.3500 level, reflecting widespread caution ahead of major central bank decisions. This indecisive price action, shown by the tight consolidation, suggests that the market is waiting for a clear signal from either the Bank of England (BoE) or the Federal Reserve. Derivative traders should be preparing for a significant breakout from this range once the news is released.
With both central bank meetings occurring this week, implied volatility is likely to rise, making option strategies attractive. A simple approach would be to buy a straddle, which involves buying both a call and a put option with the same strike price and expiry date. This position profits if the GBP/USD makes a strong move in either direction, which is a real possibility given the current geopolitical tensions affecting inflation.
Options Positioning For Breakout
The BoE’s expected 8-1 split vote highlights its dilemma with rising inflation, a situation we saw unfold similarly in 2022. Recent data shows UK Consumer Price Index (CPI) inflation unexpectedly rose to 3.1% in March 2026, pushed higher by the energy price shock from the Iran conflict. This persistent inflation, well above the 2% target, puts immense pressure on the BoE to avoid appearing too soft, even if a rate hike is not expected now.
On the other side, the Fed is watching US Core Personal Consumption Expenditures (PCE), which has remained stubbornly above target at 2.9%. Historically, geopolitical oil shocks, such as the 1979 crisis, have led to sustained inflation, forcing the Fed into aggressive action. If Chair Powell hints that the Strait of Hormuz disruption is not a temporary issue, it would signal a more hawkish path for the dollar.
A hawkish Fed combined with a dovish split from the BoE would likely send GBP/USD lower. In this scenario, we would consider buying put options with strike prices below the key 50-day moving average at 1.3440. This would position us to profit from a breakdown toward the 200-day average near 1.3387.
Conversely, if the Fed dismisses the oil shock as transitory and the BoE expresses unified concern about inflation, the pound could rally sharply. For this possibility, we could look at call options with strike prices above the recent high of 1.3580. The technical support provided by the moving averages on the daily chart gives us a clear zone where dip-buying strategies have previously been successful.
Spot gold (XAU/USD) fell 1.85% on Tuesday and closed near $4,596, after trading as low as about $4,555. It has closed lower in four of the last six sessions, and the move broke a prior hold above $4,650.
The Federal Reserve decision is due at 18:00 UTC on Wednesday, with the policy rate expected to stay at 3.50% to 3.75%. Key US releases on Thursday include Q1 GDP, forecast at 2.3% annualised after 0.5%, and March Core PCE, seen at 3.2% year on year versus 3%.
Fed Decision And Market Setup
Friday brings the ISM manufacturing PMI, with the prices paid index expected near 80, above the 50 expansion level. On a 15-minute view, price is $4,595.84 versus the day’s open of $4,697.98, with Stochastic RSI moving down from overbought.
On the daily chart, price is between the 50-day EMA at about $4,764.90 and the 200-day EMA near $4,325.77, with Stochastic RSI near 32. Central banks added 1,136 tonnes of gold worth around $70 billion in 2022, the highest annual total on record.
We are seeing gold prices test the $4,600 level after a sharp decline ahead of the Federal Reserve’s decision later today. The key uncertainty is how the Fed will address persistent inflation, especially with recent energy price shocks stemming from the Iran conflict. Implied volatility in gold options has risen to a six-week high, which suggests the market is bracing for a significant price move in either direction following the announcement.
A hawkish tone from the Fed, emphasizing inflation control despite energy costs, would likely strengthen the dollar and push gold lower. In this scenario, we would consider buying put options or establishing short futures positions, targeting a break below yesterday’s low near $4,555. The primary support level to watch on a sustained sell-off remains the 200-day moving average around $4,325.
Conversely, if the Fed signals patience and acknowledges the risk of an energy-driven slowdown, gold should find relief. This outcome would warrant looking at call options or long futures to capitalize on a rally. The first major hurdle to overcome would be the 50-day moving average, currently sitting near $4,765.
Macro Backdrop And Key Catalysts
We are mindful of historical precedents, as the current combination of an energy shock and persistent inflation echoes the stagflationary environment of the 1970s. While that period was volatile, gold ultimately performed well as a store of value. This longer-term bullish case is also supported by continued central bank buying, which, looking back from 2025, we saw reach record levels in 2022 and has continued robustly into this year.
Beyond today’s Fed meeting, our focus will shift to Thursday’s Q1 GDP and Core PCE inflation data. Stronger-than-expected figures would validate a hawkish Fed stance and likely add further pressure on gold prices through the end of the week. Any signs of slowing growth or cooling inflation, however, could reignite bullish sentiment for the metal.
Chile’s central bank kept its benchmark interest rate at 4.50% after a unanimous vote. The board said the worsening conflict in the Middle East is weighing on the policy outlook.
The Banco Central de Chile stated that the war’s effect on the global economy has been more adverse than the scenario in its March Monetary Policy Report (IPoM). It said further escalation could raise inflation while also worsening a global economic slowdown.
Middle East Conflict And Inflation Risks
The board warned that a prolonged conflict could keep crude oil prices high for longer. It noted this risk is important for a small open economy that is exposed to higher external costs through energy imports.
The rate hold leaves policy on a wait-and-see approach as officials assess falling inflation in domestic data against renewed supply risks. The next quarterly IPoM is expected to update external assumptions due to changes since March.
The Chilean central bank’s decision to hold rates at 4.5% signals significant caution in the face of geopolitical risk. With Brent crude futures now pushing towards $98 a barrel, a sharp increase from the Q1 average, we see this as a defensive move against imported inflation. This indicates that betting on imminent rate cuts in Chile is a risky position for now.
This sustained tension suggests long positions in crude oil call options or futures could be beneficial. Traders might consider longer-dated contracts to ride out potential volatility caused by any further escalation in the Middle East. We believe the risk premium in oil is likely to remain elevated for the foreseeable future.
Chilean Peso And Market Volatility
For the Chilean peso, this “wait-and-see” stance creates uncertainty, which we’ve seen reflected in the USD/CLP exchange rate breaking above 980. This makes currency options, which can profit from volatility, a more prudent strategy than taking a direct position. Looking back at the historical data from 2025, the peso was much stronger when global conditions were calmer.
The bank’s inflation fears are not isolated; the latest U.S. CPI data for March surprised to the upside at 3.7%, interrupting the cooling trend from late 2025. This environment suggests we should be wary of positions, like shorting the U.S. dollar, that rely on imminent rate cuts from the Federal Reserve. Any trades betting on lower global interest rates should be carefully reconsidered.
The risk of a global slowdown, echoed by the IMF’s recent downgrade of its 2026 growth forecast to 2.8%, should also guide our strategy. We believe hedging equity portfolios with put options on major indices like the S&P 500 is a necessary precaution. The combination of high energy prices and tightening financial conditions presents a clear headwind for corporate earnings.
USD/JPY traded in an 80-pip range on Tuesday and closed near 159.62, after a low of 158.96 in early Asia and a high of 159.79 late in New York. The pair has been broadly unchanged since mid-March, with 160.00 acting as a cap through repeated tests.
Japan’s calendar becomes busier over the next 48 hours, with March Retail Trade due on Wednesday, forecast at 0.8% year-on-year versus -0.2% previously. Tokyo CPI is due on Thursday, with the ex-fresh-food measure forecast at 1.8% year-on-year versus 1.7% prior, while two-year Japanese government bond yields are around multi-decade highs.
Key US And Japan Catalysts
In the US, the Federal Reserve decision is due at 18:00 UTC on Wednesday, with the federal funds rate expected to be held at 3.50% to 3.75%. Attention is also on the Iran conflict and Strait of Hormuz oil disruption, ahead of Thursday’s US Q1 GDP and Core PCE Price Index releases.
On a 15-minute chart, the pair trades at 159.62, above the day’s open at 159.36, with Stochastic RSI around the mid-50s. On the daily chart, price is above the 50-day EMA at 158.44 and the 200-day EMA at 155.10, with Stochastic RSI near the mid-50s.
We are seeing a familiar picture as USD/JPY pushes toward 170.00, which feels very similar to when the pair was stuck below the 160.00 level this time last year in 2025. The fundamental problem has not changed, as the gap between U.S. and Japanese interest rates remains the primary driver of yen weakness. The Federal Reserve’s policy rate is holding firm at 4.50%, while the Bank of Japan has only edged its rate up to 0.10%.
Just as 160.00 acted as a line in the sand, strong verbal warnings from Japanese officials suggest 170.00 is the new critical level to watch. We must remember the sharp, multi-yen drops that followed official intervention after the pair broke 150 in 2022 and the volatility we saw after 160 was breached last year. This history suggests that buying far out-of-the-money call options is extremely risky, as a sudden move by authorities could make them worthless overnight.
Options Strategies And Volatility
The upcoming economic data will be decisive for the next move, just as it was in 2025. With recent US Core PCE inflation proving sticky at 2.8%, the Federal Reserve is unlikely to signal any new rate cuts soon, keeping the dollar supported. Although Japan’s national inflation is holding above the 2% target, the Bank of Japan’s cautious stance continues to weigh on the yen, leaving the path of least resistance pointed higher.
This tension between a steady uptrend and the threat of sudden intervention is causing implied volatility in the options market to rise. This environment makes selling short-dated strangles appealing, as traders can profit if the pair remains contained below 170.00. However, this strategy carries significant risk should there be a sharp breakout in either direction.
For those wanting to maintain a bullish bias while managing the enormous risk of intervention, using option spreads is a sensible approach. A bull call spread, for example, allows us to profit from a continued grind higher but defines our maximum loss if the government steps in and sends the pair tumbling. This strategy provides a way to stay in the trade without exposing ourselves to an account-destroying move.
NZD/USD fell 0.4% on Tuesday and closed near 0.5885, after reaching about 0.5925 and failing again at 0.5900. It moved in a 65-pip range between 0.5860 and 0.5925, with lower highs forming as early strength faded.
In New Zealand, focus shifts to an RBNZ speech by Breman on Wednesday and the ANZ-Roy Morgan consumer confidence release on Thursday. The prior confidence reading was 91.3, while the Iran conflict has pushed up commodity prices and freight costs, and Australia’s PPI is due on Friday.
Fed Event Risk And Us Data
In the US, the Federal Reserve decision is due at 18:00 UTC on Wednesday, with rates expected to stay at 3.50% to 3.75%. Attention is also on Thursday’s US Q1 GDP and Core PCE, with Core PCE forecast at 3.2% year-on-year versus 3% previously.
On a 15-minute view, the pair stayed below the daily open at 0.5915, with Stochastic RSI near 44. On the daily chart, it traded around 0.5885 above the 200-period and 50-period EMAs near 0.5850 to 0.5860, while Stochastic RSI sat near 74.
Looking back to mid-2025, we saw the US Dollar strengthen significantly into that year’s Federal Reserve meetings. The hawkish tone from the Fed, driven by persistent inflation from the Iran conflict, did push NZD/USD below the 0.5850 support level we were watching. That downward pressure continued through the second half of 2025 as the Fed held rates firm.
The environment has since changed dramatically as we approach May 2026. Geopolitical tensions eased late last year, causing oil prices to recede and helping cool global inflation. US Core PCE inflation has now fallen to 2.7% as of the March 2026 report, a significant drop from the 3.2% feared in 2025.
Rbnz Fed Divergence And Kiwi Bias
This has created a clear policy divergence between the central banks. The RBNZ, facing weaker domestic data like the ANZ consumer confidence number which currently sits at a subdued 85.1, already cut its official cash rate to 5.25% in February. The Federal Reserve, however, is only now signaling a potential first rate cut this summer, creating a tailwind for the Kiwi dollar.
Given this outlook, traders should consider positioning for further NZD/USD strength. Buying call options with a strike price around 0.6150 expiring in the next two to three months offers a way to profit from a continued rally with a defined risk. This strategy capitalizes on the shifting interest rate differential favoring the New Zealand Dollar.
Alternatively, using bull call spreads can reduce the upfront cost of getting long exposure. For instance, buying a 0.6100 call and selling a 0.6250 call would position for a steady, but not explosive, move higher. This reflects the view that while the trend has turned, the rally will be gradual as we await confirmation from upcoming US employment and inflation data.
AUD/USD ended Tuesday almost unchanged at about 0.7180, after moving in a 70-pip range between 0.7130 and 0.7200. It touched 0.7200 early in Europe, then returned towards 0.7180 ahead of Wednesday’s inflation data.
Australia’s Consumer Price Index is due at 01:30 UTC on Wednesday. Headline CPI is forecast at 4.7% year on year for March, up from 3.7%, and Trimmed Mean CPI is also being watched for policy signals from the Reserve Bank of Australia.
Key Events Ahead
The US Federal Reserve decision is due at 18:00 UTC on Wednesday, with the policy rate expected to stay at 3.50% to 3.75%. Attention is on guidance about inflation, including oil-related cost pressures tied to disruption in the Strait of Hormuz, and Friday’s ISM Manufacturing PMI is also ahead.
On a 15-minute chart, the pair is near 0.7180 and below the daily open at 0.7191, which acts as resistance. Stochastic RSI is near 15, while the daily chart shows price above the 50-day EMA at 0.7041 and the 200-day EMA at 0.6800, with Stochastic RSI near 79.
The current market inaction in AUD/USD reminds us of the tight consolidation we saw this time last year, in April 2025. Back then, the pair hovered around 0.7180 ahead of critical inflation data, much like the market is holding its breath now. Traders should be cautious of this quiet, as it often precedes a significant breakout.
We are watching for Australia’s quarterly CPI data, which is expected to show inflation remains persistent at 3.9% year-over-year, well above the RBA’s target. We remember in 2025 when a CPI jump to 4.7% fueled expectations for RBA rate hikes, and a similar outcome this week could trigger a sharp rally in the Aussie dollar. This backdrop suggests positioning for upside through call options could be a prudent strategy to capture a potential surprise.
Strategy Considerations
On the other side of the pair, the US Federal Reserve’s stance is creating uncertainty, just as it did in 2025 when the focus was on oil shocks. Today, with the Fed funds rate holding at a restrictive 4.75% and recent core PCE inflation still at 2.9%, any hawkish language from the Chair could strengthen the US dollar. This dual risk makes trading the directional break tricky ahead of the announcements.
Given the significant event risk from both central banks, implied volatility is rising. The situation mirrors the indecisive, small-bodied candles from last year, suggesting traders are unwilling to commit. A long straddle or strangle options strategy could be effective for playing the large move that is likely to come, without having to bet on the direction.
With the pair currently trading near 0.6750, the key support level to watch is the 50-day moving average around 0.6680. In 2025, we saw dip-buyers emerge at a similar technical floor, and we would expect that level to hold to maintain the near-term bullish bias. A break below this support would signal a more significant downturn and could trigger stop-loss orders.