Gold prices rise today in Saudi Arabia, according to compiled data.
Gold prices in Saudi Arabia rose on Wednesday. According to FXStreet, the price increased to 632.26 Saudi Riyals (SAR) per gram, up from SAR 624.15. The price per tola also went up, reaching SAR 7,374.61 from SAR 7,279.98 the day before.
FXStreet calculates gold prices in local currency by adjusting international rates and measurement units. They update these figures daily based on market conditions. These prices serve as a guide and can vary locally. Gold is often seen as a secure investment, especially during unstable economic times.
Today, gold prices in the Philippines have risen according to data from various sources.
Gold prices in the Philippines increased on Wednesday, according to FXStreet. The price per gram of gold rose to 9,921.75 Philippine Pesos, up from 9,791.70 PHP on Tuesday.
Currently, gold costs 115,725.40 PHP per tola, an increase from 114,208.50 PHP the day before. The price for a troy ounce is now 308,596.80 PHP.
How Gold Prices Are Determined
FXStreet calculates local gold prices using the international gold price and the USD/PHP exchange rate. These prices are updated daily, but local rates may vary slightly. Gold has always been valued as a store of value and a medium of exchange. It is considered a safe asset, especially during market turmoil, and it helps protect against inflation. Central banks are major gold buyers. They added 1,136 tonnes to their reserves in 2022, worth about $70 billion. This marks the highest annual purchase ever recorded. Gold often moves in the opposite direction of the US Dollar and US Treasuries. It typically increases when the Dollar weakens and interest rates are low. Conversely, a stronger Dollar or higher interest rates can lower its price.Gold’s Recent Market Performance
The recent increase in gold to PHP 9,921.75 shows rising market anxiety. This change comes as we await the Federal Reserve’s interest rate decision next week. The market is anticipating considerable uncertainty, leading to opportunities for derivative strategies. Recent inflation data indicates that the 2025 US Consumer Price Index ended at a steady 3.4%. This persistent inflation keeps gold appealing, as it traditionally serves as a hedge against declining currency values. Traders are positioning themselves for this by considering longer-dated call options. Institutional support remains strong. Central banks continued buying aggressively throughout 2025, adding over 1,080 tonnes to their reserves, according to the World Gold Council’s final report. This ongoing demand sets a solid price floor, making short positions risky. The US Dollar Index (DXY) is rising, currently around 104.50, which usually challenges gold prices. Nevertheless, the upcoming Fed meeting has led to an increase in implied volatility for gold options, rising over 18%, significantly above last quarter’s average. This indicates traders expect a sharp price movement following the announcement. Given the high volatility, buying options to manage risk appears wise. Bullish traders might consider call spreads to reduce entry costs, while those anticipating a downturn could look at put options. A straddle, purchasing both a call and a put, could be an effective way to trade the expected price swings, although it may be more expensive. Create your live VT Markets account and start trading now.USD/CAD rebounds from July 2025 lows, surpassing 1.3600 before BoC and Fed meetings
The USD Index Update
The USD Index has bounced back from its lowest level since February 2022, despite expectations for a dovish Federal Reserve limiting its recovery. A rate cut is expected twice this year, and there will soon be a new Fed Chair. Concerns about the independence of the central bank are rising, especially with attempts to dismiss Fed Governor Lisa Cook. Economic and geopolitical risks are increasing, and the rise in Crude Oil prices since October 2025 may support the Loonie, putting a cap on USD/CAD gains. We await a clear buying trend to confirm that spot prices have hit a bottom. With significant events today from both the Bank of Canada and the Fed, we face major risk. The market is trying to navigate a weak US dollar while the Canadian economy sends mixed signals that might influence the Bank of Canada. This creates a challenging situation where the easiest path forward isn’t clear right now. In the coming weeks, we should look for strategies that benefit from increased volatility, as surprises from either central bank could cause sudden shifts. The one-week implied volatility for USD/CAD options has risen to 9.8%, indicating market nerves about these announcements. Buying a simple straddle or strangle could be a good move to take advantage of a breakout from the current narrow range.Potential USD/CAD Strategies
If we think the recent rise in oil, with WTI crude over $92 a barrel, will outweigh a dovish Bank of Canada, then the bounce to 1.3600 may present a selling opportunity. We could implement a bear call spread by selling the 1.3650 calls and buying the 1.3700 calls for protection, allowing us to collect a premium. This strategy would profit if the pair stays flat or continues its downward trend due to a weak US dollar outlook. On the other hand, a dovish surprise from the Bank of Canada is still a possibility. Last week’s jobs report showed a surprising drop of 5,000 positions in December 2025. If that happens, we might see USD/CAD surge as the Canadian dollar weakens. In this case, a bull put spread by selling puts at the 1.3550 strike could be used to bet that recent lows will hold as support. This situation echoes the central bank policy divergence we saw in 2024, which led to sharp currency movements. With a 75% chance of another rate cut by June in the Fed funds futures market, and uncertainty surrounding the next Fed Chair, it’s crucial to hedge existing exposures. Even simple puts against long USD/CAD positions should be considered to protect capital from an unexpectedly dovish Fed outcome. Create your live VT Markets account and start trading now.Gold prices increase in Malaysia today, according to official data.
Gold prices in Malaysia have increased, according to FXStreet data. The price per gram is now 660.21 Malaysian Ringgits (MYR), up from 652.26 MYR on Tuesday. The price per tola has risen from 7,607.82 MYR to 7,700.23 MYR.
FXStreet calculates these prices by adjusting international rates to the local currency and units. These prices are updated daily based on market rates, but local prices may vary slightly.
Gold As A Safe Haven
Gold has always been a reliable store of value and is seen as a safe-haven asset, especially in uncertain times. It is also used as protection against inflation and currency decline. Central banks hold the most significant gold reserves. They added 1,136 tonnes in 2022, the highest amount bought in a year, according to the World Gold Council. Countries like China, India, and Turkey are rapidly increasing their reserves. Gold prices tend to rise when the US Dollar and Treasuries decline. Gold is also affected by stock market performance; prices drop when stocks do well. Prices fluctuate due to geopolitical issues, interest rates, and the strength of the US Dollar.The Outlook For Gold Prices
The recent increase in gold prices is part of a broader trend we are closely watching. This trend highlights gold’s role as a hedge against currency decline, especially relevant during the market ups and downs of 2025. As we enter 2026, the appeal of gold as a safe haven is growing amid increasing economic uncertainty. A key factor in the coming weeks is the anticipated change in central bank policies. After high interest rates in 2024 and 2025, US inflation has decreased to around 2.5%. This has led markets to expect potential rate cuts from the Federal Reserve later this year. Since gold does not yield interest, it becomes more appealing as rates are likely to drop, lowering the cost of holding it. This outlook is also weakening the US Dollar, which is inversely related to gold prices. The Dollar Index (DXY) has fallen below 102 from late 2025 highs, and further declines could push gold prices higher. A weaker dollar means gold, priced in USD, becomes cheaper for investors using other currencies. Strong demand from central banks supports this trend. After record purchases in 2023 and 2024, reports at the end of 2025 confirmed that central banks, particularly in emerging economies, continued to build their reserves rapidly. This ongoing demand creates a solid base for the market, limiting potential declines. Given these conditions, derivative traders might explore strategies that benefit from rising prices and volatility. We recommend buying call options on major gold ETFs for leveraged exposure to a potential increase while controlling risk. We’re focusing on contracts that will expire in the second quarter of 2026 to take advantage of the expected policy changes. Create your live VT Markets account and start trading now.WTI rises to about $62.65 during Asian trading hours amid US production concerns
WTI is trading at about $62.65 during the Asian session on Wednesday. This drop is due to fears of production losses from a winter storm in the US, which has disrupted around 2 million barrels per day, about 15% of the country’s total output.
Crude exports from US Gulf Coast ports stopped on Sunday, adding to the supply worries. Additionally, tensions in the Middle East may also affect WTI prices.
EIA Report’s Potential Impact
The EIA’s crude oil stockpile report, expected later today, could influence prices based on the inventory levels reported. If stockpiles decrease, it suggests strong demand, which may drive prices up. Conversely, an increase in stockpiles might indicate weak demand, leading to lower prices. WTI Oil is a high-quality crude oil mainly produced in the United States. Its price is affected by supply and demand, geopolitical issues, and the value of the US dollar. Weekly oil inventory reports from the API and EIA are closely monitored, with the EIA considered more reliable. OPEC’s choices on production can also significantly sway WTI prices, changing global supply levels.Weather-Related Volatility
West Texas Intermediate is holding near $62.65 as we evaluate the effects of the US winter storm. The extreme weather has impacted production, with recent estimates indicating over 700,000 barrels per day were offline in Texas and North Dakota. This supply shock raises the risk of price increases, making short-term call options appealing. We will be watching the EIA stockpile report released later today for signs of tightening supply. If there is a larger-than-expected drop in crude inventories, it will support the bullish outlook and may push WTI towards higher resistance levels. This report is critical for this week, as it will influence short-term price movements. Since weather disruptions are temporary, we expect increased volatility in the upcoming weeks. Traders might use options to navigate this uncertainty as the market balances short-term supply losses against the overall economic picture. This scenario favors tactical trades rather than long-term bets. In addition to the storm, rising geopolitical tensions are bolstering the market. Shipping risks in the Red Sea, where traffic through the Suez Canal dropped by over 40% in late 2025 compared to the previous year, provide price support. These issues limit potential declines, even when US production rebounds from the freeze. However, we also need to think about demand. Recent manufacturing data from China was slightly below expectations, and the latest US inflation report indicated core inflation remains steady at 2.9%. These factors could dampen any significant price increases, suggesting that global demand may not be strong enough to maintain higher prices. As seen with similar weather events in previous years, price spikes can reverse once production normalizes. However, with OPEC+ committed to production cuts through the first quarter of 2026, the overall supply remains tight. This commitment magnifies the effects of any unexpected outages like the current one. Create your live VT Markets account and start trading now.US Dollar Index (DXY) rises to 96.00 after recent declines amid repositioning
The US Dollar Index (DXY) has bounced back to 96.00 after a downturn. Traders are adjusting their positions ahead of the Federal Open Market Committee (FOMC) meeting. The dollar gained against the New Zealand Dollar but weakened against the Euro and the British Pound.
Impact of the Federal Reserve
The Federal Reserve is expected to keep interest rates steady, but all eyes are on Fed Chair Jerome Powell for hints about future moves. Many in the market anticipate more rate cuts in 2026, which could influence the dollar’s value. Concerns about the Fed’s independence and possible actions from President Trump may also restrict the dollar’s strength. We are observing some adjustments in the US Dollar Index as the Fed decision approaches, bringing it back to the 96.00 mark. This appears to be short-covering, not a significant change in sentiment, as the overall outlook remains negative. Derivative traders might see this increase as a chance to set up new short positions at better levels. The market is eager for signs of at least two more rate cuts this year, supported by recent economic data. The December 2025 Consumer Price Index (CPI) report indicated that inflation has cooled to 2.8%, giving the Federal Reserve room to lower policies further. The CME FedWatch Tool shows a greater than 70% probability of a rate cut by the March meeting, indicating ongoing pressure on the dollar. Political uncertainty adds more risk, which could limit any significant rallies for the dollar. Concerns about the Federal Reserve’s autonomy and recent hints from the administration about restarting trade tariff talks with the European Union are dampening market sentiment. This can shift investments towards safer options like the Japanese Yen and Swiss Franc, skipping the dollar.Planning Currency Strategies
With potential for increased volatility after the Fed announcement and ongoing political events, buying put options on USD-related pairs like USD/JPY may be a wise move. This strategy helps traders benefit from a fall in the dollar while clearly defining their maximum risk. Consider options that expire after the March FOMC meeting to take advantage of the anticipated first rate cut. The dollar is showing general weakness against major currencies, especially the Euro and Japanese Yen. Traders might think about selling DXY futures contracts if the index struggles to stay above 96.00 after the Fed’s announcement. Another approach is to consider currency pairs that exclude the dollar, such as going long on EUR/JPY, which could help benefit from overall market trends while avoiding the risks tied to US events. This situation mirrors what we saw in late 2020 and early 2021, when a very supportive Fed policy led to a prolonged period of dollar decline. Last week’s technical drop below the important 97.00 support level strengthens this negative outlook. Historical trends suggest that the dollar’s path likely leans downward in the coming weeks. Create your live VT Markets account and start trading now.S&P 500 reaches all-time high, confirming bullish momentum and potential for further gains
The S&P 500 (SPX) has reached a new high, reflecting strong upward movement since its low in November 2025. This rise follows a five-wave pattern similar to Elliott Wave analysis.
Wave Pattern Analysis
The first wave, ((i)), ended at 6986.33, marking the start of the upward trend. Wave ((ii)) formed a zigzag pattern and concluded at 6788.03, indicating a significant level of completion. Next, wave ((iii)) took the index higher, reaching 6988.82 after several ups and downs. While we expect some short-term corrections, the overall trend remains positive as long as the index stays above 6788.03. Market resistance appears weak, with buyers likely to step in during corrections, typically in three, seven, or eleven swings. This shows that the market remains strong. The article also covers other financial assets, such as gold, which is performing well ahead of Federal Reserve decisions. Additionally, it examines currency pairs like EUR/USD and GBP/USD, as well as cryptocurrencies like Bitcoin Cash and Avalanche. There is also advice on selecting brokers and trading strategies for 2026, addressing various needs from low spreads to high leverage in different market segments.Market Trends And Opportunities
The S&P 500 achieving an all-time high confirms the bullish trend that started in November 2025. This upward movement is backed by positive economic data, like the recent report showing a solid 2.5% annualized growth in Q4 2025 GDP. This suggests that the upward momentum is well-supported. We anticipate a brief pullback in the current rally before hitting new highs, completing a short-term wave structure. For derivative traders, this dip provides a chance to start or increase bullish positions, such as buying call options or selling cash-secured puts. With the VIX currently around 13.5, option premiums are not excessively high, enhancing the appeal of these strategies. A key level to monitor is 6788.03; as long as the index remains above this mark, any pullbacks should be seen as temporary corrections. This strong market structure is further supported by easing inflation, with the December 2025 CPI at 2.8%, reducing pressure on the Federal Reserve. As a result, market expectations, indicated by the CME FedWatch Tool, show over a 90% likelihood that the Fed will maintain current interest rates at its next meeting. Historically, we have seen similar strong uptrends, such as in 2023, where momentum sustained the market even amid concerns about valuations. The current rally is also validated by a robust earnings season, with major tech and growth stocks exceeding revenue forecasts for the last quarter of 2025. This trend suggests that buyers will likely continue to appear during any market dips as they seek to benefit from ongoing growth. Create your live VT Markets account and start trading now.Dividend Adjustment Notice – Jan 28 ,2026
Dear Client,
Please note that the dividends of the following products will be adjusted accordingly. Index dividends will be executed separately through a balance statement directly to your trading account, and the comment will be in the following format “Div & Product Name & Net Volume”.
Please refer to the table below for more details:
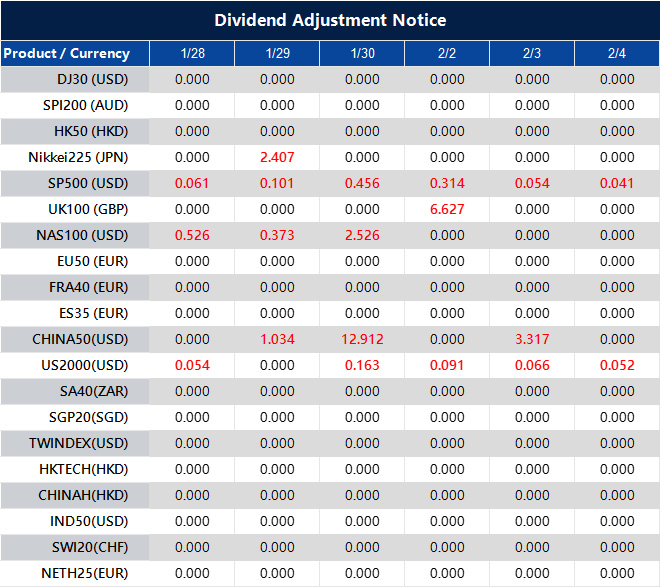
The above data is for reference only, please refer to the MT4/MT5 software for specific data.
If you’d like more information, please don’t hesitate to contact [email protected].
Silver rises toward $113.50 amid economic uncertainties, as focus turns to the Fed’s interest rate decision
Silver prices rose to about $113.50 during the Asian session on Wednesday, increasing by 1.30%. This surge is mainly driven by economic and geopolitical uncertainties, as well as expectations of US interest rate cuts.
The US Dollar has dropped to its lowest level since February 2022, influenced by remarks from US President Donald Trump. A weaker dollar supports silver, which is priced in USD.
Talks about the US Federal Reserve’s interest rates and the potential appointment of a new Chair, possibly Rick Rieder from BlackRock, also impact silver prices. The Fed is expected to keep interest rates stable after earlier cuts at the end of 2025.
Analysts predict a high chance of rate cuts in the second half of 2026, possibly in June. Lower interest rates could benefit silver since it doesn’t yield interest, reducing opportunity costs for investors.
Silver has seen over a 200% increase in value over the past year. However, some investors may take profits. Many view silver as a good alternative to gold for diversifying portfolios, thanks to its intrinsic value and performance during inflation.
Silver prices can change due to various factors such as geopolitical unrest, interest rates, and the strength of the US Dollar. Industrial demand and the price movements of gold also affect silver’s value.
Currently, silver prices are nearing $113.50, driven by a weaker US Dollar and safe-haven investment demand. The market is closely watching the Federal Reserve’s interest rate decision today, which could create significant price volatility. This is a crucial moment for traders in the coming weeks.
Recently, the US Dollar Index fell below 90.00 for the first time since early 2022, providing a boost to silver. Traders expecting further price gains might consider buying call options with strike prices around $115 or $120. This approach allows them to benefit from the current trend with controlled risk if the Fed indicates a softer stance in its upcoming decisions.
However, we must remember that silver has increased over 200% since last year, leading to overbought conditions not seen since 2011. This extreme movement suggests a potential sharp reversal, especially if the Fed takes a hawkish position. Buying put options with strike prices below $110 could serve as a smart hedge or a direct bet on a significant price drop.
Given the uncertainty of the Fed’s comments, a sharp price swing could happen in either direction. Traders can consider options strategies like a long straddle, which involves buying both a call and a put option at the same strike price. This strategy profits from significant price changes, no matter which direction it goes.
The Gold/Silver ratio has also dropped significantly to nearly 45:1, well below its average of about 65:1 in the 21st century. This suggests that silver may be overvalued compared to gold in the short term. We should watch for this ratio to balance out, either through a decrease in silver prices or an increase in gold prices.
Additionally, there are reports indicating that industrial demand weakened in the last quarter of 2025 due to high input costs. Recent data from the China Federation of Logistics & Purchasing showed a slight decline in manufacturing PMI, pointing to a fundamental challenge that the current speculative excitement may be overlooking.
Gold rises above $5,220 during Asian trading due to a falling dollar and geopolitical tensions.
Gold price (XAU/USD) has reached a new high of around $5,220 during Asian trading on Wednesday. This rise is due to a weaker US Dollar, geopolitical tensions, and economic uncertainty, as traders await the Federal Reserve’s interest rate decision.
US President Donald Trump stated that the Dollar is strong, which caused the US Dollar Index to drop to its lowest point since February 2022. This decline helps commodities priced in USD, like Gold, providing extra support.


