During early European trade, NZD/USD retraced half its gains and stayed under pressure above 0.6000 as the dollar remained fragile
NZD/USD erased about half of its early gains in Monday’s early European trade after sellers appeared above 0.6000. The pair still traded 0.13% higher, near 0.5980.
The US Dollar stayed under pressure as uncertainty around US trade policy returned. The US Dollar Index (DXY) fell 0.35% to around 97.45.
Even after the Supreme Court limited Trump’s earlier tariffs, new 15% duties still left the US dollar weaker
The US Dollar weakened after a Supreme Court ruling said President Donald Trump exceeded his authority when he imposed broad global tariffs on most US trading partners. Officials then announced new 15% tariffs under a different law.
Earlier, the Dollar was steady after US data releases, including personal consumption expenditure. The Dollar Index (DXY) finished Friday at 97.79, down 0.13%, after hitting a low of 97.58.
Market Focus Shifts To New Tariff Plan
Attention now shifts to Trump’s new tariff plan, along with upcoming US data and communication from the Federal Reserve. Trump’s State of the Union is also seen as a possible driver of DXY and overall Dollar sentiment. The US economic calendar starts tonight with the Chicago Fed National Activity Index for January. The article notes it was produced with help from an AI tool and reviewed by an editor. We saw a similar setup last year. A Supreme Court ruling on tariffs caused a sharp—but temporary—drop in the DXY. This is a reminder that political headlines can quickly outweigh economic data. The main point was the jump in short-term volatility, not a lasting change in direction. With uncertainty high, implied volatility in FX options is rising. The Deutsche Bank FX Volatility Index (CVIX) has moved up to 7.8, its highest level this year. This shows markets expect bigger-than-normal swings in the Dollar. Because of that, it may make more sense to use strategies that benefit from volatility, rather than trying to guess the next direction.Positioning For Volatility Rather Than Direction
Buying option straddles on major pairs like EUR/USD ahead of key events—such as upcoming Fed statements or trade announcements—can be a sensible approach. It can profit from a large move either up or down. Many traders found this worked well during the tariff confusion of 2025. Historical data from the 2018–2019 trade disputes shows that early tariff headlines often pushed the DXY more than 0.75% within 24 hours. Last year’s event followed the same pattern, and similar knee-jerk moves may happen again in the coming weeks. This makes unhedged, short-term directional bets especially risky right now. For traders already holding long-dollar positions, buying out-of-the-money puts on a Dollar index ETF such as UUP can be a lower-cost way to hedge against a sudden drop. The market is currently pricing in a 35% chance the DXY reaches 96.50 within the next 30 days. That makes portfolio protection an important focus heading into March. Create your live VT Markets account and start trading now.In late Asian trade, AUD/USD reverses below 0.7100, sliding to 0.7065 as the Australian dollar broadly underperforms
AUD/USD erased earlier gains after sellers stepped in above 0.7100. The pair fell 0.23% to around 0.7065 in late Asian trading on Monday, as the Australian Dollar weakened.
The US Dollar rose against the Australian Dollar, but it underperformed most other major currencies as new uncertainty around US trade policy weighed on sentiment. The US Dollar Index (DXY) was down 0.3% near 97.50.
Trade Policy Uncertainty
The US Supreme Court ruled that President Donald Trump exceeded his authority under the International Emergency Economic Powers Act (IEEPA) when backing broad tariffs. The decision also struck down additional import duties. Trump later announced 15% global tariffs. On the technical side, AUD/USD has stayed in a 0.7045–0.7100 range for more than a week. The 20-day EMA is rising at 0.7015, while the 14-day RSI remains between 40.00 and 60.00. If momentum improves, the pair could climb toward the 12 February high of 0.7147. If the RSI weakens, it may signal consolidation and softer near-term momentum. The US Dollar is the most traded currency in the world. It accounts for more than 88% of global FX turnover—about $6.6 trillion per day in 2022. The Federal Reserve targets 2% inflation and uses interest rates, QE, and QT to influence the Dollar.Looking Back At Last Year
Last year showed how quickly unexpected trade policy headlines can move AUD/USD. In 2025, the pair repeatedly struggled around 0.7100, and that period helped shape later market behavior. The main lesson was clear: global trade uncertainty often hurts the risk-sensitive Australian Dollar more than the US Dollar, even when the US is the source of the policy shock. As of February 23, 2026, the fundamental outlook is clearer and is largely driven by central bank policy differences. Recent US inflation data showed core CPI still elevated at 3.1%, which has kept the Federal Reserve from signaling near-term rate cuts. By contrast, Australia’s latest quarterly inflation report showed inflation cooling to 2.8%. This has increased expectations that the Reserve Bank of Australia could cut rates by the third quarter. This widening policy gap is weighing on AUD/USD, which is trading near 0.6650. The interest rate difference favors holding US Dollars and remains a strong headwind for the Aussie. Iron ore, Australia’s top export, has also fallen about 8% since December 2025 due to concerns about global industrial demand. For derivatives traders, this setup points to a bearish bias for AUD/USD over the next few weeks. One simple approach is buying put options with a strike near 0.6500. This provides downside exposure while limiting risk, unlike shorting spot FX directly. Implied volatility has been moderate, with the CVOL index for major pairs near 8.5, so option premiums have not been unusually expensive. If you expect the pair to move sideways or drift lower, a bear call spread is another option. This involves selling a call slightly above current resistance and buying a further out-of-the-money call to cap risk, allowing you to collect premium if AUD/USD stays below the short strike. Create your live VT Markets account and start trading now.Dividend Adjustment Notice – Feb 23 ,2026
Dear Client,
Please note that the dividends of the following products will be adjusted accordingly. Index dividends will be executed separately through a balance statement directly to your trading account, and the comment will be in the following format “Div & Product Name & Net Volume”.
Please refer to the table below for more details:
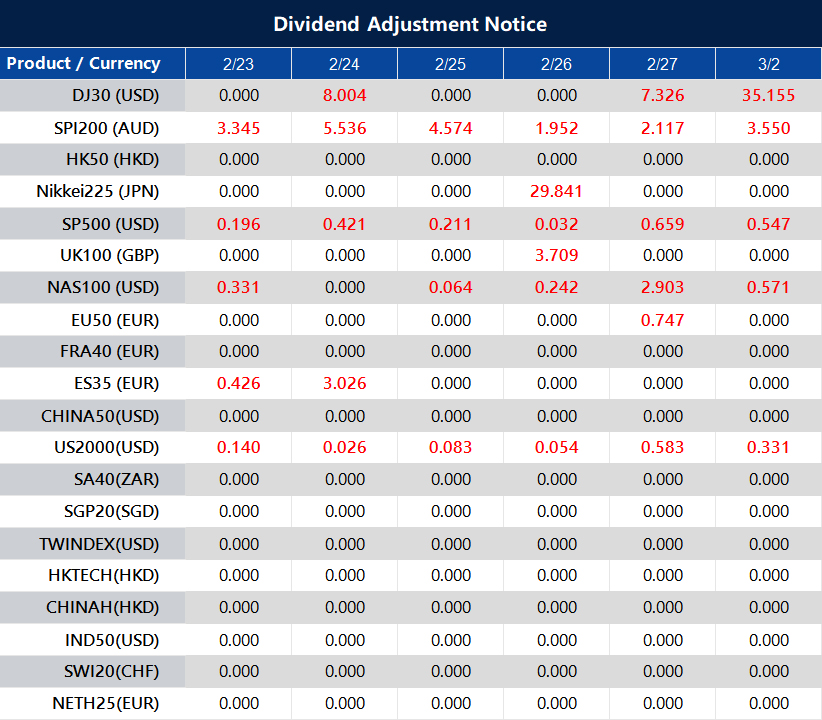
The above data is for reference only, please refer to the MT4/MT5 software for specific data.
If you’d like more information, please don’t hesitate to contact [email protected].
Tariff doubts lift the Swiss franc, pushing USD/CHF down toward 0.7725 in early European trade
USD/CHF fell to around 0.7725 in early European trading on Monday, dropping below 0.7750 as the Swiss Franc strengthened. The move followed a weaker US Dollar, driven by uncertainty over US tariff policy.
On Friday, the US Supreme Court struck down President Donald Trump’s reciprocal tariffs. Trump then said he plans a new 15% global import tariff, which raised fears of another trade conflict.
Safe Haven Demand Lifts Swiss Franc
Markets are also watching rising US-Iran tensions, which are boosting demand for the Swiss Franc as a safe-haven currency. The New York Times reported on Sunday that Trump is considering limited airstrikes against Iran. Trump said a bigger attack could be considered in the coming months if diplomacy—or any initial action—fails to persuade Iran to abandon its nuclear programme. The US and Iran are set to hold their next talks in Geneva on Thursday. Traders are also preparing for the US January Producer Price Index report on Friday. If the number comes in above expectations, it could lower hopes for Federal Reserve rate cuts and support the US Dollar. The story was corrected on 23 February at 6:35 GMT to clarify that US-Iran tensions support the Swiss Franc and put pressure on USD/CHF.Tariff Uncertainty And Market Volatility
Uncertainty over global tariffs is once again creating conditions that usually support the Swiss Franc against the US Dollar. Risk-off sentiment is building, similar to what markets saw during the trade disputes in the years leading up to 2025. This suggests USD/CHF could face more downside pressure. This backdrop can also lift implied volatility, which makes options more attractive. With the VIX—often used as a gauge of market fear—recently rising to 21 from 18, buying USD/CHF put options may offer a direct way to benefit if the pair falls further. These positions can also help protect against sudden drops triggered by unexpected geopolitical headlines. The Swiss Franc is also gaining support from ongoing tensions in the South China Sea. In periods of global stress, money often moves into Switzerland, and that pattern has appeared many times before. Switzerland’s political and economic stability stands out at a time when policy remains uncertain elsewhere. Different inflation trends are another factor. US inflation is still firm at 3.1%, while Swiss inflation has cooled to 1.5%. This leaves the Federal Reserve with a harder job, while the Swiss National Bank has more room to act. That difference supports a stronger Franc versus the Dollar. Traders are now looking ahead to the next US jobs report and the next round of trade talks. Any sign of a weaker US labour market or stronger trade rhetoric could speed up a fall in USD/CHF. Short-dated options that expire after these key events may be a practical way to trade the expected price swings. Create your live VT Markets account and start trading now.FXStreet-compiled figures show that gold prices in Saudi Arabia rose, with bullion gaining value in the latest session.
Gold prices in Saudi Arabia rose on Monday, according to FXStreet data. Gold was priced at SAR 622.23 per gram, up from SAR 614.75 on Friday.
The price per tola rose to SAR 7,257.45 from SAR 7,170.38 on Friday. Other quoted rates were SAR 6,221.77 for 10 grams and SAR 19,353.50 per troy ounce.
How Saudi Gold Prices Are Calculated
FXStreet calculates Saudi gold prices by converting global gold prices into SAR using the USD/SAR exchange rate and standard local units. Prices are updated daily at the time of publication and are for reference only. Local market prices may differ. Central banks hold the most gold. According to the World Gold Council, they added 1,136 tonnes—worth about $70 billion—to their reserves in 2022. This was the highest annual total since records began. Gold often moves in the opposite direction of the US Dollar and US Treasury yields. It can also move opposite to riskier assets. Key price drivers include geopolitical tensions, recession concerns, interest rates, and the strength of the US Dollar, since gold is priced in dollars (XAU/USD). As of February 23, 2026, gold at SAR 19,353.50 per troy ounce suggests broader market support, not just a local move. It shows gold’s continued appeal in today’s economic climate. This support may affect volatility and price direction in the coming weeks.Key Drivers To Monitor
Gold’s reputation as a safe-haven has been reinforced by the geopolitical instability seen throughout 2024 and 2025. Ongoing global tensions continue to push investors toward assets that are less tied to any single government or economy. That makes gold a common hedge when equity markets turn more volatile. Central banks—especially in emerging markets—have kept buying heavily, following the record-setting pace of 2022 and 2023. Recent World Gold Council data shows central banks added more than 950 tonnes to reserves in 2025. This steady demand can help support prices and leaves less supply for private investors and traders. Interest rates remain another key factor. After the Federal Reserve’s rate pauses in 2025, markets are now increasingly expecting cuts later in 2026. Lower rates reduce the cost of holding a non-yielding asset like gold. They can also weaken the US Dollar, which often moves in the opposite direction to gold. For derivatives traders, this setup may favor strategies that benefit from more upside or higher volatility. Examples include buying call options or using bull call spreads on gold futures or ETFs. These approaches can offer defined risk while targeting a potential rally driven by safe-haven demand, ongoing central-bank buying, and looser monetary policy. Create your live VT Markets account and start trading now.FXStreet data shows gold prices in the Philippines rose as the precious metal gained in local markets today
Gold prices in the Philippines rose on Monday, according to FXStreet data. Gold cost PHP 9,580.69 per gram, up from PHP 9,460.40 on Friday.
Gold also rose to PHP 111,747.30 per tola from PHP 110,344.30 per tola. Other listed prices were PHP 95,806.70 for 10 grams and PHP 297,994.10 per troy ounce.
Philippine Gold Price Calculation
FXStreet calculates Philippine gold prices by taking the global gold price and converting it using the USD/PHP exchange rate and local gold units. Prices are updated daily using market rates at the time of publication, but local prices may differ. Central banks hold the largest gold reserves. According to the World Gold Council, they added 1,136 tonnes of gold in 2022, worth about $70 billion. This was the biggest yearly total on record. Gold often moves in the opposite direction of the US Dollar and US Treasury yields. It can also move against risk assets like stocks. Gold prices may react to geopolitical events, recession worries, and changes in interest rates. The US Dollar matters because gold is priced in dollars (XAU/USD). Gold prices are now being pulled by competing economic forces. The metal is finding it hard to break clearly higher or lower as markets absorb Federal Reserve comments from late 2025 that pointed to a pause in rate changes. This has kept the US Dollar fairly strong, which puts pressure on dollar-priced assets like gold.Market Outlook And Trading Implications
Even so, gold still has strong support because central banks continue to buy. After the record buying in 2022, the trend has remained strong. The World Gold Council says central banks added more than 950 tonnes to their reserves through 2025. This steady demand can help hold prices up and makes a major drop less likely. Gold’s role as a safe-haven matters more when geopolitical risks are high and stock markets show signs of slowing. We believe that if risk assets sell off, money could quickly move into gold. This negative relationship is a key reason investors hold gold during uncertain periods. For derivatives traders, this backdrop suggests volatility may be priced too low. We see potential in buying long-dated call options in case the Fed turns more dovish later this year. At the same time, the strong support level may make selling out-of-the-money puts appealing as a way to earn premium. Currency moves also matter, especially in the Philippines. If the US Dollar stays strong, gold can rise in peso terms even if it trades sideways in US dollars. That can add returns for investors and traders who do not base their accounts in dollars. Create your live VT Markets account and start trading now.Singapore’s year-on-year Consumer Price Index rises to 1.4% in January, up from 1.2% previously
Singapore’s consumer price index (CPI) rose 1.4% year on year in January, up from 1.2% in the previous month.
That means inflation increased by 0.2 percentage points versus the prior reading. No additional breakdown was provided.
Implications For Mas Policy
January’s rise in inflation to 1.4% year over year suggests that disinflation may be losing momentum. We have been positioned for a neutral Monetary Authority of Singapore (MAS) for weeks, but this print requires a rethink. The market is now starting to reduce expectations for any policy easing at the April 2026 meeting. We see the clearest reaction in interest rate derivatives—specifically by selling 3-month SORA futures contracts. This position benefits if short-term rates move higher, which is a likely outcome if MAS turns more hawkish. We saw a similar move in 2025, when a surprise inflation print in Q3 triggered a sharp sell-off in these contracts. This inflation reading also supports our bullish view on the Singapore Dollar, since MAS uses the exchange-rate band as its main policy tool. We are looking to buy SGD call options versus the USD, expecting the central bank to prefer a stronger currency to limit import-price pressures. During the 2022–2023 tightening cycle, SGD strengthened by more than 5% against the dollar as MAS adjusted its policy band five times in a row. In equities, steady inflation and the risk of tighter policy are headwinds for the Straits Times Index (STI). Higher interest rates can weigh on corporate earnings and growth, which helped cap the index through much of 2025. We are considering buying put options on the STI as a hedge against a potential decline into the second quarter.Equity Market Risk Considerations
Create your live VT Markets account and start trading now.FXStreet data shows gold prices in the United Arab Emirates rose overall today, with bullion trading higher.
Gold prices in the United Arab Emirates rose on Monday, according to data compiled by FXStreet. Gold traded at AED 609.17 per gram, up from AED 601.89 on Friday.
Gold also climbed to AED 7,105.25 per tola, from AED 7,020.34 on Friday. Other listed prices were AED 6,091.71 per 10 grams and AED 18,947.43 per troy ounce.
Uae Gold Price Snapshot
FXStreet calculates local gold prices by converting global prices using the USD/AED exchange rate and local units. Prices are updated daily at the time of publication and are meant as a guide, as local rates may vary slightly. Central banks are the largest holders of gold. World Gold Council data shows central banks added 1,136 tonnes of gold—worth about $70 billion—to their reserves in 2022. That was the biggest annual purchase since record-keeping began. Gold prices move with several factors, including the US Dollar, US Treasury yields, interest rates, investor risk appetite, geopolitical tension, and recession fears. Since gold is priced in US dollars (XAU/USD), a weaker Dollar often supports higher gold prices. Gold has posted a modest but clear rise, with prices now above AED 609 per gram. This increase follows a recent drop in the US Dollar Index, which fell below 101.5 last week for the first time this year. Because gold often moves opposite the Dollar, traders should keep a close eye on currency markets for signs of further Dollar weakness.Market Outlook And Trading Ideas
Markets are focusing on the Federal Reserve’s next steps. Futures markets now price in a 65% chance of a rate cut by the third quarter of 2026. Because gold does not pay interest, it tends to look more attractive when rates are expected to fall. In contrast, the steady rate environment through 2025 limited gold’s upside, so any shift in policy could matter. With this setup, implied volatility in gold options may rise in the coming weeks. Traders may consider buying call options or using bull call spreads to seek upside while clearly limiting risk. These strategies can benefit from a rally driven by geopolitical concerns or a more dovish turn from central banks. Central bank demand also remains an important support. Central banks added another 950 tonnes to reserves in 2025, extending the trend seen in recent years. This ongoing institutional buying helps create a strong floor under prices. Any escalation in maritime disputes or trade tensions could further strengthen gold’s safe-haven appeal. Record highs in equities also strengthen the case for hedging with gold. The S&P 500 price-to-earnings ratio is near 24, a level that has often been linked to market pullbacks. Using gold futures as a hedge may help protect portfolios if risk assets decline. Create your live VT Markets account and start trading now.FXStreet data shows that gold prices in Pakistan climbed as the metal gained value across local markets
Gold prices rose in Pakistan on Monday, based on FXStreet-compiled data. Gold was priced at PKR 46,138.03 per gram, up from PKR 45,568.61 on Friday.
Per tola, gold increased to PKR 538,144.90 from PKR 531,503.40 on Friday. Listed prices were PKR 461,380.30 for 10 grams and PKR 1,435,053.00 per troy ounce.


