Germany’s annual producer prices fell 3% in January, below the expected 2.1% decline
Germany’s producer price index fell 3% year on year in January. That was a bigger drop than the expected 2.1%.
This data shows producer prices fell more than forecasts. It compares prices in January with the same month a year earlier.
Germany’s January producer price index fell 0.6% month on month, below the 0.3% forecast
Germany’s Producer Price Index (PPI) fell by 0.6% month on month in January.
This compared with a forecast rise of 0.3%.
German Ppi Confirms Deflation Trend
Germany’s January PPI fell by 0.6%, a much bigger drop than expected. It adds to the deflation trend seen in Germany’s industrial sector through 2025. In simple terms, prices at the factory gate are falling, which works against the European Central Bank’s inflation goals. A monthly fall of this size also suggests the year-over-year reading will stay deeply negative, and could be worse than the -7.8% level reached in late 2025. This report increases the chance that the ECB shifts to a more dovish tone. It also raises the odds of an interest rate cut before mid-year, which markets may price in quickly. Trades that benefit from falling rates may look more attractive, such as going long German 10-year Bund futures. For equities, it is a caution signal for the DAX. The index held up in the final quarter of 2025, but Germany’s economy still shrank by 0.3% over the full year. Weak producer prices point to ongoing pressure on the large industrial and manufacturing firms that make up much of the index. Consider hedging long exposure using put options, or expect the DAX to lag US indices. In FX markets, the data is negative for the euro. If the ECB moves closer to rate cuts while other central banks stay on hold, the widening policy gap could weigh on EUR/USD. The pair struggled to clear 1.09 last year, and this may be the trigger for a move back toward the 1.05 support area seen in autumn 2025. Because the result was a surprise, market volatility may rise. Europe’s main volatility index, the VSTOXX, could lift from current low levels. That can create opportunities for options strategies such as straddles on the Euro Stoxx 50, which can profit from a large move in either direction.Trading And Volatility Implications
Create your live VT Markets account and start trading now.Despite EUR/USD dipping below 1.18, options suggest investors are increasingly hedging dollar risk with EUR options
EUR/USD has slipped back below 1.18, close to where it traded before the earlier rally. Even so, the euro is only slightly higher against the U.S. dollar so far this year.
Since “Liberation Day,” options markets have acted differently from the spot market. When implied volatility rose, traders increasingly bought hedges that benefit from a stronger euro, rather than hedges that protect against a stronger U.S. dollar.
Options Market Signals Diverge
This shift did not last in other currencies during the second half of the year, as concerns about a falling dollar faded. But since 23 January—when a new leg of dollar weakness began—the move has been most noticeable in EUR/USD options. The information cited is based on only a few days of data. The article says it was produced with an AI tool and reviewed by an editor. Looking back to early 2025, options were already sending a clear message: markets were starting to treat dollar weakness as more structural. Even when EUR/USD pulled back in spot, traders still used options to hedge longer-term dollar downside. That suggested the euro was strengthening its role as the main alternative to the dollar. Now, with EUR/USD hovering near 1.16, that same options-market theme still matters. One-month risk reversals continue to price EUR calls at a premium to puts. This pattern has held since late 2025 and into this year. In simple terms, traders are still willing to pay more for protection against a rising euro (or a falling dollar) than for the opposite outcome.Watching Risk Reversals Closely
This is happening even though the Federal Reserve and the ECB both appear to be pausing on rates after last year’s changes. With U.S. inflation easing to around 2.5%, uncertainty remains—and that tends to increase demand for hedges. In this kind of market, derivatives flows can reveal more about positioning and risk than the spot price alone. In the weeks ahead, it’s worth watching the gap between a calm spot market and a more cautious options market. It may mean that buying EUR calls or using call spreads offers a relatively efficient way to position for sudden bursts of dollar weakness. Options pricing can also be a useful signal of deeper concern about where the dollar is headed. This behavior also supports the euro’s growing role since last year. IMF data for Q4 2025 still shows the dollar dominating global reserves at 59%, but the euro’s share has edged up to 21%. Options markets appear to be reflecting this slow shift: when global investors worry about the dollar, the euro is often their first alternative. Create your live VT Markets account and start trading now.During early European trade, the US Dollar Index holds near 98.00 ahead of US GDP and PMI data releases
The US Dollar Index (DXY) stayed close to 98.00 in early European trading on Friday. It was near an almost four-week high reached a day earlier. The move came after the release of the Federal Open Market Committee (FOMC) Minutes from the January meeting.
The Minutes suggested the Federal Reserve is not close to cutting interest rates. US inflation is still above the Fed’s 2% target.
Key Data In Focus
Markets are watching the preliminary US Q4 Gross Domestic Product (GDP) and S&P Global Purchasing Managers’ Index (PMI) data, due during North American trading hours. GDP is expected at an annualised 3%, down from 4.4% in the third quarter of 2025. The S&P Global Composite PMI is expected to rise from 53.0, supported by stronger manufacturing and services activity. The US Bureau of Economic Analysis (BEA) publishes GDP each quarter and reports it at an annualised rate. The BEA releases an initial GDP estimate and then revises it twice. The third release is treated as the final reading. Data like GDP and PMI are widely used to track overall US economic activity. The US Dollar is holding firm around 98.00, and we expect that strength to continue over the next few weeks. Fed officials have signalled they will not cut rates quickly while inflation remains above 2%. This policy message is the main reason the dollar is staying strong.Derivatives Trading Implications
Next up is the preliminary GDP report for Q4 2025. The market expects growth to slow to 3% from 4.4% in Q3, but 3% is still strong. For comparison, the US economy grew by 3.3% in the final quarter of 2023. If GDP comes in strong, it would support the Fed’s slow-and-steady approach and help the dollar. This setup is similar to the long pause in rate hikes we saw from mid-2024 into 2025. During that period, the “higher for longer” theme kept the dollar supported against other major currencies. We expect a similar pattern as markets push back expectations for rate cuts. For derivatives traders, this argues for positioning for continued dollar strength over the next several weeks. One simple approach is to buy call options on the US Dollar Index, or on dollar-tracking ETFs, to gain upside exposure. This may be especially relevant ahead of the February PMI data, since stronger activity would likely delay any rate-cut discussion. Uncertainty around the timing of the Fed’s eventual shift can also drive volatility. That volatility can be traded. Options can be used to target price swings around key data releases. For example, a long straddle on a major pair like EUR/USD could pay off if GDP or PMI results are far from expectations and trigger a sharp move in either direction. Finally, it makes sense to focus on currency pairs where policy paths are separating the most. If the Fed stays on hold, selling futures on currencies whose central banks are more likely to cut rates can offer a clear opportunity. This favours trades that are long the US dollar versus weaker currencies. Create your live VT Markets account and start trading now.Dividend Adjustment Notice – Feb 20 ,2026
Dear Client,
Please note that the dividends of the following products will be adjusted accordingly. Index dividends will be executed separately through a balance statement directly to your trading account, and the comment will be in the following format “Div & Product Name & Net Volume”.
Please refer to the table below for more details:
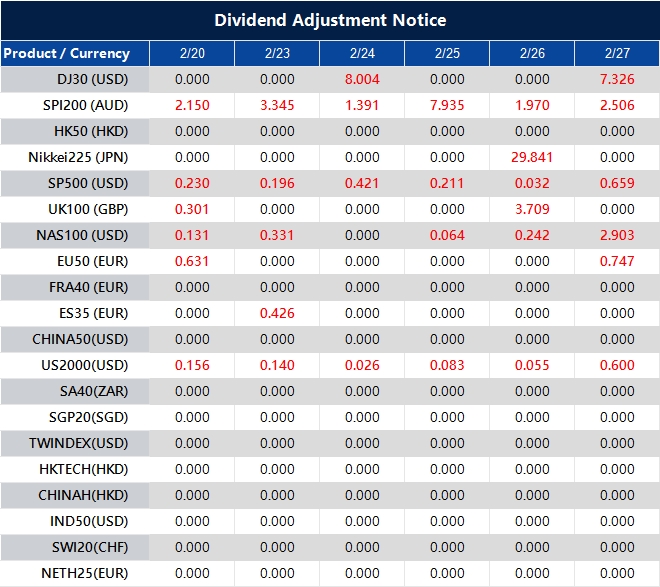
The above data is for reference only, please refer to the MT4/MT5 software for specific data.
If you’d like more information, please don’t hesitate to contact [email protected].
Scotiabank says GBP/USD is holding below 1.35 as weak jobs data and tighter yield spreads increase sterling’s vulnerability
GBP/USD is trading below 1.35 and is extending its weekly losses. Weaker UK jobs data and narrower yield spreads have reduced support for the pound, as markets reprice expectations for Bank of England easing.
Markets are now focused on Friday’s UK retail sales and preliminary PMI releases. Forecasts point to solid services growth and modest manufacturing expansion. That means any weaker-than-expected readings could weigh on the pair.
Technical Breakdown Signals Further Risk
On the charts, GBP/USD has broken below the 50-day moving average at 1.3529. This increases the risk of a move below the 200-day moving average at 1.3445, and could open the door to a retest of January lows in the mid-1.33s. The report was produced using an AI tool and reviewed by an editor. The piece is attributed to the FXStreet Insights Team, which compiles market observations from selected experts and analysts. This follows a familiar pattern: breaking a key moving average often signals weakness in the pound. A similar setup appeared in early 2022, when GBP/USD fell through its 50-day moving average above 1.35 and then dropped sharply. That decline was driven by signs of a weakening UK economy and changing interest rate expectations. The fundamentals are different now, but the pressure on sterling remains. Then, markets were leaning toward future rate cuts. Now, the Bank of England is staying cautious after January inflation held firm at 3.1%, even as the UK’s Q4 2025 GDP showed zero growth. Sticky inflation alongside a flat economy creates a tough backdrop for the pound.Dollar Strength And Rate Differentials In Focus
On the US side, recent non-farm payrolls data continues to point to a resilient labor market. That gives the Federal Reserve little reason to ease policy. It supports the US dollar and keeps the UK-US yield spread from turning in the pound’s favor. This dynamic is keeping GBP/USD under pressure. For traders, this argues for positioning for more downside in GBP/USD, but possibly at a gradual pace. One approach is a bear put spread: buy a put option at one strike and sell another put at a lower strike. This reduces the upfront cost and sets a clear maximum risk. It may suit traders looking for a controlled move lower toward the 1.2500 support area in the coming weeks. History also shows how quickly sterling can fall when policy risks rise, as seen during the 2022 fiscal crisis. Implied volatility is much lower now than it was then, which makes option strategies cheaper. This can be a way to take a bearish view without paying heavily for protection against extreme moves. With the UK Spring budget due in March, short-dated put options may also work as a tactical hedge. If fiscal announcements disappoint, GBP/USD could react negatively. This offers a lower-cost way to guard against a sudden drop while watching for a possible retest of the late-2025 lows. Create your live VT Markets account and start trading now.Seller pressure keeps GBP/USD falling for a fifth straight session, returning near the previous low from last month
GBP/USD fell for a fifth straight day on Friday, sliding back toward the near one-month low set on Thursday. It traded below the mid-1.3400s during the Asian session as markets waited for new US data.
The second estimate of US Q4 GDP and the US Personal Consumption Expenditure (PCE) Price Index are due later. Traders are using these releases to judge the Federal Reserve’s rate-cut path. This has helped keep the US dollar near its highest level since 23 January.
Bank Of England Policy And Uk Data
The Bank of England held rates at 3.75% in February, with the vote split 5-4. Four members supported a 25 basis point cut. UK unemployment rose to 5.2%, payrolls fell by 30K, headline CPI eased to 3%, and the Retail Price Index dropped to 3.8%. Minutes from the US Federal Open Market Committee described growth as “solid” and warned that progress toward the 2% inflation target could be “slower and more uneven.” Some members said further rate hikes could still be possible if inflation rises again. Friday’s UK retail sales and preliminary PMI data, along with US GDP and core PCE, arrive ahead of the March BoE decision. The pound is weakening sharply against the US dollar and is still in the downtrend that began last year. The main driver is the growing gap between the UK and US economic outlooks. Derivatives traders should expect this divergence to continue in the coming weeks.Trade Approaches And Volatility Positioning
Last year, the Bank of England came close to voting for a rate cut from 3.75% as unemployment rose and inflation fell. That shift toward a more dovish stance came too early, but the UK economy is still under pressure. Recent data shows inflation is still stuck around 3.1%, while Q4 2025 GDP growth was only 0.2%. This leaves the BoE in a tough spot and limits how much it can support the pound. In contrast, the US economy is still showing the steady growth the Federal Reserve highlighted in 2025. The January 2026 non-farm payrolls report far exceeded expectations, adding 255,000 jobs and keeping unemployment low at 3.6%. Strong data like this supports the Fed’s “higher for longer” stance, which makes the US dollar more appealing. With this setup, traders may consider buying GBP/USD put options to hedge against, or profit from, a move below 1.3400. Another approach is to take short positions in the futures market to benefit if GBP/USD keeps falling. The gap in policy direction could also increase price swings, which may suit volatility-focused traders. Ahead of upcoming UK and US inflation reports, straddle or strangle strategies may work well. These positions can profit from a large move in either direction, without needing to predict the data outcome. Create your live VT Markets account and start trading now.After weaker S&P Global PMI data, the Australian dollar stays lower as AUD/USD hovers near 0.7040
The Australian Dollar stayed lower against the US Dollar in Asian trading on Friday. AUD/USD was near 0.7040 after giving back earlier gains.
The move followed S&P Global’s preliminary February PMI data. The figures showed slower overall growth, while price pressures stayed firm.
Australian Growth Signals Cooling
Australia’s Composite PMI fell to 52.0 in February from 55.7 in January, marking a seventeenth straight month of expansion. The Services PMI slipped to 52.2 from 56.3, and the Manufacturing PMI edged down to 51.5 from 52.3. The US Dollar also found support after US initial jobless claims fell to 206K for the week ending 14 February. That was down from a revised 229K and below the 225K forecast. Markets are also focused on preliminary US Q4 GDP and PCE data due Friday. Minutes from the Federal Open Market Committee’s January meeting showed officials may consider further rate hikes if inflation stays persistent. Most supported keeping rates steady, only a few backed a cut, and the Fed signaled it could consider easing if inflation cools as expected. The Reserve Bank of Australia targets 2–3% inflation through interest rate settings and can also use quantitative easing or tightening. Iron ore is Australia’s largest export, worth $118 billion a year in 2021, and China is the main destination.Market Implications For Aud Usd
The Australian Dollar is weakening as the economy shows clearer signs of cooling. The Composite PMI drop to 52.0 from 55.7 suggests growth is slowing, even as inflation pressures remain. A softer growth outlook lowers the chance the Reserve Bank of Australia (RBA) will raise rates, which puts pressure on the AUD. The RBA faces a difficult balance because inflation is still above target. Inflation ended 2025 at 4.1% year over year. While the cash rate has been held at 4.35%, weaker growth makes further hikes harder to justify and limits support for the AUD. Derivative traders may see this as a ceiling on near-term upside for the Aussie. China is another major drag on the currency. As Australia’s largest trading partner, China’s weaker manufacturing activity matters directly. Its official PMI has struggled to stay above 50, the level that signals expansion. That weakness can reduce demand for Australian exports. This is also showing up in iron ore prices, Australia’s top export. After trading above $140 per tonne late last year, prices have dropped to around $120—down more than 14%—as markets worry about Chinese demand. Falling commodity prices are a direct headwind for the AUD. At the same time, the US Dollar is gaining strength, which makes the AUD/USD decline more pronounced. Strong US labor data, including the drop in jobless claims to 206K, along with sticky inflation, is increasing expectations the Federal Reserve will keep rates higher for longer. This widening gap between central bank outlooks supports the US Dollar. With these factors combining, traders may look for further weakness in AUD/USD in the weeks ahead. Possible strategies include buying put options to profit from a break below key support levels, or selling AUD/USD futures. These approaches fit the current trend: slowing growth in Australia and a relatively stronger US outlook. Create your live VT Markets account and start trading now.Higher oil prices lift the Canadian dollar, pushing USD/CAD down toward 1.3695 as investors watch US data
USD/CAD dipped to around 1.3695 in early European trading on Friday. The Canadian Dollar strengthened as crude oil prices rose. Markets were waiting for Canada’s Retail Sales data, plus the US advance Q4 GDP report and the US PCE Price Index.
Geopolitical risks pushed oil higher and supported the oil-linked Canadian Dollar. US President Donald Trump said Iran had 10 to 15 days to reach a deal on its nuclear programme. He warned of “really bad things” if no deal is reached.
Oil Prices Support Canadian Dollar
US data also moved the pair. Strong US numbers can lift the US Dollar and reinforce a more hawkish Federal Reserve view. US Initial Jobless Claims fell to 206,000 for the week ending February 14. That was below the 225,000 forecast and down from the prior week’s revised 229,000. Later on Friday, traders were set to watch the US PCE inflation data for December and a preliminary Q4 GDP reading. If these come in weaker than expected, the US Dollar could soften in the near term. The Canadian Dollar is shaped by several factors, including Bank of Canada interest rates, oil prices, growth, inflation, and the trade balance. The BoC targets inflation between 1% and 3%. It can also use quantitative easing or tightening to influence credit conditions. USD/CAD is showing weakness near 1.3700 as the Canadian Dollar gets support from higher oil prices. This sets up a clear tug-of-war: stronger commodities versus a still-firm US Dollar. Volatility may stay elevated as these forces compete in the weeks ahead. The loonie is getting help from ongoing energy supply concerns. West Texas Intermediate crude is holding above $82 per barrel. As seen during periods of Persian Gulf tension in 2025, geopolitical risk can lift oil prices quickly. At the same time, OPEC+ production discipline is helping keep prices firm. Since Canada is a major oil exporter, higher oil prices are a fundamental boost for the Canadian Dollar.Key Drivers To Watch Ahead
The US Dollar, however, continues to benefit from a solid US economy and a cautious Federal Reserve. Recent data has kept jobless claims near 210,000. The latest Core PCE inflation reading for January was 2.9%, slightly above expectations. While inflation is easing, it remains sticky enough for markets to dial back expectations of aggressive Fed rate cuts in 2026. Next, traders will focus on Canada’s monthly GDP data and the next Bank of Canada policy meeting for local signals. In the US, the early-March Non-Farm Payrolls report will be a key release and could shift expectations for Fed policy. These events may become major drivers of the USD/CAD exchange rate. This push and pull between a hawkish Fed and strong oil prices suggests USD/CAD could stay range-bound, but still swing sharply on surprise data. That backdrop can suit options strategies that target volatility or defined ranges ahead of major releases. Avoid chasing breakouts until one side of the story becomes clearly dominant. Market moves in 2025 were a reminder of how fast sentiment can change. Surprise inflation data pushed the Fed toward a “higher for longer” message, and the US Dollar strengthened quickly. Traders who were not prepared for both sides of the USD/CAD narrative were punished. A similar setup may be forming now, which calls for flexibility. Create your live VT Markets account and start trading now.FXStreet data shows gold prices in Saudi Arabia declined, with rates down from the previous session.
Gold prices in Saudi Arabia fell on Friday, according to FXStreet data. Gold traded at SAR 601.91 per gram, down from SAR 603.25 on Thursday.
Gold also fell per tola to SAR 7,020.53, from SAR 7,036.23 the day before. Other listed prices were SAR 6,019.11 for 10 grams and SAR 18,721.43 per troy ounce.


