Tensions rise between Israel and Iran as China’s property sector struggles despite growth in retail sales
Week Ahead: The Quiet Rise of Liquidity

At first glance, soaring stock markets would suggest robust economic fundamentals. Yet in 2025, this perception doesn’t hold. The primary driver behind current market performance isn’t productivity or profitability. It’s policy. And that should prompt some reflection among traders and investors.
Sentiment appears euphoric. Bitcoin has rallied sharply, and gold is reinforcing its reputation as a safe-haven asset. But when one considers the broader macro landscape, it feels suspiciously optimistic. This isn’t a rally born of corporate earnings or broad-based confidence.
Liquidity At The Core
Since 2020, the US money supply has expanded dramatically. M2, which includes cash, current and savings accounts, and money market funds, has reached unprecedented levels. This didn’t unfold organically.
The Federal Reserve injected trillions into the system via aggressive quantitative easing and ultra-low interest rates in response to the COVID-19 crisis. While this stabilised markets in the short term, it also unleashed an era of abundant, low-cost capital.
In such an environment, cash doesn’t sit idle. With interest rates near zero, investors pivot away from deposits and bonds, channelling funds into equities, property, gold, and increasingly, cryptocurrencies. This capital inflow into a finite pool of assets naturally drives prices higher.
A Familiar Playbook
This pattern isn’t unfamiliar. Following the 2008 financial crisis, central banks embarked on a similar path, fuelling one of the longest bull markets in history. What we’re witnessing now is a magnified version. The scale and pace of post-2020 monetary expansion dwarfs anything previously seen, boosting blue-chip stocks and speculative and defensive assets.
Crucially, much of this new liquidity bypasses consumer spending, funnelling straight into financial markets. That’s why we’re seeing record-breaking asset prices while other economic indicators falter. Corporate earnings remain underwhelming, and labour market data sends mixed signals. Yet markets continue climbing, driven by liquidity rather than fundamentals.
The Fed hasn’t relied solely on printing money. Measures such as adjustments to the Supplementary Leverage Ratio have enabled banks to lend more and hold additional government debt. While these tools support markets during periods of instability, they also highlight the extent to which central banks are willing to intervene.
The Risk Of Dependency
Such interventions are not without consequences. If a vulnerable sector, say, commercial property or a regional banking group, begins to unravel, the likely response will be even more stimulus.
History provides a cautionary tale. In the 1970s, prolonged monetary easing and fiscal deficits triggered runaway inflation. Gold soared from $35 to $850 an ounce by 1980. To rein it in, the Fed hiked interest rates above 15%, plunging the economy into a harsh recession. That era stands as a stark reminder of the limitations of endless liquidity.
Navigating The Terrain
For those still holding equities, a more selective approach is warranted. Sectors with strong pricing power often weather inflationary pressures better. Energy, industrials, and defence may prove more resilient than technology or high-growth names. Defensive sectors such as healthcare and consumer staples are also worth watching as volatility picks up.
Holding cash, particularly in US dollars, is no longer the safe option it once was. Despite its reserve currency status, the dollar is facing long-term structural headwinds. Large fiscal deficits, declining demand for US debt, and efforts by other nations to diversify their reserves are eroding its appeal.
Seeking Shelter
Overexposure to cash during aggressive monetary expansion risks silent, gradual capital erosion. For those aiming to preserve long-term value, alternative stores of wealth deserve consideration.
Precious metals such as gold and silver historically retain their value during currency debasement. Inflation-linked bonds (TIPS) provide protection by adjusting returns in line with inflation. Commodities, especially in agriculture and energy, often appreciate when the dollar weakens. Currencies like the Swiss franc, Singapore dollar, or Norwegian krone also offer diversification benefits.
For those more tolerant of volatility, digital assets remain a growing component of the hedging strategy. Bitcoin, despite its fluctuations, continues to attract both institutional and long-term investors.
At the heart of this momentum is liquidity. It’s lifting asset prices even as economic signals remain murky. But this is not a rally grounded in strength. It is one levitating on the back of cheap capital. When the tide turns, the descent could be swift.
Market participants would be wise to monitor the conditions underpinning this surge. When those conditions shift, having a well-thought-out strategy will matter more than ever.
Market Movements This Week
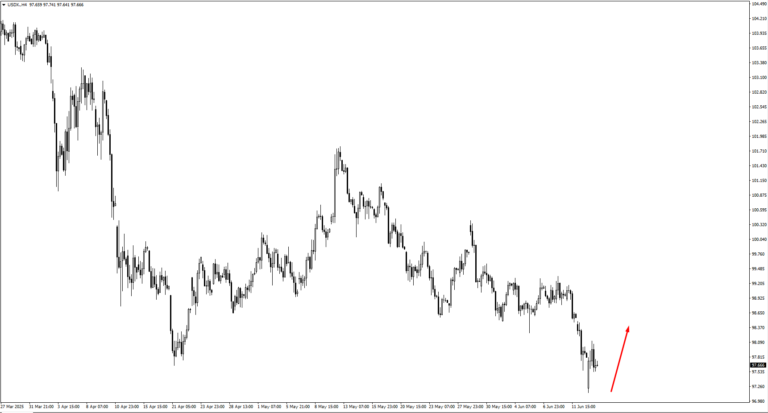
US Dollar Index (USDX) is testing resistance at the 97.90 mark after climbing from 97.139. This zone has previously halted advances, and a break above it could see the index targeting 98.30. On the downside, 96.40 remains a key support for bullish confirmation if momentum fades. With the Fed’s next move pending, expect reactive trading over directional clarity.
EUR/USD hit resistance at 1.1485 and has started to retreat. If buyers fail to reclaim this level, the pair may drift towards support at 1.1420. Alternatively, a bullish rebound would shift focus to 1.1675 and 1.1730 as potential resistance zones. This week’s Eurozone inflation data will be key to determining the next direction.
GBPUSD continues to show strength after taking out the 1.35221 low, but so far has not triggered any major selling pressure. The lack of bearish momentum suggests further upside is possible, with the next key resistance at 1.3670. Whether the pair pushes higher or stalls will likely depend on Wednesday’s CPI report. Any surprise uptick in inflation could change the tone quickly, so we’re staying flexible.
USDJPY dropped from the 145.75 area but found support again near 142.785, a level that has held in previous weeks. The bounce from there suggests bulls may have regained some control. As price moves higher, we’re now watching 145.15, 145.75, and 146.55 for possible bearish reactions. If the BOJ hints at any shift in policy tone when it holds rates at 0.5%, we could see stronger moves either way.
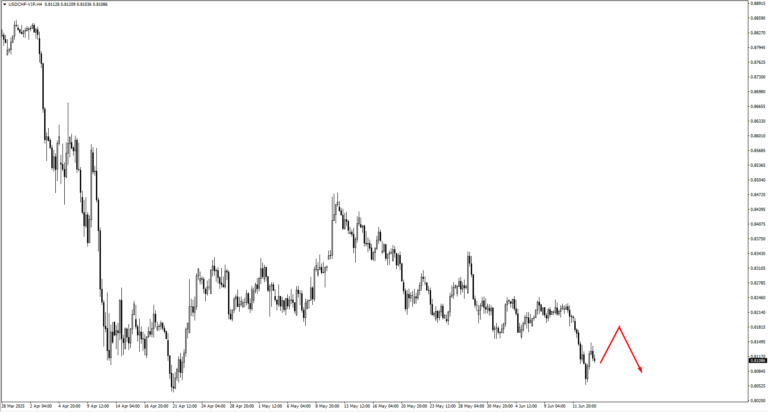
USDCHF remains under pressure and may be setting up for a new leg lower. If price consolidates beneath 0.8195, that area becomes a potential short zone. Should the 0.80388 low be taken out, we’ll be looking for bullish confirmation next, particularly if the SNB does surprise markets by cutting rates from 0.25% to 0.00% as forecasted. Either way, a shift in Swiss franc volatility may follow.
AUDUSD is still caught in consolidation, but the pressure is building. If price pushes up to 0.6575, it could attract sellers looking for a downside continuation, especially with employment data sharply downgraded from 89.0K to 19.9K. We’re also watching how price behaves near the green trend line marked on our chart—this is where we expect any real directional move to show its hand.
NZDUSD continues to respect its support along the green trend line. However, price remains soft, and a liquidity sweep below that line isn’t off the table. If that happens, we’ll be looking closely at the reaction—either to confirm a deeper move or to catch a reversal setup. With limited data out of New Zealand this week, the pair may simply track AUD sentiment.
USDCAD retested the 1.3590 low and even pushed briefly below it, hinting at bearish intent. If this move holds, the next support at 1.3500 becomes the key zone for price action. Stronger oil prices could lend the Canadian dollar a tailwind here, particularly if geopolitical risk continues to support crude. Still, we’re waiting on a clear confirmation before calling for further downside.
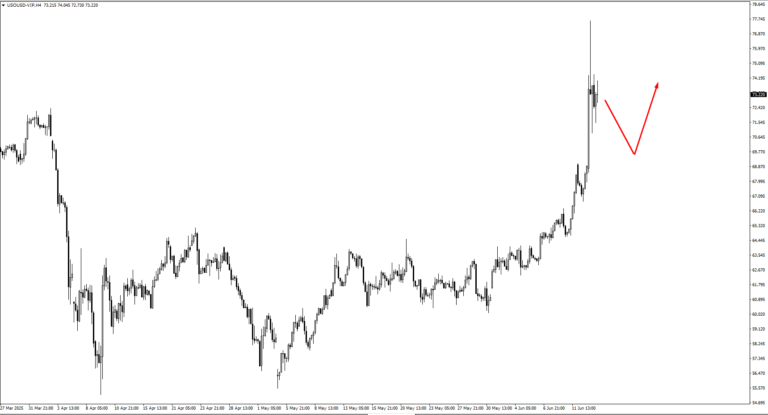
USOil remains supported, with prices holding firm as geopolitical tensions between Israel and Iran remain unresolved. Traders are reluctant to sell into this kind of uncertainty, and if consolidation holds above 68.40, we could see another push higher. However, without fresh headlines, the rally may struggle to gain traction. A pullback to that 68.40 area could attract buyers again.
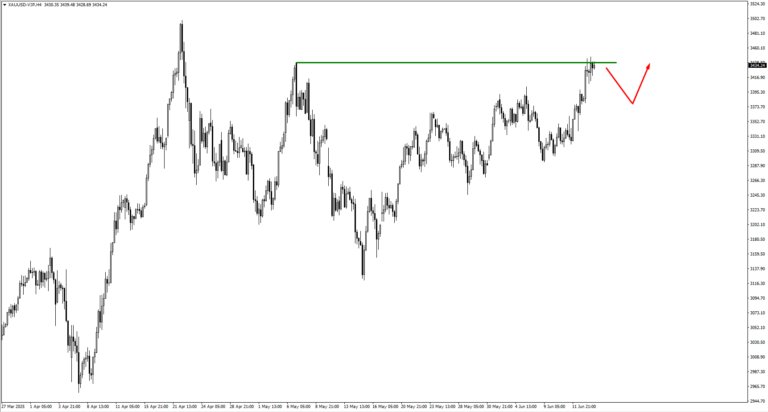
Gold has breached the 3439 level, but confirmation is still lacking. Should prices falter, we’ll be eyeing the 3385 and 3355 levels for buyer interest. The upcoming US inflation data and Fed tone could determine whether gold breaks out or stalls.
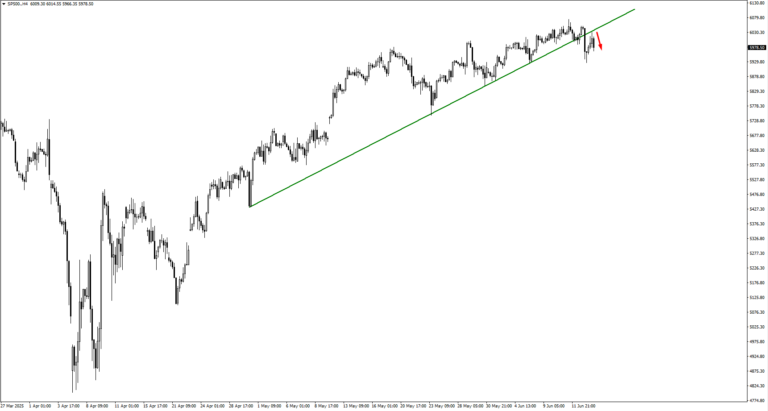
SP500 has pulled back slightly but remains well above the monitored 6000 area. So far, sellers have not shown strong conviction. If price consolidates here, it may just be a pause before another move higher. However, any weakness in earnings forecasts or a hawkish tone from the Fed could trigger a sharper correction. We’re watching for clearer signs of either.
Bitcoin is consolidating after its massive run, with potential bearish setups forming around the 106,950 area. If sellers reclaim control, a drop through the 102,666 low could lead to a deeper flush. On the other hand, continued consolidation may simply be the market catching its breath. Either way, volatility is likely to return soon, so we’re keeping tight watch on the edges of this range.
Natural Gas bounced off the 3.25 area and is now heading toward the 3.52 zone. Bulls will want to see continued follow-through to confirm the move. This week could bring more upside, but traders will likely wait to see if price can hold above the current levels before committing to new longs.
Key Events This Week
On Tuesday, the spotlight turns to Japan, where the Bank of Japan is set to announce its latest policy rate decision. Markets expect it to remain at 0.5 percent, unchanged from previous meetings. However, the real focus will be on any change in language. If Governor Ueda signals the possibility of a rate hike or hints at scaling back stimulus, the yen could strengthen sharply. This would pressure USDJPY, which is already bouncing within a sensitive range. Japanese policymakers have so far resisted tightening, but inflationary pressures and currency weakness may force their hand. Traders should brace for a reactive move, even if the headline rate holds steady.
Come Wednesday, the UK takes centre stage with its Consumer Price Index (CPI) report. Forecasts suggest a year-on-year reading of 3.3 percent, slightly lower than the previous 3.5 percent. While this indicates a modest cooling in inflation, the difference is slim. The reaction in GBPUSD will likely depend on whether price has already made a new swing high before the release. If so, the data could trigger a retracement, especially if inflation undershoots expectations. However, a surprise spike in the numbers could revive rate hike speculation and give sterling a fresh boost. Either way, this CPI print has the potential to jolt the market out of its holding pattern.
Thursday brings a flurry of decisions from four major economies. First up is the U.S. Federal Reserve, expected to keep its Federal Funds Rate at 4.5 percent. After weeks of mixed data and growing calls for rate cuts later this year, traders will dissect the statement for any dovish or hawkish shifts. The Fed’s tone here matters more than the number. If policymakers express concern about sticky inflation or a tight labour market, the dollar could catch a bid. But if the tone leans toward patience or future easing, risk assets could rally further.
At the same time, Australia’s Employment Change data drops, with a sharp drop in hiring projected: 19.9K jobs expected versus 89.0K previously. That’s a steep slowdown, and if the report confirms weakness, AUD could come under pressure—especially if paired with dovish signals from the Reserve Bank of Australia. Price action in AUDUSD has already been drifting, and this data could be the spark for a more decisive move.
Switzerland also enters the fold Thursday with the Swiss National Bank’s rate decision, where markets anticipate a cut from 0.25 percent to 0.00 percent. If that happens, the franc could weaken, particularly against the dollar and euro. But as with most central bank meetings this year, the reaction may depend more on the outlook than the rate itself. Traders will look for clues about how long the SNB expects to remain accommodative, especially amid global divergence in monetary policy.
Rounding out Thursday’s lineup is the Bank of England, expected to leave its Official Bank Rate at 4.25 percent. The decision itself is unlikely to surprise, but the statement could still move markets. If policymakers emphasise persistent inflation risks, GBP could hold its gains or even strengthen. But if they acknowledge progress in disinflation or hint at a more neutral stance, sterling may lose steam.
This week won’t deliver blockbuster surprises on paper, but the tone from central banks and the nuance in CPI figures could still swing markets. We’re preparing for pockets of volatility, especially around FX pairs and commodities tied to rate-sensitive currencies. As always, the message between the lines may matter more than the headline print.
China restricts rare earth metal exports vital for US military amid geopolitical tensions and trade disputes
GBP/USD shows resilience near 1.3570, but analysis suggests the bullish trend may weaken
Primary Support Levels
On the downside, key support is found at the nine-day EMA at 1.3552, followed by the 50-day EMA at 1.3346. If these levels are broken, GBP/USD might test the ten-week low of 1.3063 set on April 14. In other currency movements, the British Pound showed mixed performance against major currencies, being strongest against the Canadian Dollar. A heat map shows that GBP gained 0.07% against USD and remained stable against EUR. Caution is advised in the currency markets, and thorough research is recommended before making financial decisions. The recent rise in GBP/USD to the 1.3570 level followed a stronger session in Asia, recovering earlier losses and re-establishing control above short-term averages. This puts the pound in a position to challenge the highs from early 2022, specifically around 1.3632. The Relative Strength Index, consistently above 50, confirms a stronger bullish trend. Price movement has climbed back above the nine-day EMA, a level often used for indicating short-term shifts. While this doesn’t guarantee further gains, it is one of several indicators we use to assess continuation chances. A strong move beyond 1.3632 could bring the upper line of the rising channel into view, near 1.4250. While calling that the next target may be premature, its potential adds structure to a rally that has been gaining consistency since early April.Support and Resistance Dynamics
Support levels are closely spaced. The first key level is the nine-day EMA around 1.3552, which may hold if current momentum continues. A drop below this could trigger further tests toward the 50-day EMA at 1.3346. Although not far off, this would represent a clearer trend reversal, especially if accompanied by lower liquidity or negative macro news. Should selling increase below that range, the previous low at 1.3063 could come back into play — not the most likely scenario now, but still a consideration. In the broader currency market, the pound had a mixed performance against major pairs. It performed best against the Canadian dollar but remained stable against the euro. This disparity reflects uneven economic data quality across countries and possible shifts in central bank expectations. We’ve seen this before when one market segment reacts strongly, only to later adjust. For those trading derivatives tied to the pound, these reference levels are crucial for short-term strategies. Tests towards the 1.3630-1.3650 range may attract momentum traders, particularly when spot levels and implied volatility diverge in favor of the underlying trend. Nonetheless, respecting the support levels around the nine- and 50-day EMAs can serve as a hedge against this outlook. We’ll be monitoring shifts in positioning data or notable volume changes at key price areas. These can point to activity by larger market players. Even slight changes in sentiment can be observed through pricing movements around these mid-level supports and whether pullbacks create buying interest or hesitation. Macro factors are still important — interest rate expectations will continue to influence market sentiments. However, in the short term, price action is providing clearer signals, especially when viewed against recent consolidations and strength comparisons. Upcoming data will provide more insights, but for now, price leads the way. Create your live VT Markets account and start trading now.China NBS spokesperson emphasizes need for stronger economic recovery foundation amid uncertainties
Challenges in the Labour Market
Even though prices are low overall, this is affecting businesses, jobs, and incomes. Some sectors are struggling to find workers, and certain groups are facing job pressures. The tricky external environment is impacting China’s labour market. Uncertain trade policies have made it tough for China to keep steady economic growth since the second quarter. In May 2025, China’s industrial output grew by 5.8% compared to last year, which is slightly below the expected 5.9% and down from 6.1% previously. However, retail sales in May saw the fastest growth since December 2023. This summary shows a mixed but revealing view of China’s current economy. On one side, new data indicates stronger retail sales, likely boosted by online discount campaigns, showing there’s still consumer interest. But, the increase in retail sales isn’t seen equally in other key areas. Industrial production rose by 5.8% year-on-year, falling short of predictions and signaling a slight slowdown. Although this difference seems small, it suggests the economy is not moving forward uniformly across sectors. Divergence between manufacturing and services can lead to volatility in capital flows.External and Internal Pressures
Consumer demand seems stable, but low prices and weak inflation hint at underlying issues: producers are struggling. If companies are lowering prices just to sell their goods or meet weak demand, this can hurt wages, hiring, and long-term profits. Recruitment challenges in key sectors reflect a broader slowdown in job growth. We cannot overlook the external uncertainties—much of this stems from unclear global trade guidelines and geopolitical tensions. Changes in demand from other countries and shifts in global sourcing have complicated growth planning. This mix of persistent and temporary challenges has required ongoing action from policymakers. Officials have already shown they are ready to adjust fiscal support and monetary policies. This proactive approach is common in times of uneven growth. However, just because these tools are available doesn’t mean they will work effectively—especially when confidence is fragile and financial markets react more to news than fundamentals. Looking ahead, we should prepare for more fluctuations in manufacturing output, shipping, and domestic demand metrics. Any plans depending heavily on industrial growth to boost the short-term economy need to consider new disruptions—especially in sectors sensitive to commodity prices or slim profit margins. By keeping an eye on monetary policies and public spending shifts, we can identify where the next round of support might emerge. Typically, there’s a delay between policy changes and their effects on the economy—this lag creates vulnerable moments when volatility can increase. Limited liquidity—often seen in Asian markets during summer—can make things worse. When momentum seems broad but data tells a different story, it may be safer to limit short-term risks. Focusing on steady but selective demand—especially where consumer reliance is on imports rather than local sources—may offer more reliable guidance. While opportunities will not vanish, they might be less noticeable due to differences in data timing and policy responses. In the end, retail figures may capture attention, but issues in employment and capital formation will have a greater impact on medium-term stability. Investors should pay closer attention to labour market indicators than to broad headline indices. As Li’s team continues to enhance stimulus efforts, it’s not just the scale of policy that matters, but also how quickly it’s implemented that will shape reactions. Short-term optimism should not overshadow the areas of deceleration that have already emerged. Economic indicators can be like streams under ice: calm on the surface, but deeper movements can reveal the true direction. Create your live VT Markets account and start trading now.Despite a small increase in the USD, the USD/TWD pair remains below 29.50 due to a lack of buyers.
Fed Meeting Outlook
Investors are cautious ahead of the Federal Open Market Committee’s two-day meeting. Any rate cuts by the Fed in September could lead to further losses for the USD/TWD pair. The Federal Reserve directs US monetary policy, adjusting interest rates to respond to the economy. It holds eight meetings a year to make these decisions. The Fed uses quantitative easing to boost credit during downturns and quantitative tightening to restrict it, which generally strengthens the USD. This information carries risks and uncertainties and is for informational use only. Investors should do thorough research before making decisions. The authors are not responsible for any investment results stemming from this information. Despite trading below the 29.50 mark, traders are observing downward movements, even with a slight increase in Dollar demand. Although this seems contradictory, the broader market sentiment around trade relations and tech momentum provides clarity.Trade Sentiment and Tech Sector Influence
Optimism about easing trade tensions between major economies supports regional currencies, particularly the Taiwan Dollar. Recent gains in prominent US tech stocks also affect currency flow, leading to shifts that don’t reflect short-term Dollar strength. Many expected a stronger Dollar, but underlying market forces are changing quickly. Looking ahead, traders are adjusting to the upcoming Fed discussions. These meeting often cause quick changes in expectations, especially when new policies differ from previous views. Current positioning suggests that traders expect possible rate changes as early as September, depending on upcoming labor data and inflation. While current rates may hold, soft signals from the Fed could lean the bias against the Dollar, especially for this pair. The Federal Reserve employs several key policy tools, the most obvious being the benchmark interest rate. However, its balance sheet actions are also important. When the Fed expands its balance sheet to support liquidity, it often loosens financial conditions, which usually eases upward pressure on the Dollar. Reducing the balance sheet generally tightens capital in the system, strengthening the Dollar. Right now, it looks like markets are anticipating a more dovish stance from the Fed, driven by external positivity rather than internal weakness. If the upcoming statements reflect a softer tone, this bias could deepen, especially if inflation numbers stay stable. This would indicate a gradual return to normal policy. It’s crucial to monitor not just formal policy decisions but also the tone of recent Fed speeches. Any indications of patience or a focus on data could weigh more heavily than forecasts imply. Therefore, adjustments should consider changes in timing for future rate decisions. Additionally, volatility in the derivatives market may start to reveal a more asymmetric risk profile if these trends continue influencing rate expectations. These evolving factors are already being priced in, meaning current levels may not fully capture anticipated outcomes. Staying flexible with positions, especially in shorter-term instruments, could be more beneficial than relying solely on Dollar sentiment. Create your live VT Markets account and start trading now.Dividend Adjustment Notice – Jun 16 ,2025
Dear Client,
Please note that the dividends of the following products will be adjusted accordingly. Index dividends will be executed separately through a balance statement directly to your trading account, and the comment will be in the following format “Div & Product Name & Net Volume”.
Please refer to the table below for more details:
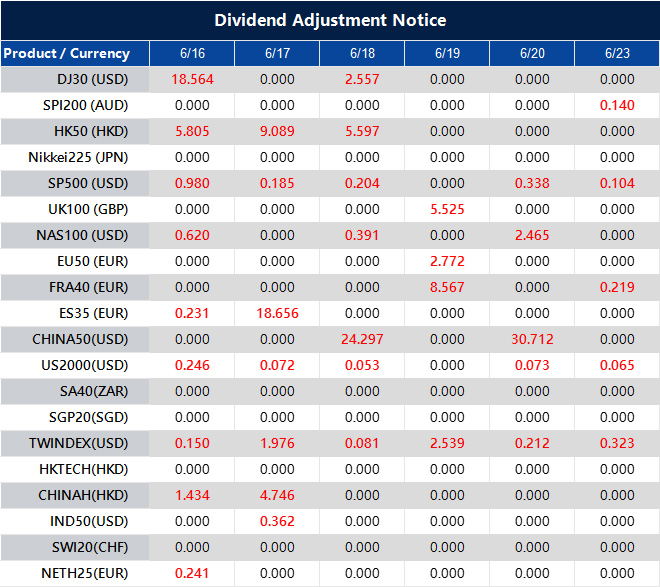
The above data is for reference only, please refer to the MT4/MT5 software for specific data.
If you’d like more information, please don’t hesitate to contact [email protected].


