The NZD/USD pair hits a six-and-a-half-month high near 0.6030, suggesting a potential rally towards 0.6100.
Week Ahead: America At A Fiscal Crossroads

For decades, the United States borrowed freely, supported by global confidence in its Treasury bonds and the strength of the US dollar. However, that confidence is beginning to show cracks. With national debt exceeding $36 trillion and interest payments rising sharply, borrowing costs have moved from the sidelines to centre stage, prompting markets to take notice.
Currently, the US government pays an average interest rate of 3.289% across its debt portfolio, comprising short-term bills, medium-term notes, and long-dated bonds. While that figure may not seem alarming in isolation, it takes on new significance when viewed alongside the broader picture: total debt has reached $36.18 trillion, compared with a GDP of approximately $29.18 trillion. A 1% increase in interest rates now adds over $360 billion annually in servicing costs.
Interest payments have become far more than a footnote in the federal budget—they’re beginning to rival core programmes such as defence and Medicare. In fiscal year 2024, interest expenditure accounted for 3.0% of GDP, closing in on the 3.2% high recorded in 1991. The Congressional Budget Office (CBO) forecasts this figure will rise to 4.1% by 2035 under existing legislation. Should average rates climb to 5.8% by 2054, the debt-to-GDP ratio could balloon to 217%—a full 50 percentage points above the current baseline estimate.
These projections aren’t just hypothetical. If the 10-year Treasury yield remains above 6%, annual interest costs could swell to $2.1 trillion, or roughly 7% of GDP. Many economists view a 5% interest cost threshold as a serious warning sign, where debt servicing begins to crowd out essential government expenditure and borrowing becomes necessary simply to cover interest—often a harbinger of a debt spiral.
Lessons from History
History provides useful context. In the 1980s, the Federal Reserve raised interest rates aggressively to combat inflation, and 10-year yields surged past 10%. However, debt levels were relatively modest, around 30% of GDP, so the economy absorbed the impact. By the 1990s, as debt rose to 50% of GDP, growing interest costs forced politicians to pursue budget reforms, resulting in a brief return to fiscal discipline.
From 2010 through 2021, historically low interest rates created a false sense of security. The US could accumulate more debt without facing immediate consequences. As the Fed tightens policy, the real cost of borrowing is coming into focus, and the financial pressure is mounting.
Domestically, the US retains some flexibility. Roughly 70% of its debt is held by domestic investors, including the Federal Reserve, which adds a degree of stability. Still, over-reliance on internal buyers can crowd out private investment. Should the Fed resume large-scale Treasury purchases, it risks re-stoking inflation and undermining the dollar. It is an effective short-term solution during the pandemic, but unsustainable in the long run.
What if yields continue rising? If the 10-year Treasury breaches 5.5%, fiscal pressures become more urgent. A future Trump-led administration, possibly influenced by figures like Scott Bessent, might consider measures such as spending freezes, tax changes, or even debt restructuring. Extending bond maturities to lock in rates is one option, so is generating revenue via tariffs or encouraging capital repatriation. However, these approaches carry significant risks and rely heavily on maintaining market confidence.
Bessent contends that strong GDP growth could ease fiscal burdens by raising tax revenues. While plausible, this argument falters if interest rates remain elevated or if inflation continues to bite. Markets will demand meaningful reform, not just optimistic forecasts.
What Lies Ahead?
All of this has direct implications for financial markets. Higher yields make equities less attractive by increasing discount rates to future earnings. Should interest rises above 5% of GDP, risk assets may face deeper corrections. Equity valuations, especially in growth sectors, will likely need to adjust to a more expensive capital environment.
The US dollar faces a delicate balancing act. Elevated yields may attract short-term inflows, but if debt sustainability is questionable, capital could quickly exit. A weakening dollar would lift import prices and reintroduce inflationary pressures, precisely the outcome the Federal Reserve is keen to avoid.
The takeaway is clear. The US can still service its debt, but the margin for doing so without consequence is narrowing. Fiscal policy is no longer a distant concern. It’s now a key market driver. With crucial inflation and GDP figures due this week, investors are poised to test that premise.
Market Movements This Week
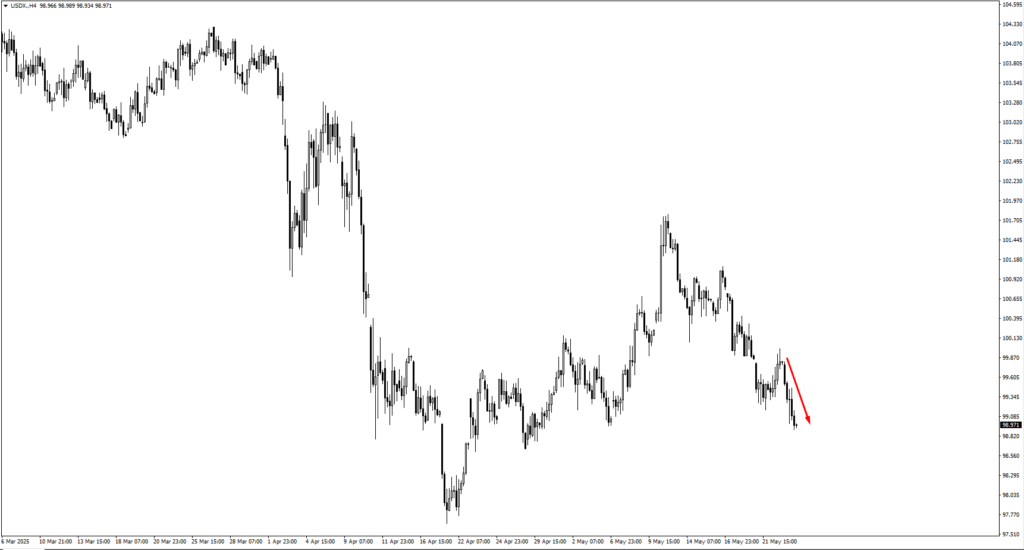
The US dollar index (USDX) continued to retrace from the 100.15 region, a monitored supply zone that has acted as resistance before. Prices pushed lower toward the 98.30 support level. With the dollar caught between yield appeal and structural doubts, a test of 98.30 may prove decisive. If support holds, the dollar could see a technical bounce. If broken, the path toward deeper correction would open, especially if bond yields soften or inflation surprises to the downside.
EUR/USD rallied cleanly from 1.1240, a key support area in the previous sessions. Traders will now be watching the 1.1470 level. Momentum remains cautiously bullish in the pair, with structural strength supported by weaker dollar expectations. However, further upside may require confirmation from Thursday’s US GDP and Friday’s Core PCE release. A softer print could reinforce the breakout structure, while a surprise to the upside may introduce volatility.
GBP/USD extended its bullish move this week. As the price climbs, attention turns to potential resistance zones at 1.3595 and 1.3670. Given the pair’s sensitivity to interest rate guidance, Friday’s speech by BOE Governor Bailey could trigger a technical reaction. Traders are advised to watch for signs of bearish reversal near these levels, especially if the dollar finds temporary support or if UK inflation commentary shifts tone.
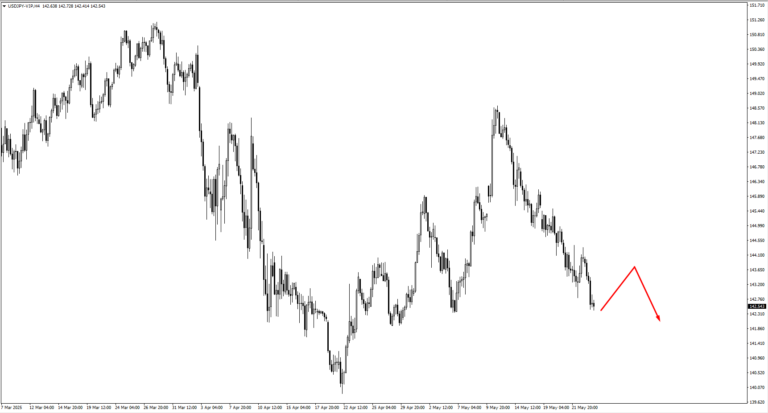
USD/JPY remains range-bound, with price approaching resistance at 143.30 and 143.80. These levels will likely serve as inflection points. A gradual move higher, followed by bearish reversal patterns, could indicate short opportunities, though a sharp, yield-backed rally would suggest caution for sellers.
USD/CHF edged lower but stopped just short of key support at 0.8330. On the rebound, resistance at 0.8255 and 0.8280 may attract bearish attention. The strength of the move into these levels will determine whether selling setups have sufficient edge.
AUD/USD is now trading near monthly highs. The pair has been supported by rising commodity demand and a broadly softer USD. If the market consolidates at these highs, the 0.6460 zone becomes important for fresh bullish price action setups. Bulls will want to see a controlled pullback into that region, followed by confirmation before reengaging.
NZD/USD has broken out of its range. If it pauses to consolidate, 0.5950 will be a level to watch for bullish price action. The Reserve Bank of New Zealand’s upcoming cash rate decision could inject volatility midweek. Traders should be cautious ahead of that release, especially if the pair trades aggressively into resistance without consolidation.
USD/CAD slid just beneath the 1.3920 resistance zone. If the pair retraces higher in the coming sessions, 1.3810 becomes a likely area for bearish setups. The loonie remains sensitive to oil price dynamics, so crude movement may further influence the direction of this pair.
Commodities saw notable movement, with crude oil (USOil) rising sharply from support near 60.20. A break above the 64.534 level could confirm a new bullish leg. However, signs of stalling beneath this resistance may suggest the trend is losing steam.
Gold climbed higher this week, ignoring the previously monitored 3220 level on its way up. Now, traders eye the 3400 resistance zone. If price reaches this level and begins to retrace, the 3305 area could provide a new staging ground for bulls to re-enter. Any retest of that level would need to show clear bullish price action, especially in response to inflation data on Friday.
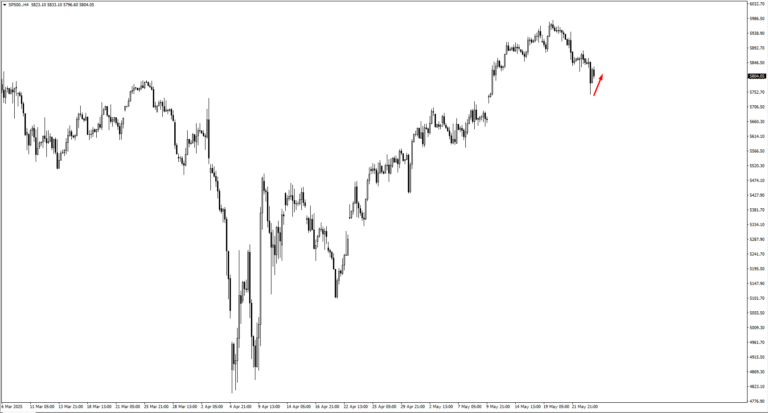
The S&P 500 continues to recover, pushing up from the 5740 zone. If price pulls back again, 5690 would be the key level to watch for fresh bullish setups. A clean move higher could bring 6100 into view as the next target. However, rising Treasury yields and policy noise could make gains harder to sustain. Traders should stay adaptive.
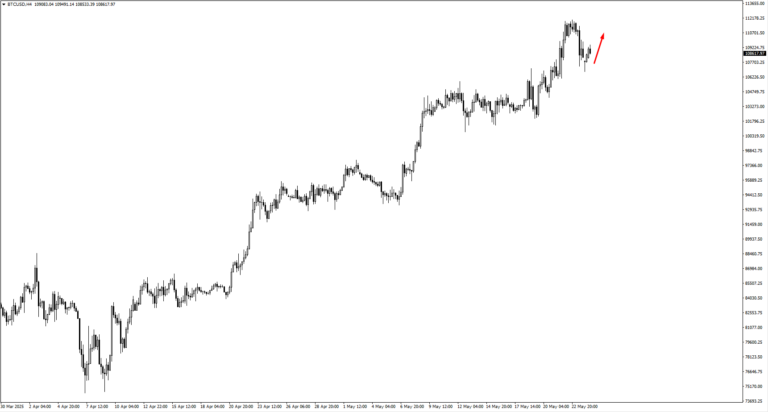
Bitcoin remains elevated, with resistance zones at 113,500 and 123,000 under watch. While institutional demand and risk-on sentiment provide support, price action remains overheated. Patience and confirmation will be essential for those chasing further highs.
Key Events This Week
Wednesday, May 28, brings the first real event of the week. The Reserve Bank of New Zealand is expected to cut its official cash rate from 3.50% to 3.25%. If NZD/USD hasn’t already broken the 0.60238 high earlier in the week, the release could spark a retracement. If the breakout is confirmed, a dovish tone from the RBNZ could accelerate the next leg lower. Either way, traders are watching closely for a clean reaction before stepping in.
On Thursday, May 29, attention turns to the US Preliminary GDP data. Forecasts expect -0.3%, the same as last quarter. It won’t surprise the market, but internal details, especially consumer spending and business investment, could set the tone for Friday’s inflation print. Traders are likely to stay cautious, letting prices digest the number before making big directional bets.
Friday, May 30, is the big one. Bank of England Governor Andrew Bailey speaks in the early session. With GBP/USD testing resistance near 1.3595–1.3670, his tone could make or break a breakout. A hawkish lean might push the pound higher, while a dovish or measured tone may send it back down into range.
Later, the US Core PCE Price Index is released. Forecasted at 0.10%, up from 0.00%, the reading could rekindle concern about sticky inflation. If the number beats expectations, Treasury yields could rise again—and with them, the dollar. Equities, especially growth names, may struggle to hold gains into the weekend.
Finally, China’s Manufacturing PMI drops into the late session, with a forecast of 49.5, just above the previous 49.0. Still below the 50.0 expansion line, the data may weigh on sentiment if it underperforms. Traders watching AUD and NZD will be vigilant for signs of a slowdown in Chinese demand.
It’s a week that starts slow and ends with pressure. For traders, patience will be key. The best opportunities may come late, after the dust settles from a data-heavy Friday.
Create your live VT Markets account and start trading now.
Easing trade tensions and strong Canadian data help keep the Euro stable against the Canadian Dollar
EUR/CAD is currently stabilizing around 1.5607. This is due to a delay in US tariffs on EU imports and strong Canadian retail sales data. The Euro has gained strength as trade tensions eased, with the US postponing tariffs on imports from Europe.
Recently, EUR/CAD fell below the 10-day and 20-day Simple Moving Averages but remains steady. Upcoming speeches from the presidents of the ECB and Deutsche Bundesbank could influence the currency pair, depending on their views about the economy.
Shift in Mood
Fears about a proposed 50% tariff on EU goods initially pressured the Euro. However, improved communication between US and EU leaders has changed the mood, giving the Euro a more positive outlook in early trading. In March, Canada’s retail sales increased by 5.6% compared to last year, outperforming the forecast of 3.8%. Monthly growth slowed to 0.5%, yet it was better than the anticipated 0.1% decline, providing support for the Canadian dollar. The EUR/CAD pair is now facing mixed trends due to these developments. Future movements will likely depend on upcoming inflation data and statements from central banks, which could further shape market direction. As the EUR/CAD pair remains near the 1.5600 level, recent events indicate a temporary decrease in volatility. However, it may be too early to view this balance as a lasting conclusion. The easing of trade tensions—thanks to the US delaying tariffs—has offered the Euro some stability, at least for now. That said, this calm is conditional. The Euro’s current strength largely relies on diplomatic changes rather than shifts in core economic indicators. On the technical side, EUR/CAD recently fell below its 10-day and 20-day simple moving averages, which usually suggests weaker short-term upward momentum. While this doesn’t signify a complete trend reversal, it raises concerns about the strength of the pair’s current trading range. It serves as a reminder that price movements should be interpreted in the context of broader developments, rather than isolated technical signs.Canadian Data Reaction
The response to Canadian data is particularly notable. Monthly retail sales exceeded expectations, although this increase was boosted by a one-time event unlikely to happen again soon. While these numbers surpassed forecasts, the slight slowdown—monthly growth was lower than in previous months—means we should be cautious about overreacting to headline figures. Nonetheless, this result provides notable support for the Canadian dollar in the short term. With Lagarde and Nagel set to speak soon, the direction of EUR/CAD may hinge on their tone. Any suggestions of policy changes or worries about slowing industrial output could create more volatility for the pair. As we await their comments, we’ll look for insights related to price growth and labor market pressures. If their messages appear cautious due to structural slowdown, it may weaken the Euro’s current position. Another important factor is the upcoming inflation data from both economies. These figures could influence expectations for future rate changes, which play a crucial role in this currency pair. If Canadian inflation surprises to the upside, it may strengthen the loonie, especially if coupled with dovish central bank language from the eurozone. When considering risk positioning, it’s vital to examine technical and macroeconomic factors together. Though markets seem calm now, the balance is fragile, and even a slight shift in tone or a disappointing data point could lead to sharp price adjustments. We’ll continue to monitor the spreads between European and Canadian yields, as they may reveal early signals about market sentiment ahead of new data releases. Create your live VT Markets account and start trading now.The blue box shows a support zone for TMUS, where buyers expect to re-enter the stock.
T-Mobile US Inc. is experiencing a pullback while still trending upwards in the long run. This dip is creating a 7-swing pattern that is approaching an important price zone, likely attracting buyers.
T-Mobile is a leading U.S. wireless carrier, having become the third-largest telecommunications provider after merging with Sprint in 2020. Its stock is listed on the NASDAQ-100 and S&P 500. Recently, it reached a record high of $276.46, with potential to rise further to $300-$400.
Since January 2022, the stock has shown strong growth. The latest wave started at a low in January 2022 and surged to new heights, despite some market corrections.
This pullback is seen as part of a double zigzag pattern, expecting a bounce back around the $229.98–$206.41 range. This zone is critical for traders looking to enter for the next upward move.
The AUD/USD currency pair hit new yearly highs before reversing, while the EUR/USD moved past the 1.1400 level early this week. Meanwhile, the U.S. dollar weakened as the U.S. extended the deadline for EU trade negotiations.
Gold is holding around $3,350 per troy ounce amid quiet trading, reflecting better market sentiment. Ripple (XRP) remains stable at $2.33, and Bitcoin is recovering above $109,000 as optimism grows.
T-Mobile’s price shows a clear and measured retracement fitting into a broader upward trend. The current correction phase seems to follow a structured double zigzag pattern, suggesting that the price action is more likely to continue rising than to reverse, especially given its recent strong momentum.
Since early 2022, T-Mobile’s steady rise has resulted from its strong performance after the merger, solid market position, and investor confidence in the telecommunications sector. The temporary drop should not raise concerns as long as it stays within the expected support range of $229.98 to $206.41. Typically, price zones like these align with Fibonacci retracement levels and prior support areas. When these lines up, sharp reversals or rebounds often happen.
In these precise areas, our analytical group sees a chance for medium-term price growth, so monitoring the reactions is essential. Any reversal patterns in this price range should be closely observed. We expect a new surge once the correction is finished, which could push prices towards the upper end of the $300–$400 range in the months ahead. This may indicate the final wave of the current trend, depending on how the impulse structure unfolds.
Shifting to the currency markets, movements in AUD/USD and EUR/USD indicate traders adjusting their risk based on a weaker dollar. The AUD’s reversal after hitting new highs suggests some exhaustion, especially given lower market participation. Conversely, the EUR/USD moving above the 1.1400 resistance level shows growing confidence in the eurozone’s resilience, amid ongoing trade talks. The extended deadline between the U.S. and EU gives traders a short-term opportunity with less macro pressure, allowing a focus on technical setups.
The dollar’s decline is also giving a boost to commodities and cryptocurrencies. Gold’s consolidation near $3,350 per troy ounce shows a lack of short-term triggers rather than a structural issue. We see reduced volatility in gold as inflation fears and interest rate worries ease. This could either be calm before a rise or suggest funds are temporarily reallocating.
Digital assets are also noteworthy. Ripple’s stability at $2.33 coincides with past congestion areas, and Bitcoin’s climb above $109,000 came with increased trading volume, signaling possible renewed institutional interest or buying pressure due to reclaimed technical levels. Such conditions often lead to short-term price acceleration, especially with improved sentiment and weaker fiat currency.
In the coming weeks, we expect sentiment shifts will play a more significant role in shaping actions across equities and FX pairs than new policies. In this type of market, timing matters more than volume—executing trades around recognized zones or psychological round numbers tends to be more effective than chasing breakouts or news-driven swings.
Microsoft ($MSFT) has risen 27% since April from the entry point marked by the blue box.
Microsoft ($MSFT) has risen 27% since April, starting from the Blue Box area. This point marked the end of a downward trend, indicating a potential short-term price drop.
Right now, Microsoft is in a correction phase, following an Elliott Wave Zig Zag Pattern. This hints that we may see some weakness before another buying opportunity arises. The target price is around 355.33, where we expect a bounce in three waves. This level can help with risk management and profit-taking.
Investors who bought in at the Blue Box area have secured their positions after the price climbed from 338 to the 450 range. Our goal is to move stop losses to breakeven and take partial profits as long as the price stays above 338, which suggests more potential for gains.
We provide specific buy and sell setups, with clear stamps and zones to help guide trading decisions. Our risk disclosures highlight the challenges involved in trading, reminding everyone to be informed and cautious. Trading advice is available to paid subscribers, and strict copyright protections are in place against unauthorized sharing.
Microsoft’s recent 27% rise, which followed accumulation near an exhaustion zone, has yielded significant profits. This strengthens the case for entering high-probability areas that align with pattern completions. The bounce from 338 to around 450 supports our initial bullish outlook. However, we now need to focus on managing risks as short-term weakness appears.
The current pullback shows characteristics of a classic Elliott Wave Zig Zag correction, suggesting that price action may remain low in the near future. The expected three-wave structure usually provides temporary relief in broader trends, indicating a potential retracement to 355.33. This level is where buyers may return, though likely not with the same energy we saw in April.
Since long positions are now risk-free after strong upward movement, it makes sense to consider reducing partial positions or adjusting stop losses to lock in profits while allowing price some room to move. Protecting the 338 area is crucial for maintaining a bullish view going forward. If the price convincingly breaks below this level, the correction may deepen, making flexibility more important than sticking rigidly to prior trading plans.
Short-term traders should watch for fresh setups as prices drop towards our identified zone. We anticipate that the upcoming bounce will create opportunities for tight management—emphasizing quick trades and partial re-engagements rather than aggressive accumulation. In these situations, knowing your exit strategy is just as critical as the entry point.
This corrective move does not signal a total collapse, but it shouldn’t be mistaken for a strong bottom either. Corrections like this often unfold in overlapping waves that slow momentum and invite early re-entries. We will wait for clearer signals from price action near expected retracement levels instead of acting prematurely.
Every move and wave brings its own probabilities. Recent market behavior, particularly how price respects planned zones, highlights the value of pre-arranged trade areas with timing labels. As the market shifts, our focus will be on evaluating each signal against new price movements. We remain observant and adaptable rather than rushing into decisions.
Establishing trading rules ahead of time—and sticking to them when levels are reached—shows the highest discipline. Holding tightly as prices approach invalidation zones has often been unwise. Our attention is on the next key level, allowing market structure to guide our actions. Sensible stop placements and proper position sizing will be vital in the next phases of this correction.
USD/CAD remains stable above 1.3700 as trade tensions ease and trading volumes decrease
The Canadian Dollar has lost some initial gains against the US Dollar. Currently, USD/CAD is trading around 1.3720 after hitting a low of 1.3686. This change comes after US President Donald Trump decided to delay a 50% tariff on EU goods until July 9.
On Friday, the Canadian Dollar reached a seven-month high, boosted by positive Retail Sales data for March, which showed a 0.8% increase that surpassed expectations. This suggests strong consumer spending in Canada, despite mixed signs in the broader economy.
Canadian Inflation and Rate Predictions
While Canada’s headline inflation has decreased, core inflation remains steady. This could lead to cautious projections for the Bank of Canada’s upcoming meeting in June. Although inflation and spending are high, markets are still factoring in a 32% chance of a 25 basis point rate cut. The US Dollar is facing challenges, with the Dollar Index at a four-week low. Still, hopes of reduced trade tensions are providing some support. Trading on Monday is expected to be light because of holidays, and attention will shift to the upcoming Federal Reserve minutes and Canada’s GDP data later this week. This week started with the Canadian Dollar giving back some of its earlier strength. USD/CAD is once again hovering near 1.3720 after briefly dropping to 1.3686. This shift is related to a sudden easing in trade tensions, especially after Trump announced the delay of his proposed 50% tariffs on EU goods to July 9. This development reduces immediate pressure on global currency markets, allowing for more risk-taking in the short term. On Friday, the CAD reached levels not seen in seven months. This surge was driven by unexpected strength in Canada’s retail figures, with March sales rising 0.8%, significantly surpassing forecasts. This indicates that consumer activity remains strong, despite mixed signals from other parts of the economy. Canadian households continue to spend, even with current interest rates. However, inflation rates have eased slightly, mainly due to lower energy prices. Yet, core inflation—excluding volatile items—remains stubbornly high. This puts the Bank of Canada in a delicate position. Investors seem to be aware of this tension, with the market still implying about a one in three chance of a rate cut in June. While many don’t view this outcome as likely, it certainly isn’t off the table.Market Reactions and Expectations
The US Dollar is now under increased pressure. Its broader index against major currencies has fallen to a four-week low. Expectations for further tightening by the Federal Reserve have diminished. However, easing trade tensions between the US and EU have provided some relief, limiting the Dollar’s drop as the weekend approached. Monday’s trading may be less active due to public holidays, making market direction unclear until later in the week. We’ll be watching two critical events. First, the minutes from the last Federal Reserve meeting will likely provide insight into future policy discussions. Second, Canadian GDP data at the end of the week will capture traders’ attention as they reassess the Bank of Canada’s outlook for summer. For those engaged in derivatives markets, a measured approach is essential during this setup. There remains room for yield expectations to shift on both sides of the border. Canada’s inflation outlook is complex, and while retail data shows positive signs, it doesn’t guarantee sustained economic growth. Meanwhile, the US Dollar’s decline highlights how quickly market sentiment can change. Short-term FX volatility pricing may present opportunities if positioned ahead of impactful data, while rate-sensitive instruments could respond to further hawkish or dovish signals from the Federal Open Market Committee. It’s less about a significant policy shift and more about discerning which scenario seems most persuasive to central bankers—and importantly, to the markets. Create your live VT Markets account and start trading now.Gold prices decline towards $3,333 as US markets remain closed for a public holiday
Gold Price Movement
Gold prices stayed below $3,340 during the European trading session on Monday. The price dipped to about $3,333 while US markets were closed for Memorial Day. This decrease followed President Trump’s announcement that tariffs on the EU would be delayed until July 9. Although the news briefly lowered demand for safe-haven assets, worries remain about the US government’s financial situation. Citigroup raised its three-month gold price forecast to $3,500 per ounce, citing concerns about tariffs and global economic challenges. The US Dollar weakened further, reflecting ongoing fiscal anxieties in the market. Speculators reduced their positions, bringing their US Dollar exposure down from $16.5 billion to $12.4 billion. Trump’s tariff delay provided temporary relief for riskier assets. Gold support is seen at $3,307 and $3,258, with a chance to rebound to higher levels if it breaks through resistance at $3,386 and $3,415. Interest rates influence gold by affecting opportunity costs and the strength of the US Dollar. When rates rise, gold prices usually fall as the Dollar gains strength. The Fed Funds rate is a crucial economic indicator that affects financial markets.Gold Market Sentiment
On Monday, gold remained just under $3,340 in European trading, eventually dropping slightly to around $3,333. US markets were closed for Memorial Day, leading to less trading activity. Much of the uncertainty came from Trump’s announcement delaying EU tariffs until early July. This news briefly cooled demand for gold but did not ease overall concerns about the US fiscal situation, which still impacts currency sentiment. Citigroup has revised its three-month gold price forecast upward to $3,500 per ounce. This adjustment reflects ongoing global risks and trade concerns. The currency markets seem cautious, and this is evident in recent trading positions. Hedge funds and large speculators are reducing their net long US dollar holdings, dropping from $16.5 billion to $12.4 billion, indicating a change in outlook or a desire to lessen exposure. As for the market’s overall response, equities and riskier assets experienced mild relief due to the trade news. Investors shifted their focus toward riskier investments after the tariff delay. Although this provided some support, it was not enough for gold to break through resistance levels at $3,386 and $3,415. We will monitor these levels closely; a significant break above them could lead gold towards the mid-$3,400s. On the downside, gold has support levels around $3,307 and more firmly at $3,258. If prices reach these levels again, traders short on gold may want to take profits, while those looking to buy could find good entry points. Price movements around these areas often present chances for well-timed trades—if market liquidity allows. Interest rates remain a crucial factor here. They directly affect the opportunity cost of holding gold—when rates rise, gold typically underperforms since it doesn’t yield interest. Interest rate differences also influence currency flows, which is important because gold is priced in US Dollars. The strength or weakness of the Dollar can significantly impact gold prices, and its recent softness has been supportive for gold, even amid daily price fluctuations. We are particularly attentive to the Fed Funds rate. This benchmark not only indicates the direction of monetary policy but also affects returns across asset classes. When the Federal Reserve tightens conditions, it usually strengthens the US Dollar. Conversely, easing or expectations of easing can help gold rise. During this quieter week, even small shifts in rate expectations could influence market sentiment more than usual. As we look ahead, navigating positions around rate expectations and geopolitical developments will require precise timing. The coming days may seem relatively calm, but that should not be mistaken for stability—changes can happen quickly, and the premiums in many volatility structures remain sensitive. We’re closely watching implied volatility across gold and US Dollar pairs. Spread dynamics are showing some tension, affecting delta risk and gamma hedging strategies. Any sharp market movement, particularly resulting from fiscal news or unexpected economic data, will likely test the readiness of those holding short volatility or aggressive carry positions. Stay alert. Create your live VT Markets account and start trading now.GBP/USD starts strong near 1.3600 but could see a downward correction soon
GBP/USD started the week on a strong note, reaching its highest level since February 2022, close to 1.3600. However, it later pulled back as it appeared overbought according to technical analysis.
The US Dollar fell due to significant selling pressure. President Donald Trump’s warning of 50% tariffs on EU imports worsened the situation for the Dollar. This allowed GBP/USD to rally notably leading into the weekend.
Technical Analysis of GBP/USD
The technical analysis shows a bullish trend for GBP/USD based on the Elliott Wave theory, suggesting an ongoing upward movement. The pair is in an aggressive upward phase with positive long-term projections. During the week, the British Pound (Sterling) remained strong, staying above 1.3500. This strength was fueled by continued pressure on the US Dollar, intensified by Trump’s tariff threats. We saw GBP/USD reach levels not seen since early 2022, peaking near 1.3600 before a slight pullback. While the pair showed strong momentum at the start of the week, it showed signs of fatigue later on, at least in the short term. Indicators like the Relative Strength Index indicated overbought conditions, suggesting the rally was overstretched and possibly driven by speculation rather than solid economic fundamentals. The drop that followed aligned with prior technical signals. Overextensions often trigger profit-taking, especially amidst volatile macro headlines. This time, the Dollar faced ongoing trade policy risks. Trump’s harsh rhetoric regarding the EU led to decreased demand for the Dollar, allowing the Pound to extend its gains.Market Sensitivity Dynamics
The market is currently influenced as much by political events as by economic factors. The tariff threat further weakened the Dollar, providing more opportunity for Sterling to rise. This wasn’t merely reactive trading; it was strategic positioning in response to fears of broader economic consequences. From a wave analysis perspective, Elliott Wave structures indicate a definite upward trend. The current cycle appears to be in its active phase. This doesn’t mean a straight rise, but it suggests the likelihood of growth until these formations either complete or show signs of decline beyond minor technical setbacks. For short-term traders, finding the right balance is crucial. We’re in a phase that presents both opportunities and risks. While momentum remains strong, the potential for reversals is higher. Now is not the time to chase gains without caution. Utilizing tighter stop-loss orders and clear setups is essential, especially when political headlines can quickly change the landscape. Monitoring volume changes, breakout confirmations, or market divergences should take precedence over making decisions based solely on headlines. Price movements will react to both US data and trade announcements. If tensions escalate, the Dollar may weaken further, but any easing could quickly reverse market sensitivity. Positions with longer timeframes should consider the upside as still valid, particularly within established bullish trends, but they must also be ready for swings, given changing political factors. Tactically, we should prepare for sudden pullbacks, even with an overall positive outlook. Using layered entries and weighing risks from both Dollar and Sterling sides can provide more flexibility in unpredictable market conditions. Although Sterling has recently outperformed many peers, traders should keep their perspective. A significant move in currency over a short time can trigger adjustments—especially when the underlying fundamentals remain generally supportive. Signs of such adjustments are starting to emerge. Expectations around monetary policy are also coming into play. In the coming weeks, the market may be more sensitive to commentary from the Fed or BoE than to economic data. Traders need to be adaptable, as the focus could quickly shift from trade issues to central bank narratives. We should prepare for periods where technical indicators suggest strength, despite external factors that call for caution. Drawing insights from various sources, being patient with re-entries, and avoiding forced directional bets will be crucial as the next wave unfolds. Create your live VT Markets account and start trading now.EUR/JPY rises to around 163.00 as trade tensions between the EU and US ease
The EUR/JPY pair has increased by 0.45% to 162.60 during European trading, hitting a high of 163.00. This rise comes as trade tensions between the US and the EU have eased, with President Trump delaying a proposed 50% tariff until July 9.
US-EU trade discussions are ongoing after the EU asked for more time to negotiate a favorable deal by July 9. President Ursula Von der Leyen expressed hope for the talks with Trump, highlighting the EU’s readiness to move forward.
Effect of Germany’s GDP Data
The Euro received additional support from Germany’s first-quarter GDP data, revised to show a 0.4% growth, surpassing initial estimates of 0.2%. Meanwhile, the Yen is losing value, even though Japan reported a National CPI growth of 3.6% in April, which was faster than expected. In local markets, the Japanese Yen has weakened against major currencies, performing the worst against the New Zealand Dollar. The change in CPI numbers raises the possibility of an interest rate hike by the Bank of Japan in July. The Euro plays a crucial role for the 19 countries in the Eurozone, influencing trade balances and interest rates through the European Central Bank (ECB). Key economic indicators like GDP and inflation greatly affect the Euro’s value. Building on these developments, the EUR/JPY pair is currently favored by buyers, with the move toward 163.00 suggesting market participants are leaning toward the Euro in the short term. The postponement of a significant import tariff by the U.S. until early July gives markets some relief. For now, there’s reassurance that immediate disruptions to transatlantic trade have been delayed, if not eliminated. The new timeline offers just over a month of relative stability, which traders are starting to factor in.Impact of Trade Talks and Monetary Policies
Von der Leyen’s positivity has given the Euro more room to grow, especially as her comments show both sides’ willingness to avoid further conflict. Importantly, not only is there a cooperative tone, but the timeline is also key—markets prefer predictability, and the temporary delay suggests better chances for a negotiated resolution. Any sign of progress in these trade talks could further strengthen this trend. Germany’s Q1 GDP boost to 0.4% also provides solid support for the Euro. While the difference between 0.2% and 0.4% growth may seem small, it doubles the previous estimate under current conditions. Since Germany is influential in ECB policy, stronger economic performance could lead to more discussions about normalization in Frankfurt, reducing hesitancy around tightening. Conversely, the Japanese Yen faces opposing forces. April’s national inflation was 3.6%, which should normally support the currency. However, the Yen continues to weaken due to market expectations. Despite the CPI exceeding forecasts, there’s doubt that the Bank of Japan will act quickly or decisively enough to narrow the yield gap with other currencies. Investors are focused on the July meeting, but without a change in tone or pace from Governor Ueda, interest rate differentials will keep putting pressure on the Yen. This Yen weakness isn’t just seen in EUR/JPY; it’s also noticeable against higher-yielding currencies like the New Zealand Dollar. This reflects ongoing carry flows and a narrative where the Bank of Japan seems hesitant to reduce its accommodative stance as quickly as others. The situation is not just about inflation—it also concerns the credibility and timing of future guidance. For those trading derivatives, current movements show a clear direction, but it’s not straightforward. We must analyze how options volatility responds to trade timelines and monetary policy expectations. Implied volatilities on EUR/JPY have remained fairly stable, suggesting the market is anticipating a gradual trend rather than a sharp reversal. However, if political headlines or hawkish signals from the ECB emerge, hedging costs may rise. As we approach July, traders may continue to prefer Euro longs over Yen, assuming no significant changes from Ueda or a quick rise in European inflation. If speculation about a BoJ rate hike gains momentum, shorter expiration options will react quickly as traders adjust their expectations. For now, though, the divergence story remains intact, and the options flow reflects this trend. Some traders are favoring call spreads into next month, focusing on strikes between 163.50 and 165.00, aligning with recent technical patterns. We are closely monitoring the intersection of macroeconomic data and event-driven decisions. This is all happening in a compact six-week timeframe, and markets are not known for their patience. With each data release or political remark, recalibrations start anew. Traders with exposure tied to volatility or directional swings should maintain focus on timing rather than just price levels. Create your live VT Markets account and start trading now.Scotiabank’s Chief FX Strategist says GBP is nearing 1.36, its highest level since early 2022.
Pound Sterling has seen a slight rise, with no significant news over the weekend and no important data released today. The market is largely dismissing the possibility of a rate cut by the Bank of England at its June 19 meeting, and only minor surveys are expected this week.
The pound was trading just under 1.36 last night, reaching its highest level since early 2022. There’s minor resistance at 1.3595, which might limit any short-term gains, but the upward trend seems to be stable.


