USD/JPY climbs past 153.50 as Japan’s fiscal worries outweigh BoJ rate-hike expectations, drawing in fresh buyers
USD/JPY moved above the mid-153.00s in Asia on Wednesday after sharp swings the day before. However, it stayed below Tuesday’s weekly high as traders waited for the FOMC Minutes.
Japan’s softer Q4 GDP increased pressure on Prime Minister Takaichi to consider more stimulus after her landslide victory. The IMF warned against cutting the consumption tax, saying it would reduce fiscal room and raise debt risks.
Gold prices in Malaysia rose, according to compiled market data sources.
Gold prices rose in Malaysia on Wednesday, according to FXStreet data. Gold was priced at 618.23 MYR per gram, up from 611.67 MYR on Tuesday.
Gold climbed to 7,210.90 MYR per tola from 7,134.37 MYR the day before. It was also listed at 6,182.29 MYR for 10 grams and 19,229.17 MYR per troy ounce.
How Fxstreet Calculates Malaysia Gold Prices
FXStreet calculates Malaysia’s gold prices by converting global gold rates using the USD/MYR exchange rate and local weight units. Prices are updated daily at the time of publication and are for reference only, since local rates may differ. Gold has long served as a store of value and a means of exchange. It is widely used in jewellery. Many investors also view it as a safe-haven asset and a hedge against inflation and weaker currencies. Central banks hold the largest gold reserves. According to the World Gold Council, they bought 1,136 tonnes—worth about $70 billion—in 2022, the highest yearly total on record. Gold often moves in the opposite direction to the US Dollar and US Treasuries, and it can fall when stocks rise. It may gain when interest rates decline. Gold is priced in US dollars and traded as XAU/USD.Derivative Trading Implications For Gold In Malaysia
The rise in gold to 618.23 MYR per gram reflects a broader global move. This is more than a small daily change. It suggests market sentiment is turning more supportive for gold. A key driver is the shifting outlook for interest rates. Gold does not pay interest, so it often benefits when rates are expected to fall. After the US Federal Reserve’s January 2026 meeting, market pricing shows more than a 60% chance of a rate cut by June. Inflation has remained steady near 2.1%, which supports those expectations. Lower rate expectations can make gold more attractive than assets that earn interest. This view is also weighing on the US Dollar, which helps gold. The US Dollar Index (DXY) has dropped from its late-2025 highs and is now trading below the important 100 level. If rate-cut talk grows stronger, this downtrend could continue. A weaker dollar has historically supported higher gold prices. Another factor is steady buying by central banks, which can help set a floor under prices. In the final quarter of 2025, central banks in emerging markets continued adding to their reserves at a fast pace. Ongoing demand, along with ongoing geopolitical risks in several regions, supports gold’s role as a safe haven. For derivatives traders, this mix of factors suggests the potential for more upside in the weeks ahead. With equity markets moving sideways over the past month, gold is becoming more appealing. This may be a time to consider strategies that benefit from stable or rising gold prices, especially if implied volatility starts to pick up. Create your live VT Markets account and start trading now.Silver rises toward $74.75 amid US–Iran tensions, rebounding on safe-haven demand ahead of FOMC minutes
Silver rose to around $74.75 in early European trading on Wednesday. That was up 1.90% on the day, after prices moved back above $74.50. Demand rose as tensions between the US and Iran increased.
Iran’s Foreign Minister Abbas Araqchi said on Tuesday that the US and Iran agreed on the main “guiding principles” in talks over their nuclear dispute. However, he said a deal is not close. US President Donald Trump said Iran will make a deal and warned of consequences if issues are not resolved.
Us Iran Tensions Lift Silver
US inflation data did not change near-term expectations for Federal Reserve rate cuts. Higher rates can limit gains in non-yielding assets like silver. US headline inflation fell to 2.4% year on year in January, down from 2.7% in December. Core CPI rose 2.5%, compared with 2.6% previously. Markets are watching the FOMC minutes from the January meeting on Wednesday, after the Fed kept rates at 3.50%–3.75%. US markets are also reopening after a long weekend, which could increase volatility. On the daily chart, XAG/USD was at $73.68. The 20-day EMA was $83.30, and RSI (14) was 42.17. Price remains below the EMA, and momentum is still below the midline. In early 2025, silver surged above $74. Safe-haven demand linked to US-Iran tensions was a key driver. This lifted prices even though technical indicators looked weak. As of today, February 18, 2026, much of that geopolitical risk has eased, and market conditions have changed.Volatility And Strategy Outlook
The dovish Federal Reserve outlook we tracked last year played out. Two later rate cuts brought the federal funds rate to 2.75%–3.00%. This followed steady cooling in inflation, with the latest January CPI showing a manageable 2.1% annual rise. This backdrop has reduced support for non-yielding assets compared with a year ago. For derivatives traders, this has meant lower volatility. The Cboe Silver ETF Volatility Index (VXSLV) peaked above 40 during the 2025 geopolitical flare-ups. It is now closer to 28. Option premiums are therefore much cheaper. That lowers the cost to enter trades, but it also reduces potential returns for premium sellers. With silver now trading in a tighter range near $65, we think the sharp rallies are likely behind us for now. Selling out-of-the-money call spreads may be a useful income strategy in the coming weeks. This fits the lower-volatility environment and the view that silver may struggle to reach its 2025 highs without a major new catalyst. We also need to account for fundamentals, which look different from last year. The Silver Institute reports that industrial demand—especially from solar and electric vehicles—reached a record 654 million ounces in 2025. Because of this, it may make sense to use part of the premium earned from selling calls to buy long-dated, out-of-the-money puts. This can help protect against a drop if industrial activity slows unexpectedly. Create your live VT Markets account and start trading now.NVIDIA’s price was constrained in a rising parallel channel for months, then shifted after late-week trading moves
NVIDIA has traded in a rising parallel channel for most of the past year. Late last week, the price broke below the lower boundary. This was the second break below the channel this month, which points to a more corrective phase.
The old channel floor at $189.95 now acts as resistance (role reversal). A close back above $189.95, and back inside the channel, would cancel the breakdown. If the stock cannot reclaim $189.95, more selling and stop-loss triggers may follow.
If weakness continues, the first support level is $169.56. This area may attract buyers and could lead to a retest of the broken channel line from below. If $169.56 fails, the next support is $153.13. That level would mark a deeper pullback inside the longer-term uptrend.
Overall, the trend is weaker while the stock stays below $189.95. If selling pressure continues, $169.56 and $153.13 are the next key levels to watch.
Because the stock recently broke below the main channel that guided NVIDIA through 2025, we now see this as a chance to position for more weakness or a period of sideways trading. One direct approach is to buy put options with March or April expirations. Strike prices near the $170 support level can target a continued drop. This also hedges against the loss of momentum after last year’s historic rally.
The former support at $189.95 is now the most important resistance level. If you think a sharp rebound is unlikely, consider selling bear call spreads with the short strike just above $190. This can be a higher-probability trade as long as the stock stays below this new ceiling. Options data supports this shift: the 30-day put-to-call ratio has risen to 1.2, up from the 0.7 average in the final quarter of 2025.
With the next earnings report expected in a few weeks, implied volatility (now 48%) may rise. That would make option premiums more expensive. The breakdown also comes right after last week’s industry-wide warnings about slowing data center demand, which increases the chance of a big move. For traders expecting a sharp move but unsure of direction, long straddles or strangles may be attractive.
If this drop turns out to be a bear trap, similar to the brief dip in September 2025, selling bull put spreads is another option. By placing the short put strike below the minor support at $169.56, you can collect premium while betting that this first support level holds. Even after the pullback, the stock’s forward P/E is 55, still well above the semiconductor sector average of 32. That high valuation could make a quick recovery harder.
Traders await FOMC minutes as EUR/USD holds below the mid-1.1800s after rebounding from 1.1800 lows
EUR/USD traded in a narrow range during Wednesday’s Asian session, staying just below the mid-1.1800s. The pair paused after bouncing from the 1.1800 area, a one-and-a-half-week low.
Markets are waiting for the FOMC Minutes for clues on the Federal Reserve’s rate-cut path. Traders are pricing in a Fed cut in June and at least two rate cuts in 2026, which could cap demand for the US dollar.
Fed Minutes In Focus
The US dollar also came under pressure due to concerns about Fed independence and developments in US-Iran talks. Iran’s Foreign Minister Abbas Araqchi said there was broad agreement on guiding principles to address the nuclear dispute. The euro stayed under pressure as expectations for an ECB rate cut resurfaced, driven by signs of weakness in the Eurozone. Germany’s ZEW sentiment dipped to 58.3 in February from 59.6 in January, while the Eurozone Economic Sentiment Index slipped to 39.4 from 40.8. EUR/USD is hovering near 1.0820 and struggling to pick a clear direction after last week’s drop. The market looks cautious, pulled between mixed signals from the Federal Reserve and the European Central Bank. This pause gives traders time to think about positioning for the weeks ahead. A near-term Fed rate cut now looks less likely, especially after January US inflation came in at 3.3%, still above the Fed’s target. Strong retail sales data also supports the case for the Fed to wait, possibly until the third quarter. As a result, options that benefit from a stronger dollar—such as buying EUR/USD puts—are drawing more interest.Options Positioning And Volatility
In Europe, expectations for an earlier ECB rate cut are growing as the Eurozone economy slows. German industrial production fell 1.6% in December 2025, highlighting ongoing weakness in the region’s largest economy. This widening gap between the two economies may make selling EUR/USD call spreads attractive for collecting premium, since a strong rally may be hard to sustain. This is a big shift from late 2025, when the consensus expected coordinated rate cuts from both central banks through 2026. The continued strength of the US economy has forced a rethink of that outlook. Even so, implied volatility remains fairly low. That may change as key central bank meetings in March get closer. More traders are looking for ways to position for downside without paying too much upfront. One example is a bearish risk reversal, where an out-of-the-money call is sold to help fund the purchase of a put. Create your live VT Markets account and start trading now.Australia’s Westpac Leading Index fell 0.1% month on month, down from 0.08% in January
Australia’s Westpac Leading Index (month-on-month) fell to -0.1% in January. It was 0.08% in the previous period.
The Westpac leading index has moved into negative territory, falling to -0.1% in January. This points to Australian economic growth running below its long-term trend in the months ahead. The shift from small growth to contraction is an important forward-looking signal. For us, it suggests we should prepare for a possible slowdown.
Implications For Equity Markets
This result points to potential downside for Australian equities as analysts cut corporate earnings forecasts. We should consider buying S&P/ASX 200 put options to hedge or to take a view on a market pullback through the second quarter of 2026. The idea is that weaker economic momentum could push stock valuations lower. A softer economy also makes the Reserve Bank of Australia less likely to raise rates, and it could even put rate cuts on the table later this year. That backdrop usually weighs on the Australian dollar, which can make short positions in AUD/USD more appealing. The latest monthly CPI indicator, which shows inflation easing to 3.2% in January 2026, supports the view that the RBA’s next move is more likely down than up. As a result, we expect interest rate markets to start pricing a more dovish RBA. That makes long positions in 3-year and 10-year Australian government bond futures a logical trade, because prices tend to rise when yields fall. This view is reinforced by the unemployment rate rising to 4.2% last month, which suggests the labour market is starting to soften. We saw a similar setup in mid-2025, when the index briefly turned negative. That was followed by a period of market consolidation and a clear drop in business confidence. During that time, bond futures rallied strongly before the index recovered. That history suggests it is sensible to pay attention to this signal. With more uncertainty around the economic outlook, volatility may rise from today’s relatively calm levels. We can position for that by buying call options on the S&P/ASX 200 VIX index. This approach aims to profit from an increase in market volatility itself, which often shows up around key economic turning points.Volatility Positioning Approach
Create your live VT Markets account and start trading now.Dividend Adjustment Notice – Feb 18 ,2026
Dear Client,
Please note that the dividends of the following products will be adjusted accordingly. Index dividends will be executed separately through a balance statement directly to your trading account, and the comment will be in the following format “Div & Product Name & Net Volume”.
Please refer to the table below for more details:
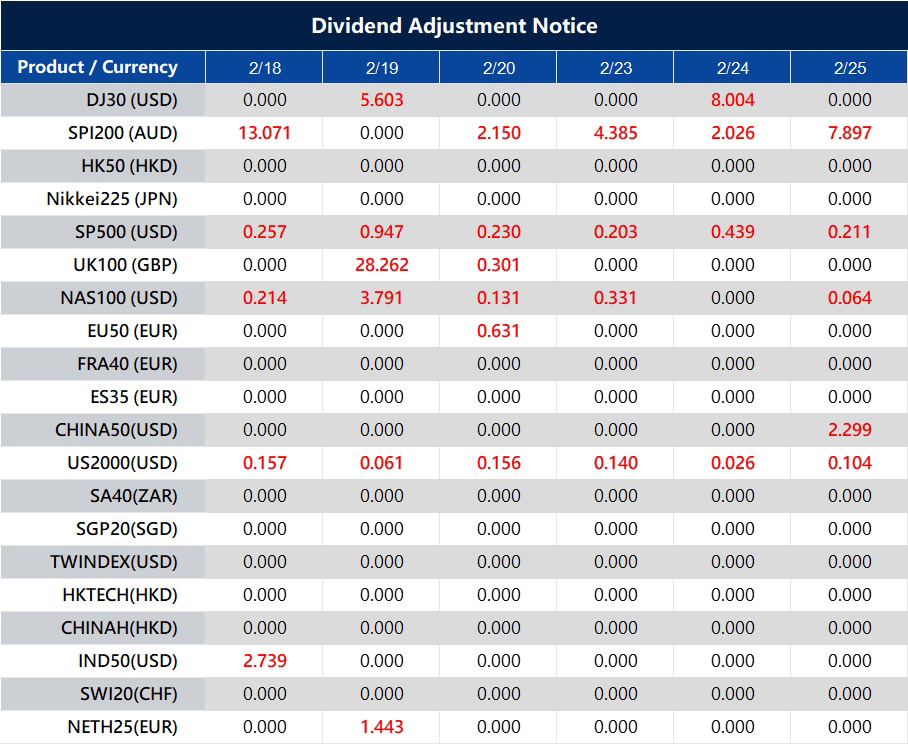
The above data is for reference only, please refer to the MT4/MT5 software for specific data.
If you’d like more information, please don’t hesitate to contact [email protected].
NAB’s Australian business confidence fell to -0.1 quarter-on-quarter, down from 2 in Q4
National Australia Bank said its business confidence measure fell from the prior quarter. It dropped to -0.1 in the fourth quarter, down from 2 in the previous quarter.
Business confidence turned negative in late 2025, falling to -0.1. This is a clear bearish sign. It suggests many businesses expect weaker conditions ahead. That often leads to less investment and slower hiring. For us, this raises the odds of a weaker Australian dollar in the near term.
Implications For The Australian Dollar
We should look at trades that benefit if AUD/USD falls, such as buying put options. This view is supported by recent data showing January inflation slowing to 2.9% year over year. Lower inflation gives the Reserve Bank of Australia more room to cut rates. In the past, when business confidence dipped below zero—such as during the 2011 and 2019 slowdowns—the AUD often lagged in the months that followed. This negative mood could also weigh on the stock market by lowering expectations for corporate earnings. The ASX 200 has started 2026 slowly and has struggled to hold gains as global sentiment changes. Index derivatives can be used to hedge or to position for a downturn, such as buying put options on the XJO. Weak confidence and easing inflation also strengthen the case for a more dovish RBA. The RBA held rates steady at the early February meeting, but markets are now pricing a higher chance of a cut by mid-year. Traders should watch interest rate futures, which may react strongly to upcoming employment and retail sales releases. With more uncertainty, market volatility may rise from the calm levels seen late last year. Higher implied volatility can make options strategies more attractive. Buying protective puts on major Australian banks and miners could help protect portfolios if growth slows.Managing Risk With Options
Create your live VT Markets account and start trading now.During Asian trading, USD/CAD hovered near 1.3645 as softer CPI and lower oil prices weakened the Canadian dollar
USD/CAD rose to around 1.3645 during Asian trading on Wednesday. The Canadian dollar weakened after softer inflation data and falling crude oil prices.
Statistics Canada said Canada’s CPI inflation cooled to 2.3% year over year in January, down from 2.4% in December. The figure also came in below the 2.4% market forecast. This increased expectations of another Bank of Canada rate cut.
Oil Prices And Geopolitical Tensions
Oil prices slipped as tensions between the US and Iran eased. Iran’s Foreign Minister Abbas Araqchi said both sides agreed on the main “guiding principles” in the nuclear talks, but also stressed that a deal is not close. Canada is a major oil exporter, and lower oil prices often put pressure on the Canadian dollar. Markets are now watching the FOMC Minutes due later on Wednesday. The Minutes may offer clues about the Federal Reserve’s next moves on interest rates. If the tone is dovish, the US dollar could weaken in the near term. In February 2025, markets correctly priced in a Bank of Canada rate cut as inflation fell. The BoC followed with cuts in April and June 2025, which helped lift USD/CAD toward 1.39 by mid-year. Today, the situation looks different.How The Backdrop Has Changed
Canada’s story has shifted from cooling inflation to more persistent price pressure. Statistics Canada’s latest report for January 2026 showed CPI rising to 2.9%. That is well above last year’s levels and makes near-term BoC rate cuts less likely. This firmer inflation gives the Canadian dollar support that it did not have in early 2025. Last year, WTI crude prices weakened as geopolitical risks cooled, which weighed on the loonie. Now, crude is holding above $82 a barrel on tighter global supply forecasts for 2026. That strength is a clear tailwind for the commodity-linked CAD, reversing the pattern seen a year ago. The Federal Reserve was also central last year. By keeping rates steady through 2025, the Fed created a wide policy gap versus the Bank of Canada. Now, with Canadian inflation staying sticky, that gap is expected to narrow. This shift in rate expectations is making the US dollar less attractive compared with the Canadian dollar. Against this backdrop, USD/CAD appears more likely to drift lower. Traders may consider strategies that benefit from a falling or range-bound pair, such as buying CAD call options or selling out-of-the-money USD call options. These strategies target a possible move toward the 1.3500 support area in the weeks ahead. A key risk to this view is a stronger-than-expected US economic report that brings back hawkish expectations for the Fed. To manage that risk, a bearish put spread on USD/CAD can help define downside exposure. This approach seeks to profit from a moderate decline while limiting losses if the US dollar rallies unexpectedly. Create your live VT Markets account and start trading now.After the RBNZ holds rates steady, NZD/USD attracts sellers and retreats toward 0.6000 again
NZD/USD fell after the Reserve Bank of New Zealand (RBNZ) left policy unchanged on Wednesday. The pair drifted back toward 0.6000 after hitting a more than one-week low the previous day. Markets are now focused on whether it will break below 0.6000.
The RBNZ kept the Official Cash Rate at 2.25% at its February meeting, after three rate cuts in 2025. With no clear move toward tighter policy, the decision gave little support to the New Zealand Dollar.


