USD/CAD hovers around 1.3830 during Asian trading, extending its decline for the fourth session.
USD/CAD is still trading under 1.3850, driven by a stronger Canadian Dollar (CAD) thanks to rising oil prices. During Thursday’s Asian trading session, it remained around 1.3830.
West Texas Intermediate (WTI) oil held steady at about $60.50 per barrel after increasing for four straight days. Although there are concerns about oversupply, easing geopolitical tensions have helped reduce risks related to energy demand.
Silver price drops to around $91.80 during Asian trading as safe-haven interest declines
Silver prices dropped to about $91.80 during Thursday’s trading in Asia, a decline of 0.92%. This drop followed US President Donald Trump’s decision to back off his tariff threat regarding Greenland, which lessened the demand for safe assets like silver.
The Federal Reserve is likely to keep interest rates steady for now and may do so until Chair Powell’s term ends in May. Trump’s announcement about Greenland eased earlier tensions, making safe-haven assets, such as silver, less attractive.
Economists believe that the strong US Dollar will keep putting pressure on non-interest-bearing assets like silver. However, if trade tensions between the US and Europe rise again, demand for safe-haven assets like silver could increase.
Silver plays an important role in industries like electronics and solar energy, which can affect its price. Additionally, silver prices often move along with gold prices, as both are seen as safe-haven investments. Key factors influencing silver’s market include interest rates, the strength of the US Dollar, and geopolitical events.
With silver falling below $92.00, we view this as a short-term response to declining tensions over Greenland. The Federal Reserve’s decision to keep interest rates steady until at least May will continue to support the US Dollar, creating challenges for non-yielding assets. This sentiment is mirrored in broader markets, as the CBOE Volatility Index (VIX) fell below 14 last week for the first time in months, indicating less market fear.
Given the Fed’s firm stance, traders should think about strategies to prepare for potential weaknesses in the coming weeks. Buying put options could offer downside protection, especially since profit-taking may continue after recent record highs. This caution is backed by manufacturing PMI figures from late 2025, which showed a slight dip in industrial demand following a very strong year.
However, we shouldn’t overlook the uncertainty surrounding the new Greenland agreement, as key officials from Europe and the US have expressed skepticism. The market whiplash during the 2025 trade disputes reminds us how quickly sentiment can shift from one headline.
This combination of a hawkish Fed and unstable geopolitics may lead to increased volatility. Implied volatility on silver options has decreased from its peak during the Greenland tariff threats but remains high compared to the calm seen in early 2025. This suggests that using option straddles or strangles could be beneficial for traders expecting a significant price shift, but unsure of the direction.
Finally, we should consider the gold-to-silver ratio, now around 52, with gold priced above $4,800. This is a low historical ratio, often indicating times when silver underperforms gold. This suggests silver may be overvalued compared to gold, implying that any new investments in precious metals might lean toward gold until this ratio widens.
WTI oil prices near $60.50 after four days of increases, amid oversupply concerns
**WTI Oil Prices Hold Steady**
WTI oil prices are steady at around $60.50, driven by worries about oversupply. The International Energy Agency has noted that global supply will outpace demand this year. Still, we see a slight uptick in oil prices due to reduced demand risks linked to US-EU trade issues involving Greenland and temporary shutdowns in Kazakhstan.
WTI, a type of crude oil, remained stable after four days of gains, trading at $60.60 per barrel in Asia. Even with supply risks, fears of oversupply continue, as US crude inventories rose by about 3 million barrels last week. Easing geopolitical tensions have further influenced energy demand forecasts.
There’s some optimism about tighter supply due to temporary shutdowns at Kazakhstan’s Tengiz and Korolev fields. Venezuelan oil exports have also climbed to 7.8 million barrels, signaling a slow recovery in production. Valero Energy’s purchase of Venezuelan crude under a US agreement is a notable development.
WTI oil, recognized for its quality, serves as a benchmark in global markets and is heavily affected by factors like global growth, political stability, and the value of the US Dollar. Inventory data and OPEC’s production choices significantly shape WTI prices. OPEC+ includes key non-member countries like Russia, impacting overall oil dynamics.
The current WTI price of about $82 per barrel contrasts sharply with market conditions from last year. Conflicting signals from tight OPEC+ supply and mixed global demand forecasts create substantial uncertainty for the upcoming weeks. Derivative traders will need to analyze both current data and historical trends to manage potential price fluctuations.
**Historical Market Comparisons**
A similar struggle between supply and demand occurred in 2025 when WTI was around $60.50. Then, the International Energy Agency warned of significant oversupply, which limited price increases. This shows how quickly supply concerns can take over the market, even amid positive news.
Currently, the demand outlook is affected by the International Monetary Fund’s modest global growth forecast of 2.9%, creating some challenges. This contrasts with last year, where easing geopolitical tensions boosted market sentiment by reducing demand risks. The focus now appears to be more on the strength of the economy rather than political stability.
On the supply side, OPEC+ has decided to maintain production cuts of 2.2 million barrels per day through the first quarter, keeping the market tight. This disciplined strategy, alongside a recent EIA report showing an unexpected inventory drop of 1.8 million barrels, supports prices well. This is a stronger supply situation than the temporary field shutdowns seen in Kazakhstan in 2025.
Geopolitical risks are adding a layer of concern, with increased naval patrols in the Strait of Hormuz raising fears of possible transit disruptions. Last year, the emphasis was on de-escalation after the US eased tariff threats over Greenland. The current environment seems more susceptible to sudden shocks that could affect supply lines.
**Investment Strategies for Volatility**
In light of this volatile backdrop, traders might consider options strategies that can benefit from significant price movements in either direction. Buying a straddle—purchasing both a call and a put option with the same strike price and expiry date—could be a smart move to capitalize on expected fluctuations. This strategy profits if WTI makes a substantial move either up or down before the options expire.
For those who have a directional yet cautious outlook, bull call spreads on WTI futures provide a defined-risk approach for potential upside movement. This involves buying a call option at a lower strike price while selling another call at a higher strike price. This method could take advantage of price increases toward the higher strike, while also limiting initial costs and potential losses if the market declines.
Create your live VT Markets account and start trading now.
In January, the United States experienced a drop in weekly crude oil stock to 3.04 million.
The latest data on U.S. crude oil stocks shows a drop. As of January 16, crude oil inventories have decreased to 3.04 million barrels, down from 5.27 million barrels. This change indicates shifts in supply and demand.
Market Expectations And Trading
Such information can affect market expectations and trading decisions. It’s a crucial indicator for the energy sector. The reported decline of 3.04 million barrels in crude oil stocks for the week ending January 16th suggests strong demand or limited supply, both of which typically support higher prices. This marks the third consecutive week of stock declines, reflecting a trend that has been developing since the start of the year. The official EIA report also confirmed this trend, noting a draw of 2.8 million barrels and refinery utilization remaining robust at 93.5%. This high operational rate shows that refiners are actively processing crude to meet the demand for products like gasoline and heating oil, indicating that the physical market remains tight. For those expecting prices to rise, this data may justify buying call options on March 2026 WTI contracts. The severe winter weather in the U.S. Northeast is raising heating degree days by 15% above the ten-year average, driving up the demand for heating oil. This fundamental pressure could lead to higher crude prices soon.Economic Activity And Market Sentiments
However, it’s important to note that this week’s drop is smaller than the previous week’s decline of 5.27 million barrels. This slowdown, along with the latest U.S. manufacturing PMI falling to 49.8, might signal weakening economic activity. A slowing economy could eventually reduce oil consumption. This signs of weakness suggest considering protective put options or bear put spreads to guard against a potential price drop. While crude stocks decreased, gasoline inventories increased by 2.1 million barrels, suggesting that end-users may not be demanding fuel as much as refinery output indicates. There seems to be a disconnect between refiners’ optimism and consumer behavior. Last January, a similar inventory draw pattern led to a price correction in February as post-holiday demand decreased. This historical trend suggests caution against becoming overly bullish based on just a few weeks of data. We are likely to see continued volatility. We are also keeping an eye on global tensions, particularly with the OPEC+ virtual meeting scheduled for February 5th. Any announcements regarding production quotas for the second quarter could lead to significant market fluctuations. Holding long volatility positions through options seems like a smart strategy over the next few weeks. Create your live VT Markets account and start trading now.New Zealand dollar climbs towards 0.5850 against the US dollar amid risk-on sentiment
The NZD/USD climbed close to 0.5850 during the Asian trading hours. This followed President Trump easing concerns about European tariffs. He also announced a framework for a deal regarding Greenland, which could bolster the New Zealand Dollar against the US Dollar.
Upcoming economic data will play a crucial role for the NZD. New Zealand is set to release its Q4 Consumer Price Index (CPI) inflation report on Friday. Analysts predict a 0.5% increase in quarterly CPI and a 3.0% rise from last year. Lower inflation could affect the Reserve Bank of New Zealand’s (RBNZ) decisions on interest rates.
Factors Influencing The NZD
The value of the New Zealand Dollar is impacted by various factors, such as the country’s economic performance and central bank policies. The economic health of China is important for the NZD because of New Zealand’s trading ties with China, particularly in dairy products. The RBNZ aims for inflation to stay between 1% and 3%, which influences its interest rate decisions and, in turn, the value of the NZD. Changes in economic data showing growth or decline can change the NZD’s value. Additionally, market sentiment can greatly influence the NZD. Periods of risk-taking can boost the currency, while uncertainty can lead to a decline. Reflecting on last year, in January 2025, the NZD/USD was hovering around 0.5850, driven by hopes of easing trade tensions from the Trump administration. That type of geopolitical risk has lessened, allowing us to focus more on core economic factors. Currently, the pair is trading around 0.6120, showing a new landscape for traders. A year ago, we were anticipating Q4 2024 inflation data to assess whether the RBNZ would raise interest rates. Now, the latest report for Q4 2025 indicates that annual inflation has cooled to 2.8%, comfortably within the RBNZ’s target range. This suggests the RBNZ is likely to maintain its cash rate at 5.5%, limiting upside potential from interest rate differentials and making long-dated call options less appealing.Current Market Sentiment
It’s important to let fundamental factors, like the health of the Chinese economy and dairy prices, shape our strategy. Recent data shows China’s Caixin Manufacturing PMI fell to 49.8, signaling a slight contraction. Additionally, the Global Dairy Trade index has decreased in the last two auctions. These signs indicate traders should remain cautious and might consider purchasing puts to guard against a potential drop in the NZD/USD. While early 2025’s favorable market mood provided temporary support for the Kiwi, current sentiment is more cautious due to fears of a global growth slowdown. The US economy continues to show strength, with weekly jobless claims consistently below 220,000, supporting the US Dollar. This situation suggests that selling rallies in the NZD/USD could be a wise strategy for the weeks ahead. Create your live VT Markets account and start trading now.Japan’s merchandise trade balance dropped from ¥62.9 billion to ¥-0.21 billion
Japan’s adjusted trade balance fell from ¥62.9 billion to ¥-0.21 billion in December. This change highlights shifts in imports and exports over the month.
In the currency market, the Japanese Yen declined as USD/JPY approached 159.00. At the same time, NZD/USD climbed above 0.5850 as concerns about risk eased.
Commodity Market Updates
In commodities, WTI crude oil stabilized above $60.50 due to easing geopolitical worries offsetting oversupply issues. Gold also remained above $4,800 thanks to reduced geopolitical tensions. Cryptocurrencies showed signs of recovery, with Canton, MYX Finance, and Pump.fun all reporting gains in the last 24 hours. Axie Infinity (AXS) rose by 8%, trading over $2.56 after a week of positive momentum. For traders looking at 2026, reviews highlight the best brokers for different needs, including forex trading, CFDs, and Islamic accounts. Guides focus on brokers that offer low spreads, high leverage, and platforms like MT4, particularly for regions such as MENA, LATAM, and Indonesia. Japan’s unexpected trade deficit is a key indicator, especially as USD/JPY nears 159. This isn’t a minor detail; it weakens the case for the yen. We should expect ongoing yen weakness in the coming weeks.Trade Strategy Insights
We remember similar trends from 2022, when rising energy import costs and a weak yen led to a record annual trade deficit of nearly ¥20 trillion. With WTI crude staying above $60, we see the same pressures now affecting Japan’s import costs. The main issue is the significant difference in monetary policies. The Bank of Japan’s policy rate is close to zero, while the US Federal Reserve’s rate is above 3%. This interest rate gap makes selling the yen for dollars a profitable “carry trade.” This trend is unlikely to reverse soon, giving a consistent boost to USD/JPY. As a result, our clear strategy is to take long positions in currency pairs like USD/JPY and EUR/JPY. However, we must be cautious as the yen weakens past levels that previously prompted government intervention from 2022 to 2024. The risk of a sudden intervention by the Ministry of Finance is much higher now. To manage this risk, buying call options on USD/JPY could be a smart move. This strategy allows us to benefit from further yen weakness while limiting losses to the premium paid if the government intervenes. It gives us the potential for profit while controlling our risk amid volatility. Create your live VT Markets account and start trading now.Dividend Adjustment Notice – Jan 22 ,2026
Dear Client,
Please note that the dividends of the following products will be adjusted accordingly. Index dividends will be executed separately through a balance statement directly to your trading account, and the comment will be in the following format “Div & Product Name & Net Volume”.
Please refer to the table below for more details:
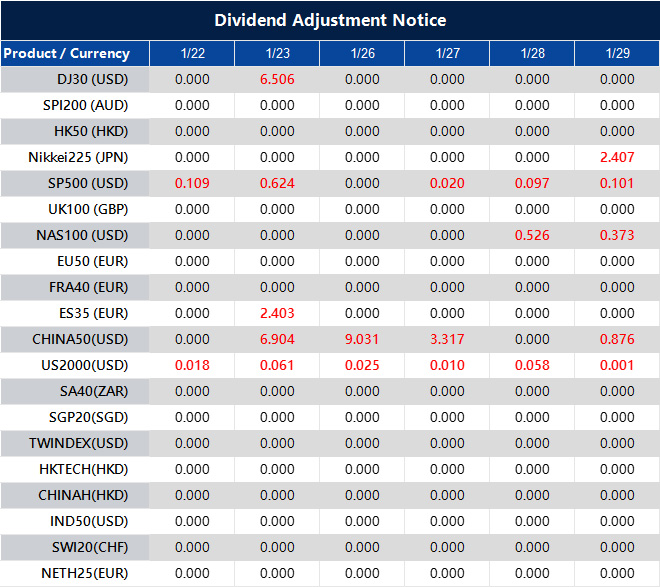
The above data is for reference only, please refer to the MT4/MT5 software for specific data.
If you’d like more information, please don’t hesitate to contact [email protected].
The People’s Bank of China sets the USD/CNY rate at 7.0019, differing from 7.0014
The People’s Bank of China (PBOC) has set the USD/CNY central rate at 7.0019 for the upcoming trading session. This is slightly higher than yesterday’s rate of 7.0014 and above the Reuters estimate of 6.9697.
The PBOC’s main goals are to keep prices stable, manage exchange rates, support economic growth, and push for financial reforms. To achieve these goals, the central bank uses several tools, including the seven-day Reverse Repo Rate, the Medium-term Lending Facility, the Reserve Requirement Ratio, and the Loan Prime Rate.
China’s Banking Sector
The state owns China’s central bank, with the Chinese Communist Party Committee Secretary influencing its management. Currently, there are 19 private banks in China, including digital banks like WeBank and MYbank. In 2014, China allowed private banks to join its primarily state-controlled financial sector. Although there are not many of them, these private banks play a small role in the financial system. The People’s Bank of China has set the yuan’s reference rate lower than expected, crossing the important 7.00 mark against the dollar. This move shows a willingness to allow the currency to depreciate, likely to support the economy. It suggests we should adjust our short-term currency strategies. This decision aligns with recent economic data. Full-year GDP growth for 2025 is projected at 4.8%, which is below the government’s target. Additionally, December’s export data showed a slight year-over-year decline, and the latest Caixin Manufacturing PMI is just above 50, indicating weak expansion. These figures explain why authorities might prefer a weaker yuan to boost the competitiveness of Chinese goods abroad.Central Bank Policy Direction
Remember the central bank’s actions in late 2025 when it lowered the Reserve Requirement Ratio for major banks to increase liquidity in the market. Today’s currency fixing seems to follow that accommodative policy. This trend suggests that further yuan weakness is possible and part of a broader support strategy for the economy. In the coming weeks, we should consider preparing for a higher USD/CNY rate. This could involve buying USD call options or CNH put options to benefit from a potential upward movement while managing our risk. The difference between the market estimates and today’s fix is a strong indication that we should be cautious about holding onto the yuan right now. Now that the 7.00 level has been crossed in the daily fix, we should watch for resistance around the 7.10 mark, a level tested back in 2024. Expect increased volatility in the pair as the market reacts to this policy signal. We will seek opportunities in instruments like vanilla options or forward contracts that could benefit from this potential trend. Create your live VT Markets account and start trading now.Australian Bureau of Statistics reports unemployment rate drops to 4.1%, exceeding expectations
Australia’s unemployment rate fell to 4.1% in December, down from 4.3% in November, and better than the expected 4.4%. There was an increase of 65.2K jobs, bouncing back from a loss of 28.7K jobs in November, surpassing the forecast of 30K.
The participation rate slightly increased to 66.7% from 66.6% in November. Full-time jobs rose by 54.8K following a drop of 65.3K, while part-time jobs added 10.4K in December, lower than the previous month’s increase of 36.6K.
Factors Behind Employment Growth
More jobs for those aged 15-24 played a key role in these changes. Male employment rose by 49,000, while female employment increased by 17,000. Total hours worked went up by 0.4%, matching the growth in jobs. After this employment news, the Australian Dollar strengthened, with the AUD/USD rising 0.40% to 0.6788. The AUD gained the most against the Japanese Yen. The Reserve Bank of Australia is set to meet on February 3 to discuss monetary policy for the year. Although employment data was mixed, it hints at some easing for the RBA, keeping in mind the ongoing inflation concerns. Australian employment statistics are closely monitored as they affect currency values and can influence central bank decisions.Economic Impact and Market Reaction
The December 2025 employment report has significantly changed the economic outlook. The unemployment rate dropped to 4.1%, and job growth surpassed expectations, contradicting earlier beliefs that the labor market was cooling. This unexpected strength indicates the Australian economy might be more robust as we approach 2026. This report puts pressure on the Reserve Bank of Australia ahead of its meeting on February 3rd. With inflation at 3.4% in November 2025, the strong employment figures complicate any consideration for rate cuts by the RBA. Currently, there’s a 45% chance of a rate hike at the upcoming meeting, a sharp increase from just 15% before the report. For traders, this indicates it’s time to prepare for a stronger Australian Dollar. We might look at buying AUD/USD call options with strike prices above the present resistance of 0.6830, aiming for a move towards 0.6870. This strategy offers a manageable risk while capitalizing on potential gains ahead of the RBA decision. The case for a stronger AUD is also backed by external factors. Iron ore prices, a vital Australian export, have climbed over 5% in the last month to more than $140 per tonne. This historical trend supports a stronger AUD, aided by recent data showing unexpected growth in China’s manufacturing sector in early January. The last crucial element will be the Q4 2025 inflation report, due on January 28. If this report also shows high inflation, it will likely prompt the RBA to act, reinforcing the argument for a more aggressive stance. We will closely monitor this release as key support for our positive outlook on the Aussie dollar. Create your live VT Markets account and start trading now.GBP/USD pair fluctuates above 1.3400 as traders await US economic data
The GBP/USD pair is currently trading in a tight range above 1.3400 with little movement. Traders are waiting for the US PCE Price Index and Q3 GDP data to guide their decisions.
Factors easing trade tensions benefit the USD, while mixed market signals call for careful trading. A key technical level is the 200-day Simple Moving Average around 1.3365-1.3360.


