Japan’s Economy Minister Akazawa says the government will continue pursuing a review of US tariffs
Japan’s Economy Minister, Ryosei Akazawa, stated that the government will continue to ask for a review of US tariffs. They will also take steps to support businesses affected by these tariffs.
The minister mentioned that better employment and income could help the economy recover slowly. However, he warned about potential risks from US trade policies. Rising prices have hurt consumer and household confidence, creating a challenge for the economy.
Reuters poll suggests RBA could lower cash rate to 3.85% and more cuts are expected
A Reuters poll of 43 economists examined what they think the Reserve Bank of Australia (RBA) will do next. Most, 42 economists, predict the RBA will lower the cash rate to 3.85% on May 20. One economist expects a bigger cut of 50 basis points. Three major Australian banks—ANZ, Commonwealth Bank of Australia, and Westpac—anticipate a 25 basis point reduction, while NAB expects a 50 basis point cut.
The median forecast suggests that the cash rate could fall to 3.35% by the end of 2025. ANZ updated its forecast after recent news about tariffs in April, now predicting a cash rate of 3.35%. Changes in global growth and shifts in the business climate are affecting these predictions. The current downturn in business activity supports the idea of an RBA rate cut. Tariff changes are also seen as a factor influencing consumer confidence and the overall economic outlook.
Expectations of Rate Reduction
Most economists agree the Reserve Bank will likely cut rates. Out of the 43 surveyed, nearly everyone expects a 25 basis point cut at the next meeting. Only one economist thinks the RBA might make a bigger cut of half a point. This view is in the minority, as most believe the change will be more gradual. These predictions aren’t based on guesswork; they are founded on recent data. Recent tariff developments have prompted some institutions to adjust their cash rate forecasts. For instance, ANZ has revised its outlook and now expects a drop to 3.35% by the end of next year. This suggests that the bank sees ongoing weakness in the domestic economy. Currently, business sentiment is low, and if this trend continues, the Reserve Bank may need to act sooner or more decisively. Consumption figures haven’t bounced back as expected, and the economy seems to be in a cautious state, focusing more on economic support rather than strictly controlling inflation.Market Implications
For those involved in rate-sensitive instruments, it’s time to adjust positions. Timing is critical, as central bank actions are becoming clearer. Delayed responses can be costly. Rate cut options reflecting the majority view may become less appealing, while floating expectations in swaps and futures aren’t fully aligned with anticipated future cuts. Right now, discrepancies between market players and institutional forecasts create pricing inefficiencies. Major banks are allowing for a gradual reduction in rates, with Westpac and others supporting a series of smaller cuts rather than one large adjustment. Meanwhile, NAB believes conditions are enough to justify an early, larger cut. This difference in bank strategies is important and creates opportunities across the yield curve. Targeting shorter- and medium-term swaps aligns with the more cautious forecasts. Adjusting positions—either through directional bias or by taking advantage of volatility—may be necessary, especially where rates haven’t fully reflected potential downturns. Business sector weaknesses are a key indicator of how much monetary policy needs to adjust. While tariffs might seem external, they directly influence consumer behavior and spending, impacting the central bank’s assessments. It’s crucial to monitor this connection, especially as it relates to household demand data. Volatility hasn’t increased much, indicating stable expectations for rate movements. However, the cash rate path could still affect final pricing—making a calendar-specific strategy more appropriate in the short term than anticipating sharp changes. There are no surprises here. What stands out is the gap between the official stance and the actual economic situation. This gap is large enough to present trading opportunities. Create your live VT Markets account and start trading now.Japan’s annualised GDP decreased by 0.7%, missing the predicted 0.2% growth
Japan’s Gross Domestic Product (GDP) fell by -0.7% in the first quarter, missing the expected -0.2%. This economic decline comes as the Bank of Japan (BoJ) is anticipated to make changes to its monetary policy soon.
The AUD/USD pair has risen above 0.6400 during the Asian session, thanks to a weaker US Dollar overshadowing fears of an upcoming rate cut by the Reserve Bank of Australia. Meanwhile, USD/JPY has bounced back to around 145.50, despite Japan’s disappointing GDP news, due to differing central bank strategies.
Gold Price Movement
Gold prices have struggled to recover near the 200-period Simple Moving Average after recently bouncing back from a significant low. A temporary truce in US-China trade issues has eased global tensions, affecting demand for gold. Cryptocurrencies like Bitcoin and Solana have seen small drops after FTX revealed plans for a second round of payments to creditors. In the UK, new economic growth data from the first quarter has stirred questions about its true implications for the economy. For traders interested in EUR/USD, many brokers provide competitive spreads and quick platforms. Various options are available for traders of all experience levels, offering tools for effective Forex trading. Japan’s GDP data for the first quarter shows a disappointing result, with output declining more than expected. The economy is shrinking at an annualized rate of 0.7%, which is significantly worse than the predicted -0.2%. This indicates weaker domestic demand and may suggest slowed business investments and consumer spending. This decline could hinder any quick changes to monetary policy from the Bank of Japan. Although inflation persists, faltering growth limits the ability to tighten financial conditions significantly. Kuroda’s successor now faces a more challenging situation. The monetary authorities might still aim for normalization later in the year, but this contraction complicates matters. Traders focused on the yen should be aware that if economic output remains pressured, any policy changes may come later or be more cautious than previously indicated. The USD/JPY’s rise to 145.50 shows that traders are prioritizing rate differences over local economic performance. This trend should remain a focus, especially with the Fed maintaining a more aggressive stance.Australian Dollar And US Dollar Dynamics
On the other side of the world, the AUD/USD has extended beyond 0.6400. This is less about the strength of commodities or domestic demand and more due to a weakened US Dollar. Surprisingly, discussions of a possible rate cut by the Reserve Bank of Australia haven’t affected the Aussie much for now. Instead, a shift in expectations regarding US rates—driven by recent inflation data—has taken center stage. We should monitor how markets react to upcoming Australian CPI and employment data ahead of the next policy meeting. Gold has encountered resistance just below the 200-period Simple Moving Average, as its rally is slowing. Investors are reassessing geopolitical risks amid a temporary easing of US-China trade tensions, which is influencing demand. While gold remains popular as a safe-haven asset, any drop in safe-haven demand could limit price increases. Currently, the market appears uncertain, likely to remain so until more clarity emerges regarding interest rates or global risk sentiment. In the digital assets space, Bitcoin and Solana have dipped following FTX’s announcement of another round of creditor payments. This news slightly increases supply, possibly leading to minor fluctuations in trading as the market adjusts post-bankruptcy effects. We should stay vigilant for further updates from the FTX estate, as continued selling could shift short-term market momentum. In the UK, discussions have renewed about the true nature of the surprisingly strong Q1 GDP data. Initial reports suggest recovery, but concerns linger over whether trends are genuinely improving or just reflecting seasonal factors and one-off contributions. The mild reaction in sterling indicates that traders are skeptical about the robustness of these headline figures. This caution could be significant, particularly if subsequent reports lower previous estimates. In summary, the market is influenced by economic performance and varying central bank approaches. Movements in major currency pairs and safe-haven assets are driven more by expectations for policy changes and yield differences rather than headlines. It will be important to observe implied volatility and positioning data in the coming sessions, especially as participants balance new data against future guidance. Create your live VT Markets account and start trading now.The Trump administration is split on when to blacklist Chinese chipmakers amid trade negotiations.
The Trump administration is set to add several Chinese chipmaking companies to an export blacklist known as the “entity list.” This decision comes after a recent trade agreement between China and the US in Geneva.
Timing is tricky. Some officials worry that putting these export controls in place right now could hurt ongoing trade discussions. There are mixed opinions within the administration about how this move could affect negotiations.
Tightening Restrictions
This action shows that the US is tightening restrictions at a sensitive time, as both countries were cautiously working to reduce trade tensions. The “entity list” acts as a trade barrier, stopping US businesses from selling certain products to blacklisted companies without special permission. Once a company is added to the list, it often loses access to vital components and markets, especially in the semiconductor industry, where global supply chains are deeply intertwined. Expanding the list now indicates a focus on national security over business flexibility. Some officials support this decision due to fears of China’s fast-growing tech industry, seeing it as a medium-term threat to US industrial leadership. However, others caution that these restrictions could hurt the trust built during recent negotiations. The Geneva agreement was a temporary truce, and any action that seems to undermine it could lead to retaliation or hinder cooperation. An important takeaway is that internal disagreements can make policy outcomes unpredictable. When uncertainty rises, market volatility often increases, leaving little room for stable predictions, especially regarding high-value sectors like microchips.Trading Strategies and Risks
For those trading derivatives linked to manufacturing indices or tech sectors, the near-term strategy should consider this uncertainty. Blacklisting decisions could happen before official announcements, leading to sudden changes in market prices. It’s essential to shorten reaction times, closely monitor pre-market releases, and stay cautious of market-moving news from leaks or briefings given to select reporters. Patterns observed from previous additions to the blacklist in August and October show limited rebounds after impacted stocks decline. Models predicting quick recoveries were inaccurate, particularly when Asian liquidity dropped ahead of major US policy announcements. This suggests the market views blacklisting as a structural issue rather than a negotiable policy threat. If this perception continues, it should influence how we set implied volatility across sector-weighted options. For those involved in the metals and components side of the industry, it’s shortsighted to view this action in isolation. The effects ripple beyond just trade figures. Restrictions on semiconductor parts often disrupt inventory management among third- and fourth-order suppliers, who may not be ready for sudden drops in orders or changes in licensing requirements. Past actions by Mnuchin hint at where internal pressure may shift next. If the Treasury gains more clout, future trade decisions might prioritize economic goals over security concerns, but that is uncertain. Without consensus among top officials, it’s challenging for traders dealing with regulatory policies. When logic diverges at the top, market coherence weakens. As the week progresses, manufacturing data from Guangdong could reveal early responses to these disruptions. We should analyze sentiment through freight and customs data rather than relying solely on state-level statements. It’s also important to watch for changes in exporters with high chip dependency that aren’t captured by main indices, as they are often vulnerable to sudden regulatory shifts. In the coming weeks, speed will be crucial. Our strategy should focus on shorter-term hedges, regularly updating correlation models, and paying close attention to intra-day volume spikes. There won’t be time to adjust when political decisions move faster than bureaucratic announcements. Create your live VT Markets account and start trading now.In April, New Zealand’s Business NZ PMI rose from 53.2 to 53.9.
New Zealand Manufacturing Sector Growth
New Zealand’s Business NZ PMI rose from 53.2 to 53.9 in April, indicating growth in the manufacturing sector. The AUD/USD remains above 0.6400 as the US Dollar weakens due to declining confidence in US trade deals. Focus is now on upcoming US data and comments from the Federal Reserve. The USD/JPY has climbed back towards 145.50, despite weak Q1 GDP figures from Japan. The different monetary policies of the BoJ and Fed also play a role. Markets expect the BoJ to raise rates again in 2025, despite current economic data. Gold prices are having a hard time following a recent recovery from a month-low near the 200-period SMA. A temporary US-China trade truce has eased pressures on the global market, affecting gold.Impact of UK Economic Growth
Bitcoin and Solana have dropped in value as FTX prepares to start the next phase of creditor distributions on May 30. These events continue to influence the cryptocurrency market. The UK economy showed surprising growth in the first quarter, following stagnation towards the end of last year. However, concerns remain about the accuracy of this data and what it shows about the true economic situation. There is a list of top brokers for trading EUR/USD, known for their competitive spreads and fast execution. This list is useful for both beginners and experienced traders, making it suitable for various trading strategies. New Zealand’s Business NZ PMI increase from 53.2 to 53.9 suggests that manufacturing is expanding. A PMI above 50 indicates improving output and that both domestic and export demand may be strengthening. This could lead to more opportunities in NZD-related instruments, particularly where rates and industrial output are significant. In Australia, the AUD/USD holding above 0.6400 highlights the continuing weakness of the US Dollar. This seems driven by global factors rather than local risks. With optimism over US trade talks fading, the Dollar is now more responsive to signals from the Federal Reserve and harder economic data. Should upcoming US numbers, especially on inflation and jobs, fall short of expectations, AUD pairs might rise, though likely with some ups and downs. Currently, US traders appear hesitant, uncertain that the Fed can maintain its strong rhetoric without supporting data. The USD/JPY’s rise towards 145.50 comes as Japan’s Q1 GDP shrank, which lowers domestic confidence but does not deter the Bank of Japan from its current strategy. There remains a significant gap between US and Japanese monetary policy, but markets are starting to consider that the BoJ may gradually move towards raising rates. With investors anticipating a potential hike in 2025, this stabilizes rate-sensitive positions, though any strong data or hawkish comments could quickly shift yen movements. It’s the pace of change, rather than direction, that keeps this currency pair active. Gold’s brief recovery from recent lows points to a broader trend: a decrease in demand for traditional safe havens during reduced tensions. The easing between the US and China, although tentative, has lessened gold’s appeal for now. Nevertheless, prices hovering around the 200-period moving average indicate that traders are awaiting a stronger impetus. If inflation rises again or another shock occurs, interest could rapidly return. Until then, prices will likely remain within a narrow range. In the crypto market, both Bitcoin and Solana dropped as FTX announced plans for a new round of creditor repayments this month. These time-sensitive developments often heighten market anxieties, particularly in an already volatile sector facing regulatory uncertainties. Smaller altcoins are also reacting strongly as traders prepare for potential capital withdrawals related to these repayments, adding more complexity to the overall sentiment. Meanwhile, the UK’s unexpected first-quarter growth after a six-month stall surprised many. However, concerns linger that long-term performance may be inaccurately reported. With constraints in data collection, it’s uncertain if this growth can continue without adjustments. From an interest rate perspective, this will influence how markets view the Bank of England’s policy, especially concerning wage and services inflation. The positioning around GBP may change quickly due to revisions in data. Finally, recent updates on broker rankings for EUR/USD trading focus on execution speed and spread reliability. Algorithmic traders and those using short-timeframe setups could see significant benefits when latency and slippage affect strategy returns. For those looking for multi-day positions, the choice of broker may influence results less, but it still affects rollover costs and fills during volatile periods. This array of cross-market drivers—including activity in the Asia Pacific, metals, cryptocurrencies, and key economic releases—requires flexible strategies. As we approach the end of the quarter, some stories might fade, while others, such as central bank movements and data discrepancies, are likely to create more directional opportunities. Create your live VT Markets account and start trading now.April’s PMI for New Zealand’s manufacturing sector rises to 53.9, indicating growth and recovery
New Zealand’s manufacturing sector made strides in April, with the Performance of Manufacturing Index (PMI) hitting 53.9. This is an increase from March’s 53.2 and marks four months of ongoing growth. The reading is also above the average PMI of 52.5.
All sub-indexes showed growth during this time. The recovery in manufacturing is clear, especially from a low of 41.4 last June. However, there are worries about whether this recovery can last, given some external uncertainties.
Current Performance Overview
A PMI of 53.9 means that New Zealand’s manufacturing sector is not just stable—it is actively recovering. A PMI above 50 indicates growth, so reaching 53.9 (higher than March’s 53.2 and above the long-term average) shows this improvement isn’t temporary. It’s a more profound change. To put it in perspective, last June, the PMI was as low as 41.4, when overall demand and sentiment were weak. Since that point, we have been improving steadily. All tracked sub-indexes—employment, new orders, production, deliveries, and inventories—reported gains. These data points are significant indicators of demand strength and production capacity. Increases across all categories provide a broader picture that is hard to overlook. They suggest demand is not concentrated in just a few areas, as often happens during temporary recoveries. Yet, questions linger about whether this growth can continue into winter. The progress may come from fulfilling delayed orders and international customers rescheduling after earlier disruptions, which could indicate a trailing effect instead of new business. If that’s the case, we might see activity stabilize unless new demand emerges. From a trading perspective, the market will likely focus on whether rising input costs and output prices in this sector will affect overall inflation. If manufacturers begin to pass costs onto consumers—even slightly—that could increase pressure on central banks to maintain tighter policies for longer. This could impact rate expectations.Future Considerations
Leitch, who contributed to the report, noted this tension, mentioning improvements across nearly all manufacturing dimensions. However, sustained improvements are crucial. Positive signs can quickly become misleading if commodity prices or external orders unexpectedly decline in the coming weeks. In this context, we should monitor changes in forward orders or inventory reductions. If manufacturers begin to report weaker future orders, it may suggest that April’s positive results are part of a temporary improvement. Domestic demand conditions are still uncertain. While export orders have driven much of the growth, household spending—especially on items requiring industrial inputs—might not be strong enough to support continued recovery. Bonds have not reacted sharply to the PMI data, indicating that the market is still assessing the reliability of this recovery. While the data is promising, significant shifts in macro positions are unlikely unless factory data shows consistent upward revisions over a second quarter. This will only happen if increased production leads to more employment and wage growth, which in turn fuels discretionary spending. In future sessions, we will keep an eye on input price indices from regional surveys for early signs of margin strain and delivery times. Changes here may signal either weak or constrained demand. A decline in these times would suggest smoother supply chain operations, possibly due to a decrease in demand. The key takeaway? Strength in manufacturing allows for more confident investments in industrial, transport, and production-related assets. But this confidence hinges on the rise of forward-looking indicators, especially new domestic orders, in upcoming reports. Without these, April’s numbers are more about recovery than growth. Create your live VT Markets account and start trading now.White House announces series of investment agreements in AI and energy with the UAE
The Trump administration has revealed several deals, mainly with the United Arab Emirates (UAE). However, many of these agreements appear to have been established before January, and the details surrounding them are unclear.
The deals include an “AI acceleration partnership agreement” with the UAE and a project involving OpenAI and Saudi Arabia for large data centres. President Trump claims he has “secured” almost $200 billion in agreements with the UAE, but specifics are missing.
Agreements and Partnerships
One notable agreement is between Amazon Web Services and the UAE Cybersecurity Council for a “sovereign cloud launchpad.” However, it seems the Trump administration may not be fully aware of its development. Additionally, Raytheon, Emirates Global Aluminium, and Tawazun Industrial Park are together working on a gallium minerals deal for a drone interceptor project. Other agreements include collaborations among Boeing, GE Aerospace, and ExxonMobil with UAE companies. The UAE aims to invest $4 billion in an aluminium project in Oklahoma, linked to earlier US business investments. However, clear timelines or explanations for these large financial commitments are not available. While the administration has made broad claims about the scale and value of these Middle Eastern agreements, a closer look shows that many of these claims are recycled or poorly defined. Agreements, like the one with the UAE on artificial intelligence or the infrastructure projects with Saudi Arabia, do not have detailed frameworks or deadlines. Some partnerships mentioned, such as those involving OpenAI or Amazon, might have started before the current administration’s discussions. They seem more like repackaged efforts than new initiatives. The nearly $200 billion figure highlighted by Trump as a major diplomatic and economic success does not correspond to any verifiable commitments. Announcements often lack supporting details, budgets, or legislative backing. This leaves room for ambiguity, particularly for those depending on stable asset flows or confirmed timelines. One noteworthy example is the partnership between Raytheon, Emirates Global Aluminium, and industrial firms in Abu Dhabi around gallium-based materials for drone defense projects. Gallium isn’t widely traded, but it holds strategic importance due to the rising global demand for advanced technologies. This raises questions about future supply chain effects and potential impacts on industrial metal prices. The military use of these materials for drone interception adds another layer, but without clear sourcing and timing details, market effects remain uncertain.Potential Market Impact
We see a similar trend with major American aerospace and energy companies like Boeing, GE Aerospace, and ExxonMobil entering agreements with Emirati firms. There is some logic in these cross-border collaborations, given their history of joint investments. However, formal disclosures are limited. For instance, ExxonMobil’s role in any related projects is not clearly outlined, making it tough for traders to make informed decisions based on logistics, costs, or energy supply. The $4 billion plan for aluminium production in Oklahoma seems to be the most concrete mention. This could affect the US light metals market, especially if it aligns with rising electric vehicle production or domestic infrastructure needs. Without timelines or permitting information, predicting demand based on this alone would be premature. Depending on the progress of state or federal approvals, construction inputs could change the valuation of building materials and machinery futures. Timing is crucial, and delays could lead to fluctuations in contracts for raw materials. So far, no agreement has resulted in comprehensive regulatory documentation or Congressional review. This leaves us relying on informal references from press releases and interviews. Consequently, any financial exposure based solely on these announcements carries a significant risk of being driven by perception rather than solid deal flow. There is potential in some areas—especially in advanced technologies and aerospace—but until these are backed by concrete numbers and legal documents, caution is advised when entering trades. In upcoming sessions, it may be more beneficial to pay attention to earnings guidance from listed companies and investor reports. If these ventures are substantial, they will show up in future statements or SEC filings. For now, speculation based on isolated announcements, lacking clear milestones or financial frameworks, could result in short-term mispricing. We recommend keeping a cautious approach and light positions until these stories transform into confirmed investment plans or reliable industry data. Create your live VT Markets account and start trading now.Australia’s Trade Minister hesitant to join the US in trade conflict with China
Australia is cautious about backing a US-led trade initiative against China, according to Trade Minister Don Farrell. He highlighted the significance of trade with China, noting that Australian exports to China are nearly ten times higher than those to the US.
China is Australia’s largest trading partner. The country aims to strengthen ties with China instead of cutting them. Farrell emphasized that any decisions regarding engagement with China will prioritize Australia’s national interests over US demands.
Economic Considerations
Farrell is clearly distinguishing between Australia’s economic goals and external diplomatic pressures. Trade with China is far more important for Australia than trade with the US. The Minister pointed out that exports to China are about ten times greater than those to the US, marking a significant gap that can’t be overlooked, especially given Australia’s reliance on resource exports. While Farrell isn’t outright rejecting US requests, he is showing a clear preference. He indicates that Australia won’t take actions that could disrupt trade with China. Choosing sides in international trade disputes, especially those involving retaliation or restrictions, poses risks that could be damaging to the economy. This situation is important to note. It introduces caution into global trade, especially across the Asia-Pacific region. When a major exporter like Australia takes a careful stance, it could influence future trade actions. This isn’t a rejection of diplomatic alliances, but a clear message that maintaining domestic stability and trade security is a priority. Traders involved with commodities or regional currencies should stay vigilant. Any markets dependent on Australian resources—like iron ore or natural gas—might show increased short-term stability if the relationship between China and Australia remains strong or improves. This means that volatility from Washington’s news may not impact these assets as directly as expected.Potential Market Impacts
In practice, this suggests that trade flows could remain steady, and prices may respond more to local supply-demand rather than geopolitical events in the short term. If you have investments affected by bilateral tensions, it could be wise to reassess your assumptions. It’s likely that other nations in the region might adopt similar views soon, which would help prevent trade disruptions from spreading. Furthermore, Farrell’s statements hint at stability for those invested in Australian markets. If Australia maintains this position, strategies for hedging might need to be adjusted, as Canberra is unlikely to support blockades or restrictions, even under pressure. We should continue to monitor responses from other ministers or similar economies. While patterns may not always repeat, they often provide guidance for future decisions. Create your live VT Markets account and start trading now.Gold prices surged significantly due to weak US data, geopolitical tensions, and declining yields.
Gold prices jumped significantly to $3,228, up from a weekly low of $3,120. This 1.40% increase was mainly due to a weaker US Dollar, following unexpected US Producer Price Index (PPI) data and declining US bond yields.
Recent US economic reports showed that the PPI fell by 0.5% month-over-month in April, while Retail Sales rose slightly by 0.1% month-over-month. Jobless claims remained steady at 229,000, meeting estimates.
Market Response to Economic Data
The market quickly reacted, with fixed-income sectors adjusting to expectations of Federal Reserve interest rate cuts in 2025. Ongoing political tensions between Russia and Ukraine also fueled gold’s price increase. From a technical perspective, gold could face a drop if it cannot stay above $3,200. A close above $3,257 may support an upward trend, but falling below $3,200 could see prices drop to $3,100. Central banks continue to buy gold, viewing it as a safe investment and a hedge against inflation. Gold prices are affected by geopolitical instability and changes in the US Dollar, showing an inverse relationship with US Treasuries and other risk assets. Gold’s rise to $3,228, recovering from a dip to $3,120, showed a weekly 1.40% gain in response to new US economic data. The surprising -0.5% drop in the PPI for April contrasted with a slight 0.1% increase in retail sales for the same month. Weekly jobless claims remained unchanged at 229,000, matching expectations. Together, these factors weakened the US Dollar and lowered bond yields, leading investors to rethink interest rate forecasts. Quickly adjusting, fixed-income markets began pushing back expectations for Federal Reserve rate cuts to 2025. Lower yields on US Treasuries and a softer dollar made gold more attractive, especially due to rising geopolitical tensions in Eastern Europe.Technical Perspective on Gold Price Levels
Technically, gold is nearing a critical point. The $3,200 level is crucial for short-term trends. Staying above this level could lead to more upward movement. If gold can close above $3,257, it may unlock further gains. Conversely, if it cannot hold above $3,200, drops as low as $3,100 could occur, where previous buyers have shown interest. Another important aspect affecting gold demand is central bank activity. These institutions continue to accumulate gold, reinforcing its status as a defensive investment during times of uncertainty with fiat currencies or inflation. Their buying creates long-term support, separate from speculative influences. It’s also important to note the relationship between gold, the US Dollar, and Treasury yields. When yields drop—often due to expectations of a less active central bank—gold tends to benefit. Additionally, if the dollar weakens, as it did after the recent PPI announcement, gold typically rises. Sustained political tensions often increase the demand for gold as a store of value. A more unstable geopolitical situation could lead to greater defensive asset positioning, resulting in higher prices for safe-haven investments like gold, which carries less counterparty risk. As the market adjusts to potential shifts in policy, and with real yields reacting to short-term data, we can expect sharp responses to even minor data releases. Weekly updates on inflation or employment may lead to noticeable changes in expectations and prices for rate-sensitive assets. Staying flexible and attentive to key technical and macroeconomic levels will be crucial during this potentially volatile time. Tracking price movements above or below key thresholds will likely influence short-term strategies in the coming quarter. Create your live VT Markets account and start trading now.Gold Softens As Diplomatic Progress Dents Safe-Haven Appeal
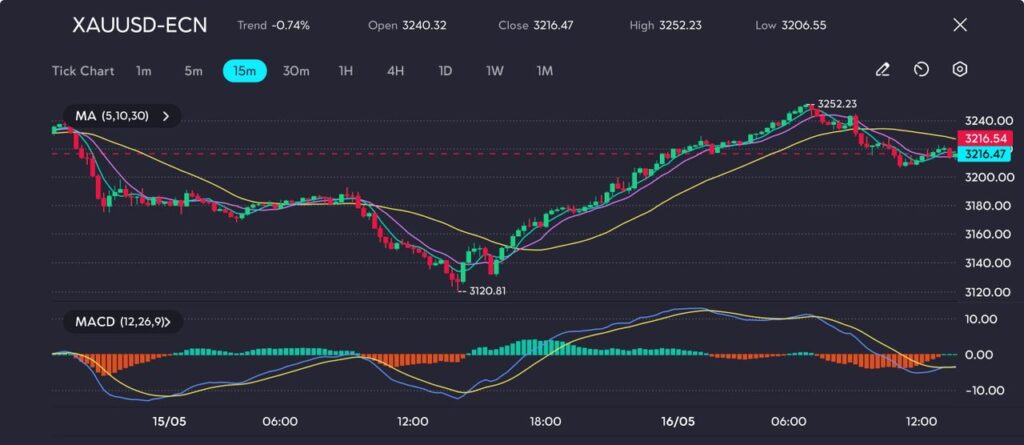
Gold prices slipped to $3,216 per ounce on Friday, pressured by diminished demand for safe-haven assets as global sentiment improved in response to several diplomatic advances. The precious metal is heading for a weekly decline of over 3%, having retreated from an earlier session high of $3,252.23.
The principal catalyst for the pullback was a temporary thaw in trade relations between the United States and China, with both nations agreeing to suspend tariffs for 90 days. This gesture eased investor concerns over the potential economic fallout from extended protectionist policies, at least in the near term.
Other geopolitical flashpoints appear to be stabilising, adding to the pressure. A ceasefire between India and Pakistan remains intact, and although peace negotiations between Russia and Ukraine have stalled, they have not sparked renewed flight-to-safety behaviour in the markets.
Nonetheless, the macroeconomic backdrop remains broadly supportive of gold. Recent US inflation data came in softer than expected, strengthening the case for the Federal Reserve to commence interest rate reductions, potentially twice before the year’s end. Markets are currently factoring in 50 basis points in rate cuts, possibly starting as early as July.
However, Federal Reserve Chair Jerome Powell urged caution in his latest remarks, warning that inflation may become increasingly erratic due to continued supply-side disruptions. This uncertainty could make it more difficult for central banks to maintain price stability and, in turn, renew investor interest in gold as a hedge against monetary policy volatility.
Technical Analysis
Gold prices initially extended their rebound, surging from a session low of 3120.81 to test resistance at 3252.23 before retreating. The strong upside move was supported by a bullish MACD crossover and upward momentum through the 5-, 10-, and 30-period moving averages on the 15-minute chart. However, the rally lost steam just below the 3260 mark, where sellers re-entered the market.
Following the peak, bearish pressure set in, sending gold back below the 30-period MA and prompting a corrective pullback toward the 3215 area. The MACD histogram has flattened, and the signal lines are converging, suggesting the rally may be pausing. Immediate support lies around 3206, while resistance remains firm near 3250. A break below 3200 could open the door to 3180, whereas a bullish resurgence above 3252 would revalidate the uptrend.
Cautious Outlook
In the short term, gold may struggle to regain its upward momentum amid improving risk appetite and subdued inflationary pressures. That said, lingering geopolitical uncertainties and evolving monetary policy expectations continue to provide underlying support. Any setbacks in trade discussions or renewed volatility in inflation could revive demand for gold as a defensive asset, with the $3,160 level likely to act as a key floor.
Create your live VT Markets account and start trading now.


