JP Morgan revises prediction for ECB’s next rate cut to September
JP Morgan has changed its forecast for the European Central Bank’s (ECB) interest rate moves. The bank now expects the next rate cut to happen in September instead of the previously predicted July.
The ECB’s next policy meeting is on July 24, 2025, and it could have an impact on future economic decisions.
Dividend Adjustment Notice – Jun 06 ,2025
Dear Client,
Please note that the dividends of the following products will be adjusted accordingly. Index dividends will be executed separately through a balance statement directly to your trading account, and the comment will be in the following format “Div & Product Name & Net Volume”.
Please refer to the table below for more details:
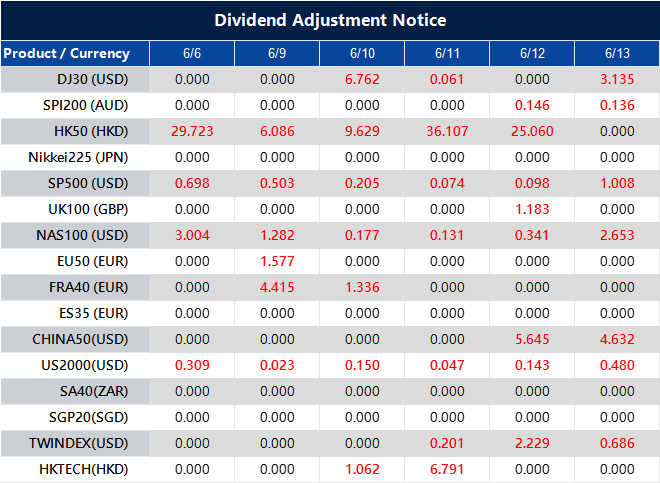
The above data is for reference only, please refer to the MT4/MT5 software for specific data.
If you’d like more information, please don’t hesitate to contact [email protected].
Lagarde’s video address in Marseille provides little encouragement for traders about interest rates
European Central Bank President Christine Lagarde will give a video message this Friday at an event in Marseille, France. This event celebrates the 75th anniversary of the International Confederation of Popular Banks.
On Thursday, Lagarde discussed the ECB’s choice to lower key rates by 25 basis points, which was expected. She highlighted a slowdown in the services sector and pointed out that the easing cycle may be coming to an end.
Recent reports from the ECB show that most members of the recent meeting preferred to keep rates steady in July. Officials expect that rate cuts may be paused in the following month.
Lagarde’s comments indicate a changing approach that has been developing over time. Although the rate cut this week was anticipated, the noteworthy aspect was the hint that the push for more reductions might be weakening. By mentioning the slowdown in the services sector, she recognized that an area previously seen as stable is now showing signs of weakness.
The meeting minutes and subsequent interviews suggest that policymakers are adopting a cautious wait-and-see strategy. This highlights that they are more focused on ongoing inflation than on fragile growth. Inflation remains stubborn in certain areas of the economy. This is why the message was not about a steady decline in rates, but a clear intent to pause.
During the recent ECB meeting, the consensus was to keep rates unchanged in July. This isn’t speculation; it comes from a summary provided shortly after the meeting. Notably, even those open to future rate cuts emphasized the need to wait for more data on wages and profit margins expected later this summer. There is a growing desire for stronger confirmation before making any decisions.
For those managing short-term positions, the clarity about July reduces uncertainty. However, the focus now is less on the upcoming meeting and more on being flexible for developments in September. Volatility may return around that time, especially if wage trends don’t improve. Following Lagarde’s remarks, forward rate markets showed a slight tightening in expectations for further cuts this year.
Traders should view the ECB’s shift not as a reversal, but as a cautious step back after testing the waters. Exposure to summer meetings should be limited, as most of the Governing Council members seem unwilling to make new commitments. With mixed growth signals and persistent inflation in services and energy, the balance of risks has shifted towards caution.
While headline inflation has decreased, core inflation remains resilient. This is where the current debate lies—beneath the surface. In the upcoming weeks, the risks are more about surprises from wage or margin updates rather than from central bank statements. The little forward guidance left is now more reactive than proactive.
When considering pricing spreads and strategies for contracts related to the euro area, it’s time to adjust expectations toward longer pauses instead of steady reductions. The current situation does not signal a return to neutrality anytime soon. We see more value in having options rather than making directional bets through July and early August. This highlights the reluctance to make moves without new supporting evidence.
Musk acknowledges better relations with Trump in a tweet, boosting US equity futures
US equity index futures rose when evening trading on Globex began. This increase is linked to reduced tensions, highlighted by a Twitter exchange between Musk and Ackman.
Their conversation indicates a move toward unity. The market reacted positively, showing an optimistic outlook after their dialogue.
US Equity Index Futures Show Strong Recovery
US equity index futures experienced a strong recovery as evening trading on Globex resumed. This rise was primarily driven by a decrease in geopolitical and market tension. The online exchange suggested a brighter outlook. Musk and Ackman shared views through a brief social media discussion that the market interpreted as unifying, easing previous divisions. Traders clearly saw their exchange as a positive sign, shifting from earlier caution to optimism. With this context, derivative traders should note the significant influence that high-profile comments can still have on the market—especially concerning broader economic sentiment or public opinion. While key fundamentals haven’t changed overnight, the market’s reaction indicates traders may be more attuned to emotional and narrative-driven signals from prominent figures. This is important, particularly since short-term implied volatility has reacted sensitively to symbolic gestures recently. Given the quick rebound in futures, implied volatility may not stay stable if similar messages continue to emerge. The volatility skew and term structure may respond accordingly, especially if options traders see renewed optimism as a reduction of downside risk. We believe shorter-term index options could be at risk of sharp price changes, as confidence grows without significant data releases or policy updates supporting it.High-Profile Comments and Their Impact
When entering spread trades or directional positions, it’s wise to rely on recent market moves. Trading activity is significantly influenced by behavioral cues rather than clear macroeconomic changes. If you hold positions based on the implied levels from yesterday, reevaluate your delta and gamma exposure immediately—volatility positioning is reacting more strongly than usual when sentiment shifts rapidly. Moreover, Ackman’s public engagement adds an unpredictable factor. Although it’s not policy, his discussions attract attention and can quickly shift sentiment. For derivative traders, this presents both short-term opportunities and risks—cheap upside options could adjust rapidly, especially for indexes closely linked to momentum. Musk consistently maintains a market-moving influence through his ventures and commentary. When he collaborates with figures like Ackman, we anticipate that sectors related to innovation and technology will see increased speculative call buying. Watching delta hedging activity around these names in the coming sessions could offer early signals for further upward movement—provided purchasing isn’t driven solely by retail investors. The best strategy now is to seek secondary confirmation. If trading volume increases with the upward movement rather than fading, short volatility structures may require quick adjustments. On the other hand, if the activity is mainly just thin relief overnight, reversion trades could still be appealing, depending on institutional flows during full US trading sessions. Early indicators typically arise from shifts in liquidity at key options strikes. In conclusion, the market is reacting not only to news but also to cues from prominent players. If these cues persist, managing gamma with more flexible strategies—especially using calendars or diagonals—could be beneficial. Stay prepared for significant reactions to seemingly minor shifts in sentiment from influential figures. Create your live VT Markets account and start trading now.PBOC sets USD/CNY reference rate at 7.1845, lower than expected 7.1935
The People’s Bank of China (PBOC) determines the daily midpoint for the yuan, known as the renminbi or RMB. It employs a managed floating exchange rate system, which allows the currency to move within a +/- 2% band around this midpoint.
Yesterday, the closing rate for the yuan was 7.1790. The PBOC injected 135 billion yuan into the market through seven-day reverse repos at an interest rate of 1.40%.
Today, 291.1 billion yuan is set to mature, resulting in a net withdrawal of 156.1 billion yuan. This adjustment shows the PBOC’s ongoing efforts to manage liquidity in the financial system.
Recent Actions by the PBOC
This article discusses recent actions of China’s central bank, the People’s Bank of China (PBOC), in managing the yuan’s exchange rate and liquidity levels. The daily midpoint serves as the reference rate for the yuan, allowing it to move within a two percent band on either side. If the currency strays too far from this range, the central bank can intervene using various tools. The yuan closed at 7.1790 yesterday, close to the upper limit of the trading band. This offers direction for funding positions or short-term hedging. On the liquidity front, the PBOC injected 135 billion yuan through seven-day reverse repurchase operations, which are basically short-term loans to banks, at an interest rate of 1.40%. While this is a low cost for borrowing, the real focus is on what matures today—291.1 billion yuan—leading to a net withdrawal of 156.1 billion yuan from the financial system. This move highlights the PBOC’s commitment to managing liquidity without overextending it. The current net outflow suggests a preference to ease funding pressure, which could help regulate yields or stabilize the currency. Zhou, overseeing the interest rate mechanism, seems to be signaling through shorter loan durations rather than extending maturities. The frequent use of seven-day reverse repos indicates a careful approach instead of a drastic liquidity boost, hinting at a “wait-and-see” strategy.Interpreting the PBOC’s Moves
From a risk perspective, this means we should be cautious about viewing the PBOC’s actions as overly accommodative. While liquidity remains available, the net drain suggests the central bank is gently pulling back on cash flow. Traders with leveraged positions sensitive to short-term funding costs should be mindful of rollover risks. A reduced liquidity cushion, even intentionally, can magnify the effects of minor shifts in repo financing or swap spreads in the coming sessions. In foreign exchange, the yuan’s position near its upper trading limit increases the chances that the PBOC will implement measures to push it back toward the midpoint. There’s often a strong link between liquidity changes and currency stability, so a net cash drain occurring simultaneously with the yuan’s upper limit suggests coordinated actions to manage market sentiment. This week, currency volatility should be monitored closely. Even small changes in onshore and offshore rates could increase hedging costs, particularly for non-deliverable forwards. Keeping a close watch on central parity levels in the next few days may provide insights into the PBOC’s acceptable thresholds before more aggressive actions are taken. With the current situation—net withdrawal, currency near its upper range, and no signs of long-term intervention—there’s little room for complacency. Those with short-term derivative positions should avoid simply applying past policies. The pace of adjustments indicates shorter response times and a lack of patience if currency pressure increases. We see this as an important moment to closely examine carry risk. Small tweaks in repo operations, combined with a high yuan value, may lead to quicker-than-expected movements in spot and swap spreads. As always, it’s vital to pay attention to pricing shifts in options during weeks like this, as they may adjust faster than current spot prices suggest. Create your live VT Markets account and start trading now.Modifications on All Shares
Dear Client,
To provide a favorable trading environment to our clients, VT Markets will modify the trading setting of US Shares on June 9, 2025:
1. All US Shares products leverage will be adjusted to 33:1 .

2. 20 Premarket US shares on MT5: Leverage will be 5:1 during 14:00-16:30 and 22:45-23:00 ; and remain 33:1 during the rest of the trading time.
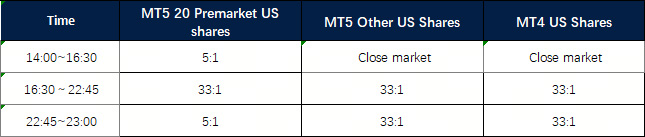
3. MT5 20 pre-market US stocks: TSLA, NVIDIA, NFLX, META, GOOG, AMAZON, AAPL, ALIBABA, MSFT, SHOP, BOEING, IBM, BAIDU, JPM, EXXON, INTEL, TSM, MCD, ORCL, DISNEY.
The above data is for reference only, please refer to the MT4 and MT5 software for specific data.
Friendly reminders:
1. All specifications for Shares CFD stay the same except leverage during the mentioned period.
2. The margin requirement of the trade may be affected by this adjustment. Please make sure the funds in your account are sufficient to hold the position before this adjustment.
If you’d like more information, please don’t hesitate to contact [email protected].
PBOC expects USD/CNY reference rate of 7.1935 for the yuan, according to Reuters
The People’s Bank of China (PBOC) sets the daily midpoint for the yuan (renminbi) against a mix of currencies. This involves looking at market supply and demand, economic indicators, and currency market changes. The PBOC uses a managed floating exchange rate system that allows the yuan to change within a specific range.
Each day, the PBOC determines a midpoint for the yuan, mainly in relation to the US dollar. This midpoint serves as a reference for trading. The yuan can move within a trading band of +/- 2% around this midpoint, allowing it a maximum fluctuation of 2% in a day.
PBOC’s Market Intervention
To keep the market stable, the PBOC can step in when the yuan approaches the edges of its trading band. This intervention involves buying or selling yuan to maintain a steady currency value. This way, the PBOC retains control over the yuan’s value while taking into account economic conditions and policy goals. In simple terms, every morning, the People’s Bank of China sets a basic rate for the yuan. This rate is grounded in previous market activity, global influences, and domestic indicators. Although the system allows for some changes, they occur within a narrow band. This limitation is not random; it helps the authorities manage the currency without completely surrendering to market forces. When there is excessive fluctuation or the yuan hits the limits of its range, officials intervene. They either sell or buy the yuan to keep it from moving too far in either direction. These actions are not just about the yuan’s price but also aim to achieve larger goals like controlling inflation and enhancing trade competitiveness. The system aims to create stability while maintaining a level of flexibility. This setup results in a market environment where predictability and control coexist. This is crucial for anyone trading or hedging based on currency movements. A defined range for daily fluctuations changes how opportunities and risks are perceived. This is different from a fully floating currency, where swings can be sharper and decisions are influenced more by market sentiment.Market Reactions And Strategies
The daily midpoint serves as a guiding point at the start of each trading session. Traders and analysts keep a close eye on this value since it influences daily trading decisions. Once the midpoint is established, the pricing of options, forward contracts, and swap spreads quickly adjust according to it. The 2% band limits sharp price movements, affecting volatility assumptions and risk levels. Recently, the market has tested the edges of this band, indicating some underlying pressure. While this doesn’t mean the band will break soon, it does suggest that traders are becoming more cautious. Some are even adjusting their implied volatility models downwards due to increased predictability. Others are using structured products around the band edges to capture sudden shifts while keeping costs low. More importantly, we’ve observed how the central bank acts near critical points. Each time the yuan rises toward the upper band, the PBOC nudges it back through indirect intervention. While this might not be reflected in official data for a while, intraday price movements and spot-futures spreads often show these trends. It’s also important to note that skew patterns in USD/CNH options have gradually favored a stronger yuan. This trend is likely due to fiscal policies or signals conveyed through midpoint fixings. Those betting on yuan depreciation have recently found it more challenging. Therefore, it’s wiser to make trades based on limited movements rather than assuming high volatility. In the upcoming sessions, it makes sense to shift away from chasing specific market directions and focus on range strategies. Strategies like butterfly spreads and laddered accumulators can effectively exploit slightly restricted swings. These trades benefit from stability without relying on complete stillness. Current implied volatility is low compared to historical levels, presenting opportunities if priced rightly. This currency protocol serves as both a guide and a boundary. By understanding its patterns, we can refine our forecasts and exposure. Where the midpoint heads next often sets the course for the rest of the week. Create your live VT Markets account and start trading now.Tesla Plunges 14% Following Musk–Trump Fallout
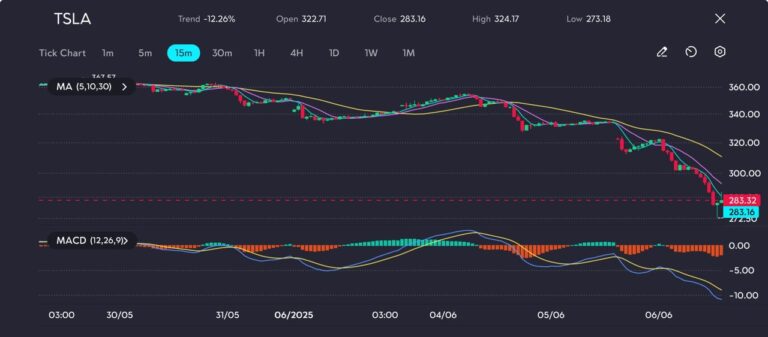
Tesla shares suffered a dramatic breakdown on the charts, with the decline reflecting more than just headlines — markets reacted to the potential for a broader shift in federal backing. The stock slid sharply through every major support level, bottoming at an intraday low of $273.18 and marking its steepest single-day fall since September 2020.
A public spat between Elon Musk and US President Donald Trump sparked the drop. Trump accused Musk of lacking loyalty and profiting excessively from electric vehicle regulations, prompting Musk to respond by claiming he played a pivotal role in Trump’s 2024 campaign success. Musk also hinted at retaliatory measures involving his business interests, including NASA-affiliated operations at SpaceX.
While analysts at Wedbush described the market reaction as “driven by emotion but not irrational,” they emphasised that federal contracts tied to SpaceX and Tesla’s energy division represent significant long-term revenue. If political tensions lead to policy shifts, the underlying business risks could increase substantially.
Technical Analysis
Tesla (TSLA) has experienced a sharp decline in recent sessions, dropping over 12% from highs near $324 to lows around $273 before settling near $283. The 15-minute chart reveals strong bearish momentum, as indicated by all three moving averages (MA 5, 10, 30) sloping decisively downward with significant separation between them. This alignment signals sustained selling pressure and a lack of near-term recovery strength.
The MACD further supports this bearish outlook, remaining firmly negative with no crossover in sight. The histogram bars continue to print red, underscoring the persistent downward momentum. Price action shows a minor rebound from the $273 level, suggesting this zone may be emerging as short-term support. However, without a clear reversal pattern or bullish divergence on the MACD, the recovery appears weak. Resistance is now expected near the $300–$310 range, and unless buying volume returns decisively, TSLA may remain vulnerable to further downside.
Cautious Outlook
The next 48 hours could define the trajectory of this feud — and Tesla’s recovery. A cooling of rhetoric may lead to a relief rally, but if the spat worsens and federal contract scrutiny intensifies, further downside pressure cannot be ruled out. Traders should watch for volatility clusters and regulatory responses as this saga unfolds.
U.S. officials cause confusion and stall Japan trade talks due to internal conflicts
Tariff talks between the U.S. and Japan are facing difficulties because three senior U.S. officials have different views. Treasury Secretary Scott Bessent, Commerce Secretary Howard Lutnick, and Trade Representative Jamiesol Greer each have unique ideas about trade, which is complicating the discussions.
This disagreement has confused Japanese negotiators who are trying to grasp the U.S. administration’s position. Recent meetings showed tensions, as the U.S. team had to pause discussions to deliberate among themselves.
This situation reveals a notable lack of unity in the U.S. delegation, a crucial part of the negotiations. Normally, clear communication helps international trade talks. However, in this case, each U.S. official brings their own perspective, making it hard for the Japanese to understand. They have to interpret not only the words but also the tone and shifts in emphasis. Instead of receiving a clear message, the Japanese face a situation where policy direction seems uncertain. In a previous meeting, this internal conflict even halted discussions temporarily, forcing negotiators to guess where decisions might come from.
So, what does this mean for those of us working on pricing and hedging strategies? For now, we’re not reacting to formal policies. Instead, we’re seeing delays and potential reversals. Trade announcements may not be straightforward, and markets could misinterpret early signals due to the lack of clear direction. It’s becoming more important to track which internal voice gains influence rather than just focusing on official statements.
We expect hesitance among market players in sectors like auto manufacturing, agri-business, and shipping. These sectors typically shape their forecasts, purchases, and staffing based on milestones in trade talks. If these milestones are now uncertain, making timely decisions is more difficult. Options that seemed appealing weeks ago might now be overpriced, while short- to medium-term positions may require a change in strategy. The gap between implied and realized volatility could create chances, although current market conditions make it hard to tell if discrepancies are due to political issues or regular quarter-end happenings.
We recommend reviewing hedging thresholds that may have relied too heavily on a smooth progression of the talks. Expect more stops and starts, especially if one group gains dominance only to pull back soon after. This is especially true for commodities linked to agriculture or technology, which remain sensitive in this environment.
Conflicting goals from high-level officials can confuse counterparties and impact markets, especially when liquidity is limited. We’ve already noticed wider bid-ask spreads for instruments related to future trade volume between the U.S. and Japan. These spreads are unlikely to narrow until we see more consistent policy direction.
Price movements will likely remain volatile around scheduled remarks. Based on past experience, even spontaneous media comments can significantly influence futures and swap spreads. This creates both opportunities and risks that we shouldn’t overlook when adjusting VaR limits or evaluating forward contracts tied to clearance times or changing customs rules.
We’re dealing with more than just miscommunication; it’s indecision. We should prepare for this uncertainty to continue.
Japan is changing its approach to U.S. auto tariffs by proposing flexibility based on contributions.
Japan is changing its stance on the 25% U.S. auto tariff. Instead of asking for its complete removal, Japan is proposing a flexible plan. This plan would lower tariffs based on how much a country contributes to the U.S. auto industry.
The idea comes from Japan’s chief tariff negotiator, Ryosei Akazawa, who is in Washington for trade discussions. The proposal links tariff relief to metrics such as the number of vehicles made by Japanese automakers in the U.S. and their global exports. Akazawa is in talks with senior U.S. officials, including Treasury Secretary Scott Bessent and Commerce Secretary Howard Lutnick.


