Sweden’s industrial production value rose 5.1% in December, reversing a 0.1% decline in November
Sweden’s industrial production value rose 5.1% month on month in December. This followed a -0.1% change in the previous month.
The December release shows a strong 5.1% month-on-month rise in industrial output. This is a clear rebound from November’s slight decline. We see this as a bullish signal for the Swedish economy that the market may not be fully reflecting yet. It could be a near-term catalyst for gains in Swedish assets.
This strength also suggests the Swedish Krona (SEK) may be undervalued, especially versus the euro. With the Riksbank focused on its 2% inflation target, stronger growth reduces the case for near-term rate cuts. We would consider buying SEK call options or selling EUR/SEK futures, looking for a move toward 11.10 (a level last seen in late 2025).
In equities, the data is supportive for the industrial-heavy OMXS30 index. Large components such as Atlas Copco and Volvo could see earnings expectations revised higher. We see value in OMXS30 call spreads, targeting a 3–5% rally before the end of Q1.
The report also affects rates. A stronger economy could push the Riksbank to sound more hawkish. Swedish 10-year government bond yields, recently steady around 2.5%, could move higher. Shorting Swedish bond futures could work either as a hedge or as a standalone trade.
A result this far above expectations can also lift volatility. Implied volatility on OMXS30 options has been near 15%, which now looks too low. To position for higher uncertainty, we can buy straddles on key industrial companies that are about to report earnings.
UOB analysts say EUR/USD looks overbought after a sharp rally but could rise to 1.1945 before consolidating
UOB analysts said EUR/USD jumped sharply and is now overbought on an intraday basis. They added that the pair could still rise toward 1.1945 before it starts to consolidate.
Over the next 1–3 weeks, UOB expects more upside if EUR/USD posts a daily close above 1.1945. If it does, the next target is 1.1980.
Support is at 1.1840. UOB said the bullish view stays valid as long as the pair holds above 1.1840.
The article says it was made with help from an artificial intelligence tool and reviewed by an editor. It is credited to the FXStreet Insights Team.
This looks like a setup we have seen before, similar to 2025, where momentum built for another push higher in EUR/USD. Recent data showing Eurozone core inflation holding at a firm 2.2% last week supports this bullish bias. In contrast, the latest US wage growth cooled a bit more than expected, which may mean the Federal Reserve has less need to stay hawkish.
For traders, this points to positioning for a move toward the 1.1980 target from last year’s analysis. One direct way to trade a possible breakout is to buy call options with a strike just above the key 1.1945 level, such as 1.1950, with March expiration. This gives upside exposure while limiting the maximum loss to the premium paid.
Because the rally has been sharp and may be overbought, a more cautious approach could be a bull call spread. For example, buy a 1.1900 call and sell a 1.2000 call. This reduces the upfront cost. It still benefits from a rise, but it helps if the move stalls before a larger breakout.
The 1.1840 level should be watched closely as major support. A clear break below it would suggest the bullish momentum has failed, and any long positions should be reviewed, reduced, or hedged. This was the key “line in the sand” in 2025, and it remains the main defensive level today.
Looking back to the fourth quarter of 2024, similar overbought signals led to a short pause of about two weeks before the uptrend continued strongly. That history suggests that a period of consolidation below 1.1945 does not automatically mean the trend is broken. It may simply be the market pausing before the next leg higher.
EUR/JPY slips below 185.00 as the yen strengthens after Takaichi’s election win, signalling possible consolidation ahead
EUR/JPY slipped toward 185.00 in early European trading on Tuesday. The Japanese Yen strengthened after Prime Minister Sanae Takaichi won Japan’s snap election on Sunday.
The ruling Liberal Democratic Party won 316 of 465 seats in the lower house. This is the first time a single party has won a two-thirds majority since World War II.
Focus is now shifting to fiscal policy, including discussions about cutting sales tax on food. Markets are also asking how new spending plans, including defence spending, would be funded.
Japan’s government is expected to submit its nominee as early as February 25. The nominee must be approved by both the lower and upper houses of the National Diet.
The Finance Minister said the government wants to pass next year’s budget and tax reform as soon as possible. These developments could influence future currency moves.
On the daily chart, EUR/JPY is holding above the 100-day EMA at 180.62. The RSI is 54 (neutral), and Bollinger Bands are narrowing slightly.
Resistance sits at 186.28, near the upper band. Support is at 184.37, near the middle band, followed by 182.46 at the lower band.
EUR/JPY is stabilising near 185.00 after the yen’s brief jump following the LDP’s election win. With the RSI neutral at 54 and Bollinger Bands tightening, the pair may be entering a consolidation phase. That points to smaller near-term price swings.
If volatility stays low, some traders may look at strategies that benefit from calmer markets. One-month implied volatility has dropped to around 7.5%, which can make option-selling strategies more appealing. An iron condor, with strikes placed outside the near-term support and resistance levels of 184.37 and 186.28, could work over the next couple of weeks.
That said, the longer-term picture still leans toward yen weakness if the new government pushes more expansive fiscal policies. A similar pattern appeared in 2025, when early yen strength faded after investors began pricing in the impact of higher government spending. This backdrop supports a bullish EUR/JPY view over the coming months.
Low volatility can also create a chance to position for a later move higher. Longer-dated call options (for example, April or May expiries) may be cheaper while implied volatility is depressed. This approach targets upside while keeping the initial cash outlay limited.
One key date is February 25, when the government is expected to submit its nominee. This could bring volatility back into the market, so it may be wise to close short-volatility trades before then. As the date approaches, uncertainty often lifts option prices.
On the euro side, recent Eurozone inflation printed slightly above expectations at 2.3%. That supports the European Central Bank’s steadier stance. This contrast—potential fiscal expansion in Japan versus a watchful ECB—adds support to the broader bullish case for EUR/JPY.
Dutch manufacturing output rose 0.5% in December after a 0.5% decline in November
The Netherlands’ manufacturing output rose 0.5% month on month in December. In the previous month, output fell 0.5%.
This is a 1.0 percentage point swing from the prior month. The latest figure shows output increased compared with the previous month.
December Dutch Manufacturing Surprise
The unexpected 0.5% rise in Dutch manufacturing output in December 2025 challenges the idea of a broad industrial slowdown seen last year. This stronger-than-expected reading, instead of a decline, suggests some parts of the Eurozone economy still have momentum. We see this as a possible early signal for the wider region. Combined with the January 2026 Eurozone inflation reading of 2.8% (slightly above expectations), this could push back the timing of expected ECB rate cuts. German IFO sentiment was weak through late 2025, but this Dutch strength gives more-hawkish ECB members an argument for keeping policy tighter for longer. As a result, we may need to reassess how markets are pricing rate changes later this year. For equity traders, this supports looking at bullish exposure to the Dutch AEX index, using call options or futures. Industrial stocks that held up well during the 2025 slowdown could see earnings forecasts revised higher. Implied volatility in some of these names may still be too low given the improved backdrop. In FX markets, the data may support the euro versus the US dollar. One approach is buying short-dated EUR/USD call options to benefit if rate expectations shift in the euro’s favor. At the same time, European government bonds could weaken, making short positions in German Bund futures a possible hedge.Positioning For Eurozone Volatility
This single data point adds uncertainty and could lift volatility in the weeks ahead. We are watching the Euro STOXX 50 Volatility Index (VSTOXX), which traded at relatively low levels for most of January 2026, as a potential long position. The upcoming Eurozone flash PMI data will be important to confirm whether this Dutch strength is an outlier or the start of a broader trend. Create your live VT Markets account and start trading now.EUR/USD slips to around 1.1905 in early European trade, snapping a two-day winning streak ahead of US data
EUR/USD slipped to around 1.1905 in early European trade on Tuesday, snapping a two-day rally. Traders stayed cautious ahead of delayed US jobs and inflation data, after a four-day government shutdown.
White House economic adviser Kevin Hassett said US job growth could slow in the coming months. He blamed slower labour force growth and higher productivity.
Us Jobs Data In Focus
The US Nonfarm Payrolls report is due on Wednesday. Forecasts point to a 70,000 increase in January. The Unemployment Rate is expected to hold at 4.4%. If the data comes in weaker than expected, the US dollar may fall and EUR/USD could rise. If jobs data is stronger, the dollar could strengthen against the euro. Last week, the ECB left its benchmark interest rate unchanged at 2.0% for the fifth meeting in a row, in line with expectations. ECB President Christine Lagarde said decisions will stay data-dependent and will be made meeting by meeting. She added that the bank will not commit to a set path for rates.Ecb Policy Outlook
A Reuters poll in January found that about 85% of economists expect the ECB to keep rates unchanged through the rest of 2026. This suggests markets are pricing in a long pause. EUR/USD is now trading near 1.0750 and looks soft as markets prepare for this week’s US inflation data. This setup is similar to periods of uncertainty seen in 2025 ahead of major releases. The main focus is the Consumer Price Index (CPI), which is likely to shape the Federal Reserve’s next move. US inflation in January 2026 was 2.8%, still well above the Fed’s 2% target. At the same time, last week’s jobs report was strong, with 215,000 jobs added. Together, these signals give the Fed little reason to cut rates soon. This supports the US dollar. In contrast, the ECB says it will stay data-dependent and will not lock in a rate path. Eurozone inflation has cooled faster than US inflation and recently came in at 2.2%. That gives the ECB room to keep rates steady. This gap between a firmer Fed and a more patient ECB is weighing on EUR/USD. The volatility seen in 2025 showed that policy differences between central banks are a key driver for this pair. The rate gap between the US and the Eurozone has widened to more than 1.5 percentage points. That makes it expensive to bet against the dollar. We expect this situation to persist. For traders, this backdrop supports a stronger dollar in the weeks ahead. Options strategies that benefit from a drop in EUR/USD, such as buying puts, may work well. With the CPI report approaching, short-term volatility may also rise. As a result, staying short EUR/USD not only aligns with the data, but can also capture positive carry. This means earning the interest rate difference between the two currencies. We see the easiest path still pointing lower, with 1.0600 as a likely test. Create your live VT Markets account and start trading now.Dividend Adjustment Notice – Feb 10 ,2026
Dear Client,
Please note that the dividends of the following products will be adjusted accordingly. Index dividends will be executed separately through a balance statement directly to your trading account, and the comment will be in the following format “Div & Product Name & Net Volume”.
Please refer to the table below for more details:
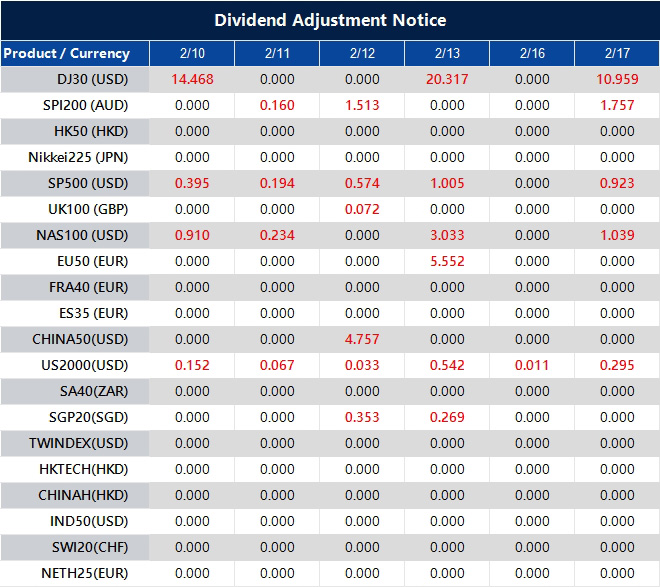
The above data is for reference only, please refer to the MT4/MT5 software for specific data.
If you’d like more information, please don’t hesitate to contact [email protected].
GBP/USD slips near 1.3685 in the European session as UK politics and BoE rate-cut bets weigh
GBP/USD fell in early European trading on Tuesday. It hovered near 1.3685 and stayed below 1.3700. The Pound weakened against the US Dollar as political uncertainty in the UK increased.
UK Prime Minister Keir Starmer faced a leadership challenge after Scottish Labour leader Anas Sarwar called for his resignation. The call followed fallout linked to the Jeffrey Epstein scandal. Starmer said he would not step down and would stay in office.
The Pound also came under pressure as markets increased bets on near-term Bank of England (BoE) rate cuts. These expectations added to the downside move in GBP/USD during the session.
With the Prime Minister under political pressure and more talk of BoE rate cuts, the Pound Sterling may weaken further. Derivative positioning should account for a potential decline in GBP/USD. Buying put options is a simple way to benefit from a move lower. This approach captures downside risk while limiting losses to the premium paid.
This setup is similar to the political turmoil in late 2022 during the short Truss premiership. In that period, the pound fell sharply against the dollar and hit a record low near 1.03. That episode shows how fast political uncertainty can lead to major currency losses.
Expectations for a BoE rate cut are rising, especially after UK inflation cooled to 4.0% in the final quarter of 2025. That is a large drop from earlier highs. In contrast, the US Federal Reserve still signals a “higher for longer” stance, which supports the US Dollar. This policy gap keeps steady downward pressure on GBP/USD.
Implied volatility for the Pound will likely rise as the political story develops, which would make options more expensive. During the 2022 stress, one-month implied volatility in GBP/USD jumped above 20%. Today it is closer to 8%. Buying options sooner could be cheaper than waiting if the situation worsens.
Key technical levels also matter. The 1.3500 area is an important support level that was tested in late 2025. A clear break below 1.3500 could trigger a faster sell-off toward the 1.32s. As a result, put option strikes near or below 1.3500 may work well in the coming weeks.
FXStreet data shows gold prices in the Philippines have declined, according to compiled figures
Gold prices in the Philippines fell on Tuesday, according to FXStreet data. Gold was priced at PHP 9,448.18 per gram, down from PHP 9,547.87 on Monday.
Gold dropped to PHP 110,201.70 per tola from PHP 111,364.50 the day before. Other listed prices were PHP 94,479.42 for 10 grams and PHP 293,871.40 per troy ounce.
FXStreet converts global gold prices into Philippine pesos using the USD/PHP exchange rate and local units. Prices are updated daily using market rates at the time of publication, and local prices may differ slightly.
Central banks hold the largest gold reserves. In 2022, they bought 1,136 tonnes worth about $70 billion, according to the World Gold Council. This was the biggest yearly purchase on record, led by higher reserves in China, India, and Turkey.
Gold often moves in the opposite direction of the US Dollar and US Treasury yields. It can also move differently from risk assets like stocks. Prices can change due to geopolitical events, recession worries, interest rates, and the US Dollar because gold is priced in dollars (XAU/USD).
Even though the dip in gold prices is small, it may be creating an opportunity as broader markets shift. The January 2026 US jobs report was much weaker than expected. Non-Farm Payrolls rose by only 95,000 jobs, which has led many to think the Federal Reserve could pause rate hikes. This has pressured the US Dollar, which often moves opposite to gold.
Bond markets are reflecting these shifting rate expectations. In early February 2026, the US 10-year Treasury yield fell to near 3.8%. Since gold does not pay interest, it tends to look more attractive when yields fall because the “cost” of holding it is lower. A similar pattern appeared in the second half of 2025, when falling yields came before a strong rally in precious metals.
Geopolitics is also supporting prices. Trade disputes and maritime tensions in the South China Sea are increasing demand for safe-haven assets. With this level of uncertainty, price dips may not last long. For traders, this may favor strategies that look for upside while limiting risk, such as buying call options.
Looking back at 2025, weaker US economic data often led to higher implied volatility. That suggests bigger price swings could return in the weeks ahead. Because of that, defined-risk options strategies may be safer than holding futures positions outright. The goal is to position for a weaker dollar and lower rates while protecting capital if the market suddenly reverses.
It is also important to note the strong institutional demand behind the market. The World Gold Council’s final 2025 report said central banks—especially in emerging markets—kept buying heavily, adding more than 950 tonnes last year. This steady demand supports prices over the long term and reduces the risk of a sharp collapse.
Compiled data shows that gold prices in the United Arab Emirates have fallen from previous levels
Gold prices in the United Arab Emirates fell on Tuesday. Gold was priced at AED 593.43 per gram, down from AED 599.78 on Monday.
Gold also dropped to AED 6,921.66 per tola, compared with AED 6,995.70 a day earlier. Other listed rates were AED 5,934.32 for 10 grams and AED 18,458.13 per troy ounce.
Uae Gold Price Calculation
FXStreet calculates UAE gold prices by converting global prices using the USD/AED exchange rate and local units. Prices are updated daily using market rates at the time of publication, though local rates may vary slightly. Central banks are the biggest holders of gold. In 2022, they added 1,136 tonnes worth about $70 billion—the highest annual total on record—according to the World Gold Council. Gold often moves in the opposite direction to the US Dollar and US Treasuries. It can also move against risk assets such as shares, and it may react to changes in interest rates, geopolitics, and recession concerns. The recent small drop in gold prices reflects the current strength of the US Dollar, which has been a major headwind for the metal. Comments from the Federal Reserve last week suggest it is not in a hurry to cut interest rates. That makes a non-yielding asset like gold less appealing in the very short term. This backdrop supports a cautious stance for traders holding bullish positions.Market Outlook And Trading Approaches
Still, strong underlying support from central banks remains a key feature of the market. Full-year data for 2025 shows central banks added another 950 tonnes to their reserves. This continues the steady buying trend seen since 2022. This persistent demand helps support prices and reduces the chance of a sharp sell-off. The US Dollar Index has held firm, hovering around 105.5 for the past few weeks. Historically, levels like this can limit gold’s upside. Also, January’s inflation report showed inflation still stuck at 3.2%, strengthening the case for higher interest rates for longer. That keeps upward pressure on Treasury yields, which compete with gold for safe-haven demand. A similar pattern played out through much of 2024 and 2025. Gold stayed resilient and even rose despite high rates, largely due to geopolitical risks. With these forces pulling in different directions, volatility could rise quickly. Traders looking for a low-cost way to prepare for a sudden rally could consider out-of-the-money call options, which may benefit if an unexpected global event drives prices higher. With mixed drivers in play, gold could also trade in a range over the next few weeks. Traders may consider buying puts to hedge long positions if prices fall toward key support levels. This can limit downside risk while keeping exposure to the longer-term bullish case supported by central bank demand. Create your live VT Markets account and start trading now.Gold prices in Pakistan fell, according to FXStreet-compiled data
Gold prices in Pakistan fell on Tuesday, based on data compiled by FXStreet. Gold was priced at PKR 45,033.45 per gram, down from PKR 45,526.33 on Monday.
Gold also dropped per tola to PKR 525,260.80, from PKR 531,010.20 a day earlier. Reference prices were PKR 450,330.40 for 10 grams and PKR 1,400,716.00 per troy ounce.


