Indices Show Mixed Results: NASDAQ Drops After Meta Delays AI Model
Japanese Yen Strength Weakens GBP/JPY as Risk Aversion Increases on Thursday
Bank of Japan Policy Shift
The Bank of Japan has hinted at a potential change in policy, encouraged by rising inflation and a strong Producer Price Index. If Japan’s Q1 GDP report shows better results than the expected 0.1% contraction, it will support this shift. Market sentiment is defensive, favoring the Yen in these uncertain times. In the short term, we are unlikely to see GBP/JPY change significantly unless there’s a shift in monetary policy or overall risk appetite. GBP/JPY continues to move downward as investors become more cautious. This trend isn’t just about a preference for the Yen; rather, it’s about a general move away from risk in the markets. Safe-haven buying increases during global instability, especially with ongoing geopolitical tensions and fragile discussions between major economies. Despite the UK’s strong quarterly growth, reaching 0.7% which surpassed many expectations, it hasn’t lifted the Pound. The Bank of England’s cautious tone remains. Even with positive domestic data, officials are hesitant to signal a shift away from high interest rates. This uncertainty makes it hard for traders to justify long positions in the Pound, particularly against the Yen which benefits from the broader risk-averse trend. Going forward, it’s less about whether UK data stays strong and more about whether policymakers change their messaging. Without clear signals or significant policy shifts, the demand for the Pound isn’t likely to return strongly. The Governor and the Monetary Policy Committee are focused on inflation and wage growth, with concerns about persistent price pressures outweighing positive economic surprises.Japan’s Economic Outlook
On Japan’s side, there are early signs of a potential policy change. The rising Producer Price Index indicates underlying inflation may continue. If Japan’s GDP report shows less weakness than the expected -0.1% contraction, it would strengthen expectations for future interest rate hikes, benefiting the Yen. Overall, the market remains cautious, and this sentiment influences trading strategies. Investors are favoring stability over growth as geopolitical risks escalate. In this environment, the Yen becomes more appealing. For derivative traders, the strategy should focus on stability rather than speculation. Defensive positions typically perform better during volatile times with uncertain policy direction. In terms of strategy, tracking breakouts from unexpected data will be key. If Japan’s economy performs better than expected, it will increase the chances of gradual tightening and strengthen the Yen, which may push GBP/JPY lower, especially if there’s no optimistic shift from the Bank of England. Additionally, managing short-term risk around major events, like central bank announcements or PMI readings, can provide practical entry points rather than blindly chasing trends. The most impactful movements are likely to arise from macroeconomic surprises rather than slow, steady trends. The momentum is clearly leaning toward caution. Until interest rates change or global risks lessen, we will maintain a defensive position. The current price action tells an important story. Create your live VT Markets account and start trading now.Michael Barr: US Economy is Stable, but Trade Policies Create Uncertainty for the Future
US Economy and Trade Policies
Right now, the US economy is holding steady with inflation close to 2%. However, trade policies bring some uncertainties. A sudden trade shock could hurt small businesses and lead to price increases if supply chains struggle or businesses go under. Barr’s remarks highlight concerns about the pressure certain policy changes could put on smaller companies. Higher costs from tariffs add to this pressure. It’s important because small businesses play a key role in keeping supply chains running and creating jobs. If many of them start facing these challenges, we could see wider disruptions. In terms of derivatives, pricing models might need changes if inflation expectations rise again. While consumer prices are closer to 2%, this progress could reverse if rising import prices create cost-push inflation. We’re not only looking at the price of goods but also logistics and storage costs, which are already tight, and this is reflected in derivatives contracts. Those involved in rate-sensitive strategies should take note: even without a rise in the Consumer Price Index, the Federal Reserve might keep rates high for longer if they anticipate price pressures from trade issues. Barr’s cautious comments suggest the Fed is paying attention to how policies affect the market. Thus, strategies based on expected cuts might need adjustment if consensus on timing changes.Market Adjustments and Risk Parameters
Additionally, spreads across different durations may shift if there’s a growing gap between short-term inflation stability and mid-term risks. This isn’t about panicking but making sensible adjustments. Recent stability in core inflation doesn’t mean that TIPS breakevens won’t widen if input costs rise. This is another factor our models indicate we should track closely. Moreover, high tariffs could reduce business investment. This may impact growth expectations reflected in equity index derivatives, especially in small-cap sectors. These companies often have less power in global markets and tighter profit margins affected by commodity price changes. If futures and options are too closely tied to forecasts that overlook these economic pressures, traders might be caught off guard. Given this situation, we’re making small adjustments to our risk parameters for positions related to global trade exposure. While this isn’t a dramatic shift yet, the cost of ignoring this risk has started to push up some implied volatilities on longer-dated contracts linked to industrials and transport. That shift may not be gradual, and once liquidity aligns with these assumptions, pricing changes can happen more suddenly than expected. Barr’s message is not a prediction, but a warning that the market has certainly noticed. Create your live VT Markets account and start trading now.Notification of Server Upgrade – May 15 ,2025
Dear Client,
As part of our commitment to provide the most reliable service to our clients, there will be server maintenance and product adjustment this weekend.
Maintenance Details: MT4 / MT5 – 17th of May 2025 (Saturday) 00:00 – 03:00 (GMT+3)
Please note that the following aspects might be affected during the maintenance:
1. During the maintenance hours, Client portal and VT Markets App will be unavailable, including managing trades, Deposit/Withdrawal and all the other functions will be limited.
2. During the maintenance hours, the price quote and trading management will be temporarily disabled during the maintenance. You will not be able to open new positions, close open positions, or make any adjustments to the trades.
3. There might be a gap between the original price and the price after maintenance. The gaps between Pending Orders, Stop Loss and Take Profit will be filled at the market price once the maintenance is completed. If you don’t want to hold any open positions during the maintenance, it is suggested to close the position in advance.
4. Following the maintenance, it is important to note that the latest version will be 4475. If your MT5 version is below 4410, it is suggested that you download the latest version on official website by navigating to “Trading” → “Platforms”→ “MetaTrader 5”.
Check your MT5 software version with the following steps:
※ PC: Open the MT5 software > Help > About;
※ Android: Open the MT5 app > About;
※ iOS: Open the MT5 app > Settings > Settings.
Please refer to MT4/MT5 for the latest update on the completion and market opening time.
Thank you for your patience and understanding about this important initiative.
If you’d like more information, please don’t hesitate to contact [email protected].
Dividend Adjustment Notice – May 15 ,2025
Dear Client,
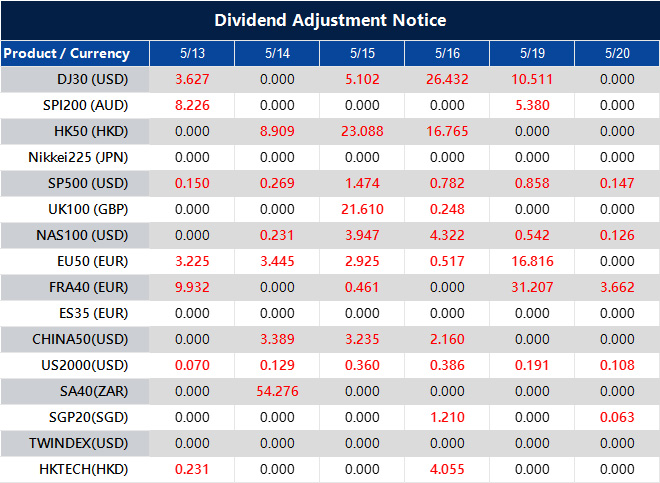
Please note that the dividends of the following products will be adjusted accordingly. Index dividends will be executed separately through a balance statement directly to your trading account, and the comment will be in the following format “Div & Product Name & Net Volume”.
Please refer to the table below for more details:
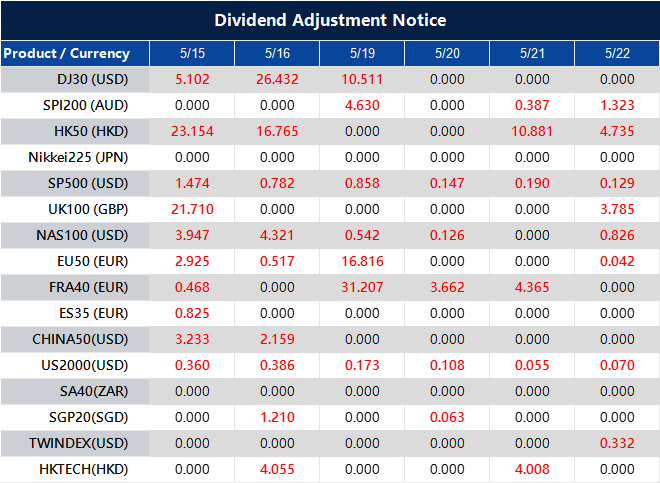
The above data is for reference only, please refer to the MT4/MT5 software for specific data.
If you’d like more information, please don’t hesitate to contact [email protected].
VT Markets Delivers Its Strongest Trading Month Yet

Raising the Bar in 2025: VT Markets Delivers Its Strongest Trading Month Yet
Record-breaking performance at highlights VT Markets’ momentum in its 10th anniversary year
15 May 2025, Sydney, Australia – VT Markets, a leading global multi-asset broker, has recorded its strongest-ever monthly trading volume, reaching 720BN in April 2025. This milestone reflects the VT Market’s accelerated growth trajectory and influence across global financial markets. It also sets the tone for what promises to be a transformative year as VT Markets enters its 10th anniversary with renewed ambition and elevated client focus.
This trading record coincides with the unveiling of VT Markets’ 10th anniversary plans, officially announced on April 22, 2025. Marking a decade of rapid growth and global impact, the year-long celebration will feature exclusive promotions, offers, and engagement activities with our global community.
As volatility ripples across major asset classes, traders are actively seeking a platform that offers both speed and reliability. VT Markets has emerged as the broker of choice — trusted for its ultra-fast execution, real-time analytics, and client-centric tools that empower users to act decisively in fast-moving markets. In a world where opportunity is measured in milliseconds, VT Markets continues to deliver the performance edge traders need.
VT Markets continues to see exponential growth across regions such as Southeast Asia, the Middle East, and Latin America, with 20% growth in daily active users. The platform’s multilingual support and culturally localized outreach strategies have deepened its relevance in emerging markets, while institutional volumes also surged thanks to deeper liquidity pools and ultra-low-latency trade execution.
“Sharing this milestone with our clients and partners is especially meaningful as it represents more than just numbers — it’s a reflection of the strength behind our platform, the innovation driving our growth, and the confidence the trading community continues to place in VT Markets,” said Ross Maxwell, Global Strategy Operations Lead. “We see it as both a celebration and a responsibility — to keep raising the bar in everything we do.”
As VT Markets advances its technological capabilities, infrastructure, and global client engagement, the company looks ahead to breaking new ground, and setting new standards in the world of online trading.
About VT Markets
VT Markets is a regulated multi-asset broker with a presence in over 160 countries as of today. It has earned numerous international accolades including Best Online Trading and Fastest Growing Broker. In line with its mission to make trading accessible to all, VT Markets offers comprehensive access to over 1,000 financial instruments and clients benefit from a seamless trading experience via its award-winning mobile application.
For more information, please visit the official VT Markets website or email us at [email protected]. Alternatively, follow VT Markets on Facebook, Instagram, or LinkedIn.
For media enquiries and sponsorship opportunities, please email [email protected], or contact:
Dandelyn Koh
Global Brand & PR Lead
Brenda Wong
Assistant Manager, Global PR & Communications
Dividend Adjustment Notice – May 14 ,2025
Dear Client,
Please note that the dividends of the following products will be adjusted accordingly. Index dividends will be executed separately through a balance statement directly to your trading account, and the comment will be in the following format “Div & Product Name & Net Volume”.
Please refer to the table below for more details:
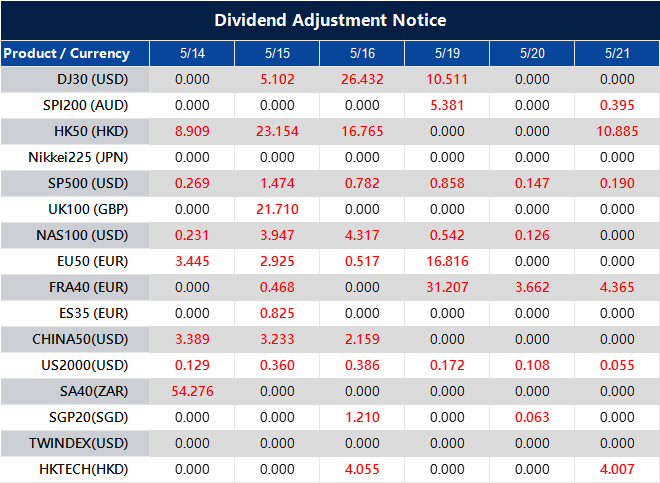
The above data is for reference only, please refer to the MT4/MT5 software for specific data.
If you’d like more information, please don’t hesitate to contact [email protected].
Dollar Retreats With Cooling Inflation
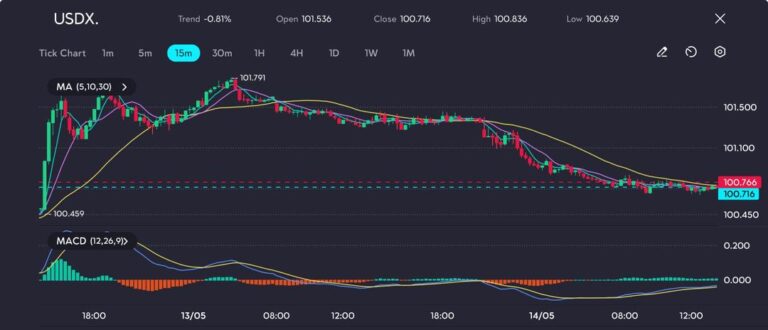
The US dollar saw a sharp decline on Tuesday before stabilising early on Wednesday, as weaker-than-anticipated inflation figures fuelled speculation of interest rates cut by the Federal Reserve later this year. The USDX index closed at 100.716 after falling significantly from Monday’s one-month high of 101.791, its worst daily performance since mid-April.
The retreat followed data from the US Labour Department, which revealed that consumer prices rose by just 0.2% in April on a monthly basis. This figure came in below the 0.3% forecast by Reuters, lending further support to market expectations of a more accommodative monetary stance. It follows an unusual 0.1% monthly decline in March.
That said, inflationary pressures may re-emerge, particularly as tariffs risk driving up costs in the months ahead. Although President Trump’s trade delegation recently agreed to a 90-day tariff ceasefire with China, the future of negotiations remains uncertain. The President has also hinted at possible trade arrangements with India, Japan, and South Korea, though the absence of concrete frameworks continues to unsettle investors.
Despite Tuesday’s drop, analysts at TD Securities and the Commonwealth Bank of Australia still foresee short-term strength in the dollar before a more sustained downturn later in the year. TD projects the greenback could depreciate by as much as 5% in the second half of 2025, as global investors seek to reduce exposure to US assets amidst ongoing policy uncertainty.
Technical Analysis
The US Dollar Index (USDX) briefly pushed above the 101.70 mark early on 13 May, reaching a high of 101.79 before retreating in a steady decline. The index subsequently dropped below its 10-, 20-, and 30-period moving averages, confirming a bearish crossover and signalling further downside momentum. By 14 May, the index hovered near 100.71, aligning with previous support at 100.45.

Momentum indicators further confirm the bearish bias. The MACD histogram remains negative, and the signal lines have diverged bearishly, indicating sustained selling pressure. Unless the bulls can reclaim the 101.00 threshold, the path of least resistance remains downward, with 100.45 and potentially 100.20 acting as the next areas of interest.
Cautious Outlook
While the dollar may enjoy a short-term rebound as markets reassess the latest inflation data and broader global conditions, the overall trajectory remains uncertain. Futures markets currently suggest at least 50 basis points of rate cuts from the Fed this year, which could limit any lasting recovery in the greenback. A meaningful turnaround in the USDX would likely require stronger US economic data and greater clarity on the country’s trade agenda.
Sentiment Analysis In Financial Trading: What You Need to Know

Immediately after Donald Trump became the 47th President of the United States on 6 November 2024, the main indices recorded impressive gains.
The Dow Jones Industrial Average surged over 1,500 points, reaching an all-time high. The last time the Dow jumped over 1,000 points in a single day was in November 2022.
The S&P 500 rose by 2.5%, while the Nasdaq climbed 3%, with both indices hitting record highs.
The Russell 2000 Index, which tracks 2,000 small-cap companies, recorded a 5.8% increase.
Major bank stocks also strengthened, with gains of 11.5%, 8.4%, and 13% for JPMorgan, Bank of America, and Wells Fargo, respectively.
The question is: why did the US stock market exhibit bullish behaviour following the election result announcement?
The answer is simple – market sentiment.
What Is Market Sentiment?
Imagine overhearing a conversation between two of your colleagues who are active forex traders.
Colleague A says, “I’m confident the market will be bullish today.”
Colleague B disagrees, replying, “Who says so? Today is going to be a sell-off!”

This opposing sentiment between the two reflects the reality of the financial market: a collective outcome of all market participants’ views, ideas, and opinions.
This mixed emotional state is referred to as market sentiment because financial markets are driven by emotion.
When sentiment analysis is given equal attention alongside technical and fundamental analysis, traders move closer to making more accurate decisions.
Sentiment Analysis As A Means To Measure Market Sentiment
Market sentiment can be gauged using sentiment analysis. This involves assessing the emotions and opinions of market participants towards a particular asset or market.
Sentiment analysis is essential for understanding market dynamics, as it helps traders evaluate the prevailing mood of the market, whether bullish (optimistic) or bearish (pessimistic).
It uses computational techniques to determine whether information from news sources and social media forms a positive, negative, or neutral sentiment.
In trading, this analysis offers insights into market emotions and behaviours. When combined with technical and fundamental indicators, sentiment analysis can assist traders in making more precise market entry decisions.
Types Of Indicators In Sentiment Analysis
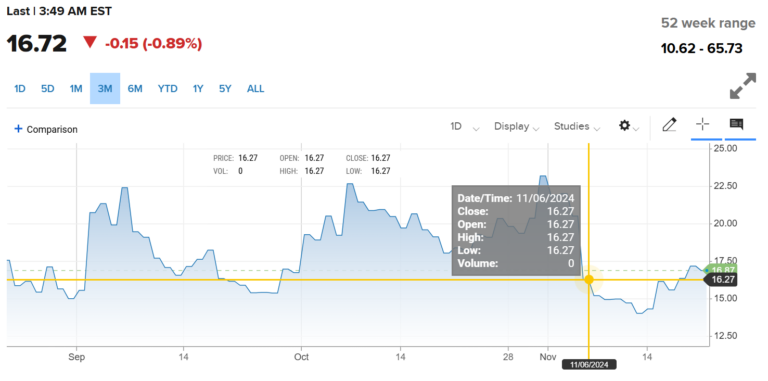
1. CBOE Volatility Index (VIX)
Also known as the ‘fear index’, the VIX measures market volatility and investor sentiment regarding future price movements.
A high VIX indicates increased fear or uncertainty in a market with bearish sentiment.
2. Bullish Percent Index (BPI)
BPI shows the percentage of stocks in an index with bullish momentum. The higher the BPI, the stronger the bullish sentiment among investors.
3. High-Low Index
This indicator compares the number of stocks reaching 52-week highs with those hitting 52-week lows. A high ratio indicates bullish sentiment, while a low ratio signals bearish sentiment.
4. Put/Call Ratio
This indicator compares the volume of put options to call options. A high put/call ratio suggests bearish sentiment, while a low ratio indicates bullish sentiment.
5. Advance-Decline Line (ADL)
The ADL tracks the difference between the number of advancing and declining stocks. An upward trend in ADL implies bullish sentiment; a downward trend suggests bearish sentiment.
6. Social Media Sentiment Analysis
Traders can use algorithms to assess sentiment on social media platforms, like Twitter and Reddit. This analysis is useful for gauging public opinion on a particular asset.
7. News Sentiment Analysis
News headlines and articles can provide insight into traders’ views on the market. Optimistic, pessimistic, or neutral tones in the news can shift public perception.
8. Commitment of Traders (COT) Report
This report holds unique importance in the futures market, offering valuable insights into the positions held by traders.
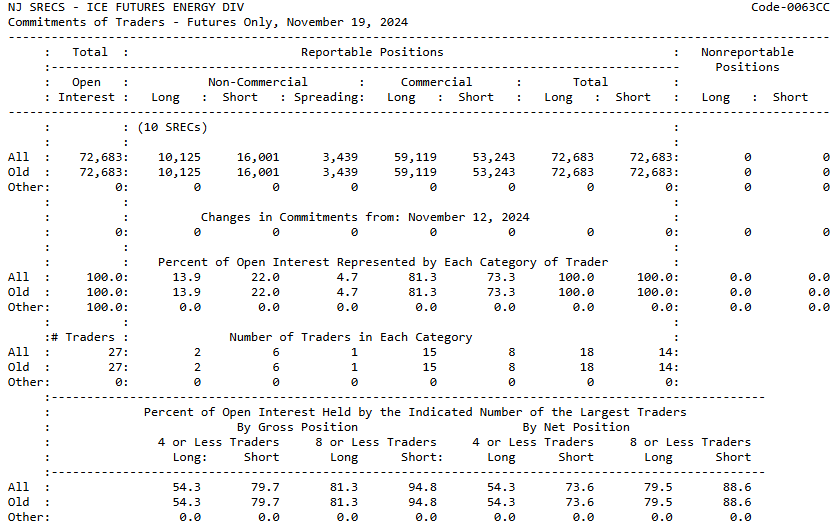
It can be used to inform buy or sell decisions. There are four types of COT reports: Legacy, Supplemental, Disaggregated, and Traders in Financial Futures.
Risks Of Relying Solely On Sentiment Analysis

5 Ways To Apply Sentiment Indicators In Trading Strategies
1. Combine Sentiment Analysis With Technical And Fundamental Analysis
The best way to gain a complete market picture is by integrating sentiment indicators with technical and fundamental analysis. This combination helps validate signals and improve decision accuracy.
Divergence analysis can identify divergence between sentiment indicators and price movements. For example, if sentiment is bullish but prices are falling, this may indicate a possible reversal.
2. Monitor Extreme Market Sentiment
Use sentiment indicators to identify extreme bullish or bearish levels, which may signal market peaks or troughs. For example, a high put/call ratio might indicate strong bearish sentiment and present a buying opportunity.
3. Risk Management
Incorporate sentiment analysis as one component of risk management. For instance, if an indicator shows extreme bullish sentiment, consider reducing exposure to the market to minimise losses from a potential correction.
In volatile markets, use hedging strategies based on prevailing sentiment to protect against adverse price movements.
4. Stay Informed With Market News
News developments can influence market sentiment. Shifts in public perception can change market dynamics. Therefore, being attentive to news is key to making informed decisions.
Leverage social media sentiment analysis to assess public opinion in real time, as social media activity often reflects investor mood immediately.
5. Test And Improve Strategies
Always backtest strategies involving sentiment indicators to assess their performance in different market conditions.
Be ready to adapt strategies in response to changing market environments and evolving sentiment trends. Flexibility is key to maintaining a competitive edge in trading.
Final Words
You now understand that financial markets are driven not only by economic data and news, but also by trader emotions.
By paying attention to market sentiment, you can gain insight into market psychology, identify potential reversal points, and avoid poor decision-making.
Dividend Adjustment Notice – May 13 ,2025
Dear Client,
Please note that the dividends of the following products will be adjusted accordingly. Index dividends will be executed separately through a balance statement directly to your trading account, and the comment will be in the following format “Div & Product Name & Net Volume”.
Please refer to the table below for more details:
The above data is for reference only, please refer to the MT4/MT5 software for specific data.
If you’d like more information, please don’t hesitate to contact [email protected].


