US stock futures turn bullish as earnings approach, with markets closed for a holiday
Dow Jones futures rose over 1% on Memorial Day after U.S. President Donald Trump delayed EU tariffs until July 9. The NASDAQ 100 futures increased by 1.52%, as this postponement lowered immediate tariff worries. This decision came after talks with European Commission President Ursula von der Leyen and affects the trade agreement timeline between the U.S. and the EU.
Recently, the Dow fell by 2.5% due to fears of potential 50% tariffs on the EU. Earlier, Trump had set a 20% tariff on the EU in April, then lowered it to 10% during negotiations. Actions like these create market uncertainty.
After a decline in US bond markets, the USD/JPY is starting to recover around 144.00.
BoJ’s Historical Approach
The Bank of Japan (BoJ) has a history of using very loose monetary policy to increase domestic demand. In contrast, the US Federal Reserve has kept interest rates high to fight inflation. These different strategies are being reconsidered as worries about fiscal issues and credit ratings affect the strength of the US Dollar. Markets are adjusting expectations for possible interest rate cuts by the Fed this year. The Japanese Yen is making a comeback as a safe-haven currency due to concerns about fiscal responsibility in the US. If Ueda hints at tightening policies, the Yen could gain strength by narrowing the interest rate gap and increasing confidence in the currency. Currently, the USD/JPY is facing renewed downward pressure, influenced by last week’s changes in US Treasury yields and a global move towards safer assets. The drop below 143.00 is more than just a technical indicator; it reflects a change in market sentiment and a shift away from recent trends. As risk aversion increases, short-term trades are highly sensitive to news about inflation and interest rates in both the US and Japan.Federal Reserve Stance
Ueda’s upcoming speech is attracting more attention than expected. Although he usually avoids making bold policy announcements, any hints—especially regarding the labor market or domestic spending—will be closely analyzed for signs that Japan may further ease its yield curve control. Long-term Japanese bonds have been steadily changing, and a clear stance from the BoJ could draw investment back to the Yen, creating pressure on the currency pair from Japan. The Federal Reserve’s position is still unclear. While inflation has decreased from its highs, core levels remain resistant in some areas of the economy. Powell’s team has not given strong indications about reducing interest rates, and ongoing budget concerns increase the demand for safe-haven assets. This trend is becoming visible in the bond markets, with long-term yields slightly rising as investors reconsider public spending risks. This situation could indirectly support the Yen, especially if Japanese authorities reduce their intervention efforts. We anticipate that the gap between US and Japanese yields will remain narrow in the short term, particularly if the Fed stays cautious about easing policies. This makes carry trades less appealing and may lead to a reduction of USD/JPY long positions that were built with the expectation of continuous strong US economic performance. Create your live VT Markets account and start trading now.Silver stabilizes around $33.50 after nearly 4% rise, with $34.50 in sight next
Silver (XAG/USD) has remained steady above $33.00, reaching around $33.40 during US trading hours on Monday. This follows a 4% gain from the previous week, driven by a strong market and safe-haven demand.
Earlier in the day, spot prices dipped slightly as global trade tensions eased, which influenced the US Dollar (USD). However, silver held its ground above $33.00, with traders adopting a ‘wait and see’ approach as short-term momentum lost some steam.
Last week, a breakout from a symmetrical triangle pattern was confirmed. Since then, prices have remained stable above the $32.60–$32.80 range, aligned with the 21-day EMA.
Currently, silver prices are just below Friday’s high of $33.54, facing resistance between $33.70 and $34.00. If prices rise above this range, they could re-test March’s high near $34.50 and potentially reach $35.00. Support is identified around $32.60–$32.80, with further risks at $32.00 and $31.00. Momentum indicators like RSI and MACD show a moderately bullish outlook, with RSI at 56.24 indicating potential for further gains.
So far, silver’s movement has been steady, trading above $33.00 and gaining about 4% last week. This rise mainly came from buyers reacting to a technical breakout and strong demand for safer assets when currencies fluctuate. On Monday, silver edged up to $33.40, although it briefly pulled back earlier as easing global trade tensions boosted the dollar. This quick dollar strength diminished, causing less urgency in silver’s rally.
The symmetrical triangle breakout was confirmed last week, often seen by chart analysts as a signal for a trend extension. Since then, prices have remained relatively flat. Currently, silver is comfortably holding above $33.00 and above the crucial 21-day EMA, which is now between $32.60 and $32.80, acting as a local support level.
From a resistance perspective, the prices are approaching Friday’s high of $33.54. The next resistance level lies between $33.70 and $34.00. This area could limit gains unless new buying interest appears. If prices break above this level, they could move towards March’s high around $34.50, with a target of $35.00 if the upward momentum continues. If momentum falters, strong support is present at $32.60–$32.80, with risks of deeper sell-offs down to $32.00 and $31.00.
Shorter-term momentum indicators, like RSI and MACD, don’t show any signs of trouble. The RSI is at 56.24, just above the midpoint, indicating some enthusiasm without being overheated. This suggests there’s still room for price increases before facing exhaustion. The MACD also supports potential advances without showing any signs of divergence.
Given the current price movements and risk appetite, the technical setup indicates stability for continued growth, although without a sense of urgency. It’s important to monitor areas where sharp price movements may prompt reactions—either profit-taking or renewed momentum. Watching how prices behave around the $33.70–$34.00 range will be key, particularly if it gets tested multiple times. If traders rush in without a clear increase in volume, we might find ourselves in a limited price range before the next momentum shift.
In this environment, we need to closely observe how support levels hold up and whether buyers continue to respect the moving average cluster below. Any dips below these levels could happen quickly, especially if leveraged positions unwind. This area—near $32.00—is where confidence may be tested, and where short-term bets could become more sensitive to broader market shifts.
AUD/USD retraces to 0.6500 after peaking at 0.6540 in six months
**Inflation Data Anticipation**
The upward trend of the pair is supported by a 20-day EMA at 0.6426, and the RSI is looking to break above 60.00. If the pair moves past 0.6515, the next targets could be 0.6550 and 0.6600. On the other hand, falling below 0.6187 raises the risk towards levels of 0.6087 and possibly 0.6000.
Key factors affecting the Australian Dollar include interest rates, iron ore prices, and China’s economic performance. The Trade Balance also impacts the currency’s strength; a positive balance tends to increase its value.
After reaching a six-month high, the AUD/USD pair has dipped slightly but is still around the 0.6500 mark, up by 0.3%. This movement shows caution rather than randomness. A slight recovery in the Dollar Index to nearly 99.00, up from 98.70, has diminished some of the Australian dollar’s gains. There are other reasons for traders to approach the upcoming sessions carefully.
The US administration’s decision, led by Trump, to postpone the proposed 50% tariffs on the European Union boosted investor confidence late last week. This shift encouraged interest in riskier assets, benefiting the Australian dollar. The policy change occurred shortly after Brussels requested more time for negotiations with Washington. This news calmed the bond markets and triggered movements in commodity-linked currencies like the AUD.
**Upcoming Economic Data**
Key economic data is expected on Wednesday and Friday—not political news, but important inflation figures from both Canberra and Washington. These data releases could significantly influence central bank decisions in both countries. The Reserve Bank of Australia is being cautious, and rising consumer prices could shift expectations toward potential rate changes later this year. In contrast, the Federal Reserve is deciding whether to hint at more rate increases or to hold off. Any surprises could have a major impact on currency and interest rate futures markets.
From a technical standpoint, the pair has just emerged from a Symmetrical Triangle pattern, which often signals increased price movements and volumes ahead. While these signals alone are not enough for trades, they match the growing anticipation of upcoming data. Currently, the 20-day exponential moving average at 0.6426 provides short-term support below the market price. If resistance at 0.6515 is broken, we could see reactions near 0.6550. If that level fails, we might aim for 0.6600 based on swing projections.
However, attention must also be paid to the lower levels. A significant drop below 0.6187 would invalidate the current bullish trend and shift focus down to 0.6087. If sellers gain strength, the critical level to watch would be the round figure at 0.6000.
Beyond price movements, the Australian dollar is influenced by iron ore trends, as Australia is a major exporter. It is also sensitive to changes in China’s economy. With Chinese industrial output still fluctuating, it’s essential to monitor related data from Beijing. Additionally, Australia’s trade balance plays a key role—larger surpluses typically provide support for the currency by showing strong demand.
For those involved in rate derivatives and volatility markets, it is important not to rely solely on seasonal patterns. Option pricing around this week’s data should consider the possibility of unexpected moves, especially given current positioning in commodities and growth metrics. Premiums tied to short-term contracts may need adjustment, especially around Wednesday’s CPI data during Sydney’s trading hours.
We should be ready for any surprise inflation increase that could catch the market off guard. To prepare, making skew adjustments and recalibrating delta risk during critical data releases could be beneficial. Additionally, reducing gamma exposure ahead of known catalysts may help mitigate major market fluctuations driven by headlines.
Create your live VT Markets account and start trading now.
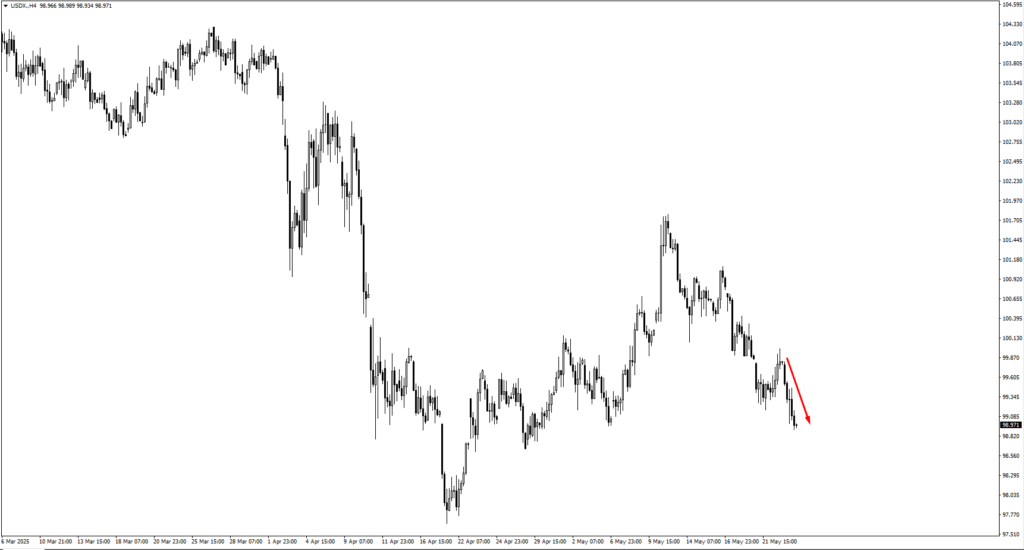
US Dollar Index stabilizes around 99.09 after recovering losses by the end of European trading
The US Dollar Index (DXY), which reflects the value of the U.S. Dollar against six major currencies, is currently around 99.09 after a recovery from an earlier decrease. This drop followed President Donald Trump’s decision to postpone tariffs on EU goods from June 1 to July 9. This delay has eased market tensions temporarily and boosted risk assets.
However, economic challenges are still present. The tax bill proposed by President Trump is nearing a Senate vote, which may worsen the US debt situation as rising yields could lead to higher demand for US debt premiums.
Reduction in Bearish Dollar Positions
In recent market activity, bearish positions on the US Dollar have decreased from $16.5 billion to $12.4 billion. European stocks have risen over 1% with a sense of optimism, and US futures show positive movement. Due to Memorial Day, the US economic calendar is quiet. Attention is turning to upcoming GDP data and Personal Consumption Expenditure figures. According to the CME FedWatch tool, there is just a 5.6% chance of a Federal Reserve interest rate cut in June. On a technical note, the DXY is showing signs of recovery after hitting recent lows, but concerns about the economy persist. Resistance is at 100.22, with a trend line near 100.80. Continued selling pressure could push the index down to this year’s low of 97.91. As the market reacts to the postponed tariffs on EU goods, the Dollar’s slight rebound might seem reassuring. However, this is likely driven by sentiment rather than real improvement in fundamentals. The temporary relief from trade delays shouldn’t overshadow ongoing underlying pressures.Tax Bill Vote and Fiscal Deficit Expectations
The upcoming Senate vote on the tax bill is a key focus. If it passes, it may increase the fiscal deficit, leading to higher Treasury yields. This situation could raise borrowing costs, making dollar-denominated assets more attractive but not uniformly. Timing is crucial. Recent movements in the currency market show a reduction in net bearish bets on the Dollar, dropping from $16.5 billion to $12.4 billion in just one week. This indicates a reduction in pessimism, although it doesn’t reflect outright confidence. Traders appear to be positioning themselves carefully ahead of important events, pulling back some risk without fully committing to a bullish stance. Looking at the broader market, there is a slight increase in risk appetite. The rise in European equities over 1% isn’t happening in isolation; it may be linked to the trade reprieve and a quiet US economic calendar during Memorial Day. Still, sluggish global growth, fiscal challenges, and a lack of immediate Fed policy triggers keep traders cautious. Expectations for the Federal Reserve, as reflected by the CME FedWatch tool, stand at just 5.6% for a cut in June. This low probability signals that policymakers are exercising patience. This approach aligns with inflation data, especially the upcoming Personal Consumption Expenditures (PCE) numbers, which will influence future expectations. The Dollar Index is attempting to recover from last week’s dip. A key resistance level is at 100.22, just below a stronger level at 100.80 marked by a long-term trend line. Short rallies without strong conviction may struggle at these resistance points, while any renewed weakness could pull the Dollar back toward its yearly low of 97.91. These levels are crucial for traders navigating short-term volatility. In the meantime, we expect lighter trading volumes until US data releases pick up again. Even low liquidity can lead to sharp price changes. Premiums in the options market and shifts in futures positioning should be closely monitored, as they often react before the underlying markets. We continue to assess upcoming economic signals from both sides of the Atlantic. European optimism might give short boosts to the euro, but the Dollar’s next movements will depend significantly on domestic fiscal policy discussions and inflation data. Keeping timeframes tight and responses quick will be beneficial as the market forms consensus on rising debt levels and delayed tariffs. Create your live VT Markets account and start trading now.US dollar recovery leads to decline of EUR/USD towards 1.1380 during North American trading
EUR/USD dropped to about 1.1380 during North American trading hours, down from a monthly high of 1.1425 earlier. This decline happened as the US Dollar Index (DXY) bounced back to nearly 99.00 after earlier losses.
The US Dollar’s future is unclear due to mixed messages about tariffs coming from Washington. President Trump has postponed a plan to impose 50% tariffs on the EU until July, after the EU agreed to speed up trade discussions and asked for more time to finalize a favorable deal.
Negotiations Between EU and US
Over the weekend, EU Commission President Ursula von der Leyen said she was ready to move forward with negotiations with the US. On Friday, Trump had announced plans for significant tariffs on EU imports, but a quick resolution eased tensions and helped both the equity markets and the Euro. German Economy Minister Katherina Reiche called for calm regarding tariffs. The US Dollar has been weak due to Trump’s tariff policies, threats to Fed Chair Jerome Powell, and a new tax and spending bill that could increase the national debt by $3.8 trillion. German Q1 GDP data showed stronger growth than expected, supporting the Euro. ECB officials remain hopeful that inflation could reach the 2% target, possibly leading to another interest rate cut. This week, EUR/USD’s movement could be affected by the upcoming US PCE data and EU HICP data. The pair has resistance at 1.1475 and support at 1.1215.Impact of US Fiscal Policy
The US Dollar is the official currency of the United States and other countries. The Federal Reserve’s monetary policy significantly affects the Dollar’s value, with quantitative easing usually weakening it and quantitative tightening strengthening it. The recent drop of EUR/USD to around 1.1380 came after a brief rise to a one-month high of 1.1425, as the Dollar Index climbed back toward 99.00. This modest recovery was enough to push the Euro lower during North American trading. Although there was initial optimism from von der Leyen’s willingness to quicken trade talks, uncertainty remains. The White House’s shifting stance from imposing tariffs to delaying them has made short-term predictions tough. Trump’s delay on the proposed 50% tariff on EU goods extends the issue but doesn’t solve it. While the risk of immediate escalation has lessened, we cannot assume this will stay the same. Markets first reacted with relief. Reiche’s calls for measured discussion may have prevented a more drastic market reaction, especially in equity indices and currencies sensitive to risk. However, uncertainty remains, especially regarding the Dollar. Traders should consider US domestic factors as well. Washington’s fiscal policy, including the latest tax and spending bill, is expected to widen the deficit by $3.8 trillion, which weighs on Dollar sentiment. Fresh doubts about pressure on Chair Powell and the perceived loss of Fed independence continue to impact decisions. At the same time, macro data point to increasing growth in the Eurozone. Strong revised Q1 GDP figures from Germany supported the Euro against the Dollar. Market pricing now shows greater confidence in inflation nearing the European Central Bank’s 2% medium-term target. If this trend continues, the current easing cycle may pause or shift tone. Attention is now on inflation data from both the US and the EU. We expect the US PCE numbers to attract more short-term market focus because of their close connection to the Fed, but the EU’s HICP data will still be significant. Any surprises here could lead to quick adjustments in positions, particularly in short-term rate markets. Technical levels provide some guidelines in this reactive environment. The 1.1475 resistance is strong, previously tested during robust buying. The 1.1215 level will warrant close attention; if that breaks under pressure, we could see accelerated declines. Without new policy initiatives, price movements may remain technical and guided by headlines. There’s no clear direction yet among larger funds, and open interest in some derivatives remains low. This caution reflects the political noise from Washington and uncertainty from the ECB. Looking ahead, leverage and volatility metrics suggest caution. Weekly implied volatility is rising slightly. Positioning should be closely aligned with key event timelines around scheduled data releases and confirmed policy statements. Any intervention or hints of intervention can significantly impact the market. Constant reassessment is crucial. Create your live VT Markets account and start trading now.At the start of the week, the Pound Sterling performs strongly against most currencies, except for the antipodeans.
The Pound Sterling is gaining strength compared to other currencies as expectations for the Bank of England’s monetary policies change. This follows a 3.5% increase in the UK Consumer Price Index and a 1.2% rise in Retail Sales in April.
So far this year, the futures market is predicting a drop in UK rates by 38 basis points. This suggests a possible 25 basis point rate cut, with a chance for a second cut. The Pound Sterling has reached a three-year high close to 1.3600 against the US Dollar, even with market holidays in the UK and US. The outlook for the GBP/USD pair is positive, as the US Dollar is weakening due to changing tariff policies.
US Dollar Index and Market Effects
The US Dollar Index is nearing its monthly low of 98.70 after the EU postponed tariffs. The recent delay in tariffs by the US President offers slight relief, but doubts about the US Dollar’s stability remain. The Australian, Canadian, and New Zealand Dollars benefit from positive market conditions linked to commodities. In contrast, “risk-off” markets favor safe-haven currencies like the US Dollar, Japanese Yen, and Swiss Franc. Currency movements show the US Dollar’s weakness, especially against the New Zealand Dollar. Moving averages and technical indicators suggest that GBP/USD will likely remain strong, with potential challenges above and support below the current levels. Recent data and market movements indicate that we’re in a brief period where interest rate expectations can provide an advantage. We are witnessing a shift in the UK’s monetary policy forecasts, which have become more aggressive due to stronger-than-expected consumer inflation and increased retail volumes. With CPI rising by 3.5% year-on-year and retail figures showing a monthly increase, this data pushes the Bank of England away from the idea of rapid multiple rate cuts. As the implied rate forecast has pulled back to just 38 basis points of easing for the rest of the year, the likelihood of two full cuts has decreased. It now seems more likely that a single 25 basis point cut may happen, with the second cut depending on further weak data—not guaranteed. This shift is significant for pricing models. The recent rise of Sterling toward a three-year peak against the Dollar, nearing 1.3600, isn’t solely influenced by UK factors. The Dollar is also showing vulnerability. The delay in US-EU tariffs has provided temporary support for risk assets and currencies sensitive to global trade. However, this delay introduces uncertainty regarding US policy, weakening the perceived stability of the US dollar. We’ve seen this reflected in the continued gains of commodity-linked currencies like the Aussie and Kiwi.Current Market Trends and Indicators
The current risk environment shows shifts in preference based on market sentiment. When markets feel secure, currencies tied to growth and commodities gain popularity. But when anxiety rises, safe-haven currencies like the Yen and Swiss Franc are favored. Sterling is in between, drawing from both risk sentiment and rate differences. We’re also noticing support from trend signals. Looking at standard moving averages—20, 50, and 100 periods—the overall outlook remains positive for the Pound. Momentum indicators, such as RSI or MACD, continue to confirm this trend. The focus now is on responding correctly to any pullbacks. Support can be found below 1.3500, and as resistance above gradually fades with increased trading volume returning from the holidays, we can look to scale entries in phases. With the Dollar Index close to its monthly low and market positions indicating a retreat in speculation, it’s wise to consider any rallies in the Dollar as temporary rather than the start of new trends. Additionally, examining Sterling’s performance against the Australian or Canadian Dollar can provide clearer signals for relative positioning without the noise of US policy changes. While risk appetite may decrease, the combination of seasonal effects, weakening Dollar strength, and less aggressive UK rate forecasts than previously expected keeps this environment open for trading. The only necessary adjustment is to reduce leverage and set more responsive stop-loss orders while trading volume is still lower than average. Create your live VT Markets account and start trading now.The NZD/USD pair hits a six-and-a-half-month high near 0.6030, suggesting a potential rally towards 0.6100.
Technical Indicators Support Upward Momentum
The US Dollar Index has dipped slightly to around 99.00, mainly due to renewed worries about its safe-haven status. The NZD/USD pair is aiming for a rise towards 0.6100, supported by a positive chart pattern and technical indicators. The Bullish Flag pattern and a rising 20-day Exponential Moving Average are driving upward momentum. If the price breaks above the daily high, the pair could advance towards the September 11 low of 0.6100 and the October 9 high of 0.6145. If the price goes down, support is at the May 12 low of 0.5846 and again at the April 10 high of 0.5767. The next interest rate decision from the Reserve Bank of New Zealand (RBNZ) is set for May 28, 2025, with a consensus rate expected to be 3.25%.Market Positioning and Near-term Outlook
With NZD/USD reaching heights not seen in over six months, focus is now on what comes next after the policy decision. The RBNZ is widely expected to lower its key interest rate from 3.50% to 3.25%, a move already reflected in current market prices. If the cut happens as predicted, any immediate gain in the pair may rely more on guidance and tone rather than the actual change. Markets often react to shifts in future expectations more than the events themselves. The Kiwi’s rise isn’t isolated. It is strengthening against most major currencies, especially with pressure on the Yen, likely as investors move away from lower-yield assets. Coupled with a weaker US Dollar, due to a temporary easing of tariff tensions, the New Zealand currency has found itself in a favorable position recently. From a technical standpoint, momentum plays a significant role. The Bullish Flag seen on daily charts signals a continuation after an initial rise. Prices staying above the 20-day Exponential Moving Average support this upward trend. If prices break through previous resistance levels—specifically the September 11 low and the October 9 peak—a move towards 0.6150 may occur smoothly. However, caution is necessary. If market sentiment shifts, nearby support is available. The May 12 low of 0.5846 and the April 10 high of 0.5767 are levels where buying interest could return. These are more than just numbers; they are crucial points where traders have held significant positions in the past, making them potential buffers if the Kiwi stumbles near its current highs. In our view of short-dated options or spread strategies, implied volatility has not yet captured the potential for a post-decision price adjustment. Staying adaptable is wise. Well-structured long Gamma or delta-neutral positions might provide flexibility if price fluctuations widen after the meeting. Markets will closely analyze Orr’s comments. Persistent uncertainty about inflation or external demand might lead policymakers to keep future rate cuts as an option. If that occurs, it establishes two targets: one for rates and another for traders tracking price movements around key technical levels. Keep positions close to these areas and adjust exposure as clarity emerges. Given the prevailing sentiment and price direction, a retest of 0.5970–0.5985 might be seen by some as a buying opportunity. However, this assumption hinges on staying above 0.5900; dropping below that could disrupt the current trend and prompt a reassessment across the board. In FX futures, positioning still favors a net-long NZD. However, week-on-week changes show caution as traders trim positions. This kind of adjustment can set the stage for a new upward movement—especially if the policy shift leads to lower short-term yield differentials elsewhere. We should also consider that the next RBNZ meeting isn’t until late May. This places greater importance on interim data like inflation reports, employment updates, and global risk events. Traders may quickly adopt a data-dependent stance, and any surprises could reset chart projections. Volatility may increase during low liquidity hours, especially since cross-asset flows are affecting FX markets more than before. It’s advisable to monitor equity and bond markets before establishing new positions. In the short term, the directional bias seems to lean upward, but the potential for sharp price movements remains high. Scale your exposure accordingly. Create your live VT Markets account and start trading now.Week Ahead: America At A Fiscal Crossroads

For decades, the United States borrowed freely, supported by global confidence in its Treasury bonds and the strength of the US dollar. However, that confidence is beginning to show cracks. With national debt exceeding $36 trillion and interest payments rising sharply, borrowing costs have moved from the sidelines to centre stage, prompting markets to take notice.
Currently, the US government pays an average interest rate of 3.289% across its debt portfolio, comprising short-term bills, medium-term notes, and long-dated bonds. While that figure may not seem alarming in isolation, it takes on new significance when viewed alongside the broader picture: total debt has reached $36.18 trillion, compared with a GDP of approximately $29.18 trillion. A 1% increase in interest rates now adds over $360 billion annually in servicing costs.
Interest payments have become far more than a footnote in the federal budget—they’re beginning to rival core programmes such as defence and Medicare. In fiscal year 2024, interest expenditure accounted for 3.0% of GDP, closing in on the 3.2% high recorded in 1991. The Congressional Budget Office (CBO) forecasts this figure will rise to 4.1% by 2035 under existing legislation. Should average rates climb to 5.8% by 2054, the debt-to-GDP ratio could balloon to 217%—a full 50 percentage points above the current baseline estimate.
These projections aren’t just hypothetical. If the 10-year Treasury yield remains above 6%, annual interest costs could swell to $2.1 trillion, or roughly 7% of GDP. Many economists view a 5% interest cost threshold as a serious warning sign, where debt servicing begins to crowd out essential government expenditure and borrowing becomes necessary simply to cover interest—often a harbinger of a debt spiral.
Lessons from History
History provides useful context. In the 1980s, the Federal Reserve raised interest rates aggressively to combat inflation, and 10-year yields surged past 10%. However, debt levels were relatively modest, around 30% of GDP, so the economy absorbed the impact. By the 1990s, as debt rose to 50% of GDP, growing interest costs forced politicians to pursue budget reforms, resulting in a brief return to fiscal discipline.
From 2010 through 2021, historically low interest rates created a false sense of security. The US could accumulate more debt without facing immediate consequences. As the Fed tightens policy, the real cost of borrowing is coming into focus, and the financial pressure is mounting.
Domestically, the US retains some flexibility. Roughly 70% of its debt is held by domestic investors, including the Federal Reserve, which adds a degree of stability. Still, over-reliance on internal buyers can crowd out private investment. Should the Fed resume large-scale Treasury purchases, it risks re-stoking inflation and undermining the dollar. It is an effective short-term solution during the pandemic, but unsustainable in the long run.
What if yields continue rising? If the 10-year Treasury breaches 5.5%, fiscal pressures become more urgent. A future Trump-led administration, possibly influenced by figures like Scott Bessent, might consider measures such as spending freezes, tax changes, or even debt restructuring. Extending bond maturities to lock in rates is one option, so is generating revenue via tariffs or encouraging capital repatriation. However, these approaches carry significant risks and rely heavily on maintaining market confidence.
Bessent contends that strong GDP growth could ease fiscal burdens by raising tax revenues. While plausible, this argument falters if interest rates remain elevated or if inflation continues to bite. Markets will demand meaningful reform, not just optimistic forecasts.
What Lies Ahead?
All of this has direct implications for financial markets. Higher yields make equities less attractive by increasing discount rates to future earnings. Should interest rises above 5% of GDP, risk assets may face deeper corrections. Equity valuations, especially in growth sectors, will likely need to adjust to a more expensive capital environment.
The US dollar faces a delicate balancing act. Elevated yields may attract short-term inflows, but if debt sustainability is questionable, capital could quickly exit. A weakening dollar would lift import prices and reintroduce inflationary pressures, precisely the outcome the Federal Reserve is keen to avoid.
The takeaway is clear. The US can still service its debt, but the margin for doing so without consequence is narrowing. Fiscal policy is no longer a distant concern. It’s now a key market driver. With crucial inflation and GDP figures due this week, investors are poised to test that premise.
Market Movements This Week
The US dollar index (USDX) continued to retrace from the 100.15 region, a monitored supply zone that has acted as resistance before. Prices pushed lower toward the 98.30 support level. With the dollar caught between yield appeal and structural doubts, a test of 98.30 may prove decisive. If support holds, the dollar could see a technical bounce. If broken, the path toward deeper correction would open, especially if bond yields soften or inflation surprises to the downside.
EUR/USD rallied cleanly from 1.1240, a key support area in the previous sessions. Traders will now be watching the 1.1470 level. Momentum remains cautiously bullish in the pair, with structural strength supported by weaker dollar expectations. However, further upside may require confirmation from Thursday’s US GDP and Friday’s Core PCE release. A softer print could reinforce the breakout structure, while a surprise to the upside may introduce volatility.
GBP/USD extended its bullish move this week. As the price climbs, attention turns to potential resistance zones at 1.3595 and 1.3670. Given the pair’s sensitivity to interest rate guidance, Friday’s speech by BOE Governor Bailey could trigger a technical reaction. Traders are advised to watch for signs of bearish reversal near these levels, especially if the dollar finds temporary support or if UK inflation commentary shifts tone.
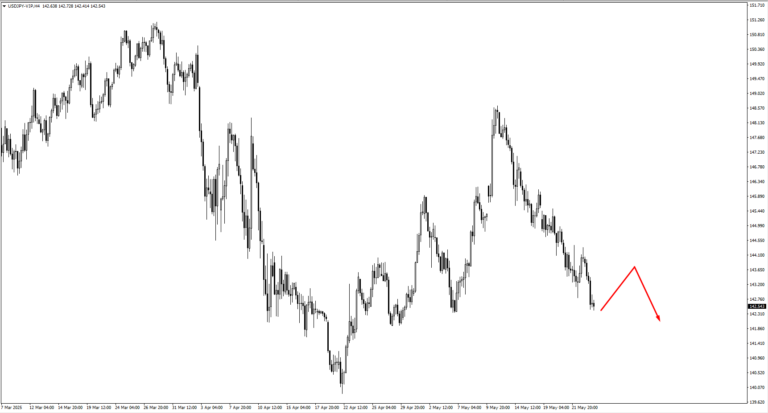
USD/JPY remains range-bound, with price approaching resistance at 143.30 and 143.80. These levels will likely serve as inflection points. A gradual move higher, followed by bearish reversal patterns, could indicate short opportunities, though a sharp, yield-backed rally would suggest caution for sellers.
USD/CHF edged lower but stopped just short of key support at 0.8330. On the rebound, resistance at 0.8255 and 0.8280 may attract bearish attention. The strength of the move into these levels will determine whether selling setups have sufficient edge.
AUD/USD is now trading near monthly highs. The pair has been supported by rising commodity demand and a broadly softer USD. If the market consolidates at these highs, the 0.6460 zone becomes important for fresh bullish price action setups. Bulls will want to see a controlled pullback into that region, followed by confirmation before reengaging.
NZD/USD has broken out of its range. If it pauses to consolidate, 0.5950 will be a level to watch for bullish price action. The Reserve Bank of New Zealand’s upcoming cash rate decision could inject volatility midweek. Traders should be cautious ahead of that release, especially if the pair trades aggressively into resistance without consolidation.
USD/CAD slid just beneath the 1.3920 resistance zone. If the pair retraces higher in the coming sessions, 1.3810 becomes a likely area for bearish setups. The loonie remains sensitive to oil price dynamics, so crude movement may further influence the direction of this pair.
Commodities saw notable movement, with crude oil (USOil) rising sharply from support near 60.20. A break above the 64.534 level could confirm a new bullish leg. However, signs of stalling beneath this resistance may suggest the trend is losing steam.
Gold climbed higher this week, ignoring the previously monitored 3220 level on its way up. Now, traders eye the 3400 resistance zone. If price reaches this level and begins to retrace, the 3305 area could provide a new staging ground for bulls to re-enter. Any retest of that level would need to show clear bullish price action, especially in response to inflation data on Friday.
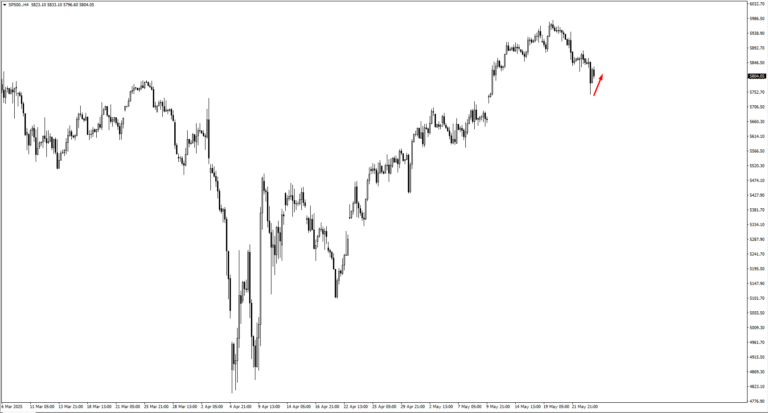
The S&P 500 continues to recover, pushing up from the 5740 zone. If price pulls back again, 5690 would be the key level to watch for fresh bullish setups. A clean move higher could bring 6100 into view as the next target. However, rising Treasury yields and policy noise could make gains harder to sustain. Traders should stay adaptive.
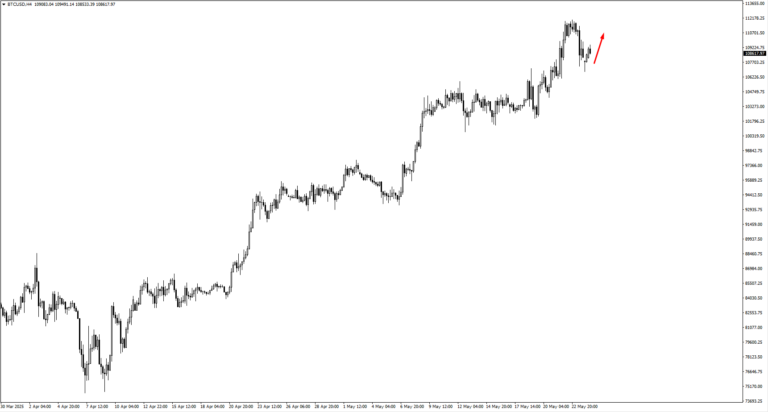
Bitcoin remains elevated, with resistance zones at 113,500 and 123,000 under watch. While institutional demand and risk-on sentiment provide support, price action remains overheated. Patience and confirmation will be essential for those chasing further highs.
Key Events This Week
Wednesday, May 28, brings the first real event of the week. The Reserve Bank of New Zealand is expected to cut its official cash rate from 3.50% to 3.25%. If NZD/USD hasn’t already broken the 0.60238 high earlier in the week, the release could spark a retracement. If the breakout is confirmed, a dovish tone from the RBNZ could accelerate the next leg lower. Either way, traders are watching closely for a clean reaction before stepping in.
On Thursday, May 29, attention turns to the US Preliminary GDP data. Forecasts expect -0.3%, the same as last quarter. It won’t surprise the market, but internal details, especially consumer spending and business investment, could set the tone for Friday’s inflation print. Traders are likely to stay cautious, letting prices digest the number before making big directional bets.
Friday, May 30, is the big one. Bank of England Governor Andrew Bailey speaks in the early session. With GBP/USD testing resistance near 1.3595–1.3670, his tone could make or break a breakout. A hawkish lean might push the pound higher, while a dovish or measured tone may send it back down into range.
Later, the US Core PCE Price Index is released. Forecasted at 0.10%, up from 0.00%, the reading could rekindle concern about sticky inflation. If the number beats expectations, Treasury yields could rise again—and with them, the dollar. Equities, especially growth names, may struggle to hold gains into the weekend.
Finally, China’s Manufacturing PMI drops into the late session, with a forecast of 49.5, just above the previous 49.0. Still below the 50.0 expansion line, the data may weigh on sentiment if it underperforms. Traders watching AUD and NZD will be vigilant for signs of a slowdown in Chinese demand.
It’s a week that starts slow and ends with pressure. For traders, patience will be key. The best opportunities may come late, after the dust settles from a data-heavy Friday.
Create your live VT Markets account and start trading now.
Easing trade tensions and strong Canadian data help keep the Euro stable against the Canadian Dollar
EUR/CAD is currently stabilizing around 1.5607. This is due to a delay in US tariffs on EU imports and strong Canadian retail sales data. The Euro has gained strength as trade tensions eased, with the US postponing tariffs on imports from Europe.
Recently, EUR/CAD fell below the 10-day and 20-day Simple Moving Averages but remains steady. Upcoming speeches from the presidents of the ECB and Deutsche Bundesbank could influence the currency pair, depending on their views about the economy.


