Gold prices have increased in Pakistan, according to recent information.
On Monday, gold prices in Pakistan rose. The price for one gram reached 29,161.19 Pakistani Rupees (PKR), up from 29,032.10 PKR the previous Friday. The price per tola increased to PKR 340,130.40, up from PKR 338,624.70.
Moody’s downgraded the US credit rating to “Aa1,” citing concerns over rising debt. In addition, the US Treasury Secretary announced plans to impose tariffs on non-compliant trading partners. This supports gold’s status as a safe-haven asset.
USD/CAD remains stable around 1.3965-1.3970 despite conflicting signals
The USD/CAD remains steady, staying above the mid-1.3900s due to mixed signals. Weaker oil prices hurt the Canadian Dollar, while worries about a possible US rate cut and a recent credit rating downgrade affect the USD.
The currency pair trades in a familiar range of 1.3965-1.3970 during the Asian session. This is due to various economic factors. Lower oil prices benefit USD/CAD, but selling pressure on the US Dollar limits any strong upward movement.
Market Expectations For Rate Cuts
There are growing expectations for more cuts to Federal Reserve rates, as US economic growth slows and a credit rating downgrade looms. This keeps the US Dollar weaker. Hopes of a potential trade deal between the US and Canada also offer some support to the Canadian Dollar. Monday has no major economic news from the US or Canada, shifting focus to speeches from Federal Open Market Committee members. As oil prices continue to change, they may create short-term trading opportunities for USD/CAD. The Canadian Dollar’s strength depends on Bank of Canada interest rate decisions, oil prices, and the overall economy. Higher inflation, economic growth, and strong oil prices usually boost the Canadian Dollar. Currently, the USD/CAD pair is influenced by various conflicting factors. Its price remains just above 1.3950, suggesting stability in a well-defined range, though tensions lie beneath. During the Asian session, price moves lacked direction, with no dominant factors at play. Falling oil prices often drag the Canadian Dollar down, yet they keep the pair afloat this time. Caution about the US Dollar, driven by concerns over rate cuts and a recent credit rating downgrade, limits significant upward movement. A lot of attention is on the Federal Reserve and their plans for rate cuts for the rest of the year. The market largely expects further easing, especially given recent US data indicating economic slowdown. Slower growth can lessen a currency’s appeal, especially with lowered yield expectations. Consequently, Dollar gains are often sold, even amid weak oil prices, reflecting a shift in market sentiment.Thin Economic Data Calendar
This Monday’s economic data calendar is unusually sparse. With no important reports from Washington or Ottawa, the focus turns to policymakers. Several FOMC officials are set to speak, and the market will closely watch for hints on rate changes and insights into the Fed’s views on labor markets and persistent inflation. Any talk of faster rate cuts or doubts about the economy’s strength may revive bearish bets on the Dollar. Conversely, any statements appearing to push back could raise yields again, causing quick changes in derivative pricing, especially with short-term contracts. On the Canadian side, things are less clear. Hopes for a possible shift in trade discussions between the two countries seem to provide some support for the local currency. However, with oil prices struggling and overall commodity demand not significantly rising, this support feels temporary. So far, we’ve seen muted reactions from positioning data, but short-term traders should stay alert for sudden news regarding energy markets or North American political situations that could change sentiment. In terms of monetary policy, the Bank of Canada remains cautious. Inflation hasn’t decreased quickly enough to decisively call for rate cuts, meaning stronger Canadian economic data could suggest that policy will remain tight for longer compared to the US. If this happens, market positions might shift quickly, and even a slight change toward a more hawkish stance could strengthen the Canadian Dollar, putting pressure back on the 1.3900 support level. For those trading derivatives, we expect short-term volatility to react sensitively to oil price movements and unexpected comments from central bank officials. In the meantime, the spot price may continue to show boundaries, with 1.3900 acting as a key support and the upper range near 1.4000 acting as resistance. Range-focused strategies are favored, especially if implied volatility increases in reaction to changing rate expectations. Create your live VT Markets account and start trading now.The National Bureau of Statistics provides a steady economic outlook based on April’s activity data.
China’s National Bureau of Statistics reported steady economic growth in April, despite external pressures. The economy has continued to grow, with strong foreign trade even in the face of challenges.
The Belt and Road initiative is helping diversify trade. However, China’s internal investment growth is seen as inadequate, requiring better investment efficiency and optimization.
Impact of Low Price Environment on Businesses
The current low price environment may put pressure on businesses and hinder income growth. Policies are in place to promote economic recovery, focusing on increasing demand and restructuring industries. The Australian Dollar rose by 0.28% to 0.6420 against the USD. Factors affecting the Australian Dollar include interest rates set by the Reserve Bank of Australia, iron ore prices, and the state of the Chinese economy. High interest rates usually support the AUD, while lower rates and quantitative easing have the opposite effect. Since Australia trades a lot with China, the Chinese economy significantly influences the AUD, especially with raw materials like iron ore. A positive trade balance helps the AUD, driven by demand for Australian exports. This means making more money from exports than spending on imports, which boosts the value of the Australian currency.Implications for Currency Markets
Recent data shows China has continued to grow economically into April despite outside challenges. Trade activity remained steady even when many expected more downturns. China’s infrastructure initiatives are expanding internationally, but domestic investment is lagging. It seems companies and local governments need to use their funds more effectively. One major concern is that price levels are low. This might seem good for households, but it raises issues for businesses. With prices stable, it’s tougher for businesses to increase profits and wages, leading to weaker consumer spending later. To tackle this, authorities are investing in infrastructure and encouraging production in higher-value sectors. They know they need a strong recovery before external demand decreases again. In currency markets, the Australian Dollar has increased to around 0.6420 against the US Dollar. This slight rise is noteworthy as the AUD is influenced by domestic rate policies and developments in China. Iron ore remains a crucial export; when demand for it rises, so does the Australian currency. As China’s factories keep running, orders for raw materials stay steady. Interest rates in Australia are still high enough to support the currency. While some anticipated earlier rate cuts, there is caution against acting too quickly. We are monitoring how the Reserve Bank balances inflation targets with the impact on household spending. Each meeting provides clues about future rate decisions, which are important for short-term derivatives like swaps and rate futures. Historically, trade surpluses have benefited the currency. When earnings from exports exceed costs of imports, it helps improve the current account, creating demand that lifts the currency. However, this is conditional. If construction in China weakens or industrial activity falls short, it could quickly affect ore futures and currency pricing. We expect these trends will keep influencing interest rate hedges and currency options in the coming cycles. Any changes in China’s policy, whether offering more support or stimulus toward internal demand, will shift sentiment. As volatility increases around these announcements, liquidity could fluctuate, especially near expiration dates and when news breaks. It’s crucial to observe how quickly Chinese stimulus impacts the economy. Whether driven by local governments or central coordination, the effects on commodity imports and manufacturing demand will become apparent in contract positioning. Traders should pay attention to how long this phase of low inflation lasts and whether authorities choose to stimulate through infrastructure spending or support for domestic consumption. Both strategies will affect the performance of Australian exports and, in turn, the sensitivity of the currency. Be prepared to adjust your trading strategies based on these evolving signals. Create your live VT Markets account and start trading now.China Stats spokesperson highlights the growing role of consumption in economic growth amid complex challenges
A representative from China’s National Bureau of Statistics (NBS) said that consumer spending will have a bigger impact on economic growth in the future. They highlighted that, despite facing a tough global situation and internal challenges, there are many positive factors that can help the economy continue to recover.
In April, outside influences increased, but the recovery of the economy continued. The gradual rollout of policies is expected to support this recovery and improve the economy. Earlier reports indicated that China’s industrial output grew by 6.1% in April 2025 compared to the same month last year. This growth was higher than the expected 5.5% but lower than the 7.7% increase from the previous year. Chinese officials remain confident about the economy’s steady growth despite current challenges.
Consumption Driving Future Growth
These comments show that officials believe consumer spending, rather than investment or exports, will play a larger role in future growth. This indicates a shift toward focusing on domestic demand and suggests ongoing government support to increase spending at home. Although there are still global uncertainties and local issues, officials are relying on various structural supports—like policy changes, ongoing reforms, and subsidies—to maintain positive momentum over time. The rise in industrial production by 6.1% year-on-year shows continued strength, especially since it exceeded market expectations. However, it’s important to note that this growth is slower than the previous month, highlighting some underlying issues likely caused by weaker external orders and a sluggish real estate market. Still, the growth beyond expectations indicates that production strength is not completely fading; there’s still some resilience left, even if it is diminishing. Those looking at these indicators should not see the increase in consumer spending as just a prediction but as a sign of future trends. The emphasis from the Bureau is intentional—it signals where new support might be focused. Instead of relying heavily on infrastructure boosts, there may be more initiatives aimed at increasing household income or making credit easier to access, particularly for smaller cities and rural areas.Global Tensions and Local Impacts
The figures from April were released during a time of rising global tensions and low investor confidence. The fact that industrial growth held steady amid these conditions suggests that local issues are starting to improve. Upcoming announcements regarding monetary policy changes—like possible adjustments to interest rates or reserve requirements—will be important to watch, especially for those following short-term trends in commodities and manufacturing. The current narrative indicates stability supported by government confidence; however, this shouldn’t be mistaken for complacency. For those monitoring future contracts, it’s likely that volatility will remain high in the short term, especially in sectors that depend on trade or face significant debt. In the upcoming sessions, trends in retail sales and service-sector PMI data may provide clearer signals. Finally, solid information about stimulus timing and size—especially related to urban development or energy shifts—will be more significant than broad optimistic statements. Once clarity improves, expect clearer direction. Until then, maintaining defensive strategies may be wise, especially for contracts influenced by consumer finance or cyclical electronics. Create your live VT Markets account and start trading now.If trade negotiations fail, US Treasury Secretary Scott Bessent suggests tariffs may rise again.
US Treasury Secretary Scott Bessent mentioned on CNN that President Donald Trump has warned trading partners that negotiations could go back to past terms if they are not conducted in good faith. There are 18 upcoming deals with key trading partners, but no specific timeline has been given.
Currently, the US Dollar Index (DXY) is down 0.32%, sitting at about 100.75. Tariffs are taxes on imports that help local manufacturers compete with foreign products. They are often used alongside trade barriers and import quotas to protect domestic industries.
While both tariffs and taxes raise revenue for the government, they work in different ways. Tariffs are paid at ports of entry for imports, while taxes are paid at the point of sale for goods and services. Taxes target both individuals and businesses, whereas tariffs are the responsibility of those importing goods.
Divergent Views on Tariffs
Economists have varying opinions on the use of tariffs. Some support them as a way to protect local markets and correct trade imbalances. Others caution that tariffs might increase prices and lead to trade wars. In his 2024 presidential campaign, Trump plans to impose tariffs on Mexico, China, and Canada, which accounted for 42% of US imports in the previous year. The revenue from these tariffs is proposed to be used to lower personal income taxes. Bessent’s comments on CNN signaled a strategy more focused on pressure than on partnership. He clearly indicated that if any of the 18 trade agreements are approached without sincerity, previous terms may be restored, reversing negotiations. This serves as a warning that the results will depend not only on economic factors but also on diplomatic considerations. This is not just theoretical talk; it affects the currency markets. The drop of 0.32% in the US Dollar Index to 100.75 shows that political uncertainties often impact the dollar, especially during times of increased protectionism. Even small fluctuations can disrupt models based on stable dollar flows. Let’s talk more about tariffs. Though they’ve been used in trade policy for decades, their current implementation has wider effects. Tariffs essentially add costs to imports, theoretically making local products more attractive. This should ideally boost domestic production. However, this ideal doesn’t match the reality of global supply chains, where few industries operate solely within national borders. The difference between tariffs and taxes is important. Tariffs are imposed at national borders and paid by importers. In contrast, taxes affect end consumers and businesses domestically. This means that the costs from tariffs typically appear earlier in the supply chain and may eventually be passed on to consumers. Now, tariffs are being reframed as a source of state income to lower personal income taxes, which traditionally rely on overall economic activity.Repercussions of Proposed Tariffs
With Trump suggesting broad tariffs on imports from Mexico, Canada, and China—countries that made up almost half of US imports in 2024—the impact could be significant. Importers have to choose between accepting lower profits or passing on higher costs to consumers. This will likely impact sectors such as electronics, automotive, and agriculture, which rely heavily on imports from these countries. Economists have differing opinions for a reason. Some believe in protecting vulnerable domestic sectors, especially those considered crucial. On the other hand, critics argue that tariffs distort prices and provoke retaliation, which can choke off trade and hurt global GDP. They often reference past instances, particularly after 2008, when similar measures led to reduced global trade instead of growth. These events are not passive; they influence hedging strategies, trading spreads, and volatility expectations. Traders dealing with currencies and rate derivatives need to adjust their strategies for an administration that prioritizes assertive negotiation tactics. It’s important to note that while no dates have been set for the mentioned 18 deals, the time for adjusting pricing structures will be limited once announcements are made. Relying on past trade relationships could quickly become outdated if conflicts arise. Current messaging from Washington suggests that predictability is not the aim, with flexibility and pressure being the preferred approaches. If these tariff proposals become official, particularly the idea of using tariff revenue to offset income taxes, we may enter a system not seen since the early 20th century—one where trade duties support domestic relief. This could lead to significant changes in multilateral trading systems, especially for entities that have relied on stable tax structures and open import channels. Create your live VT Markets account and start trading now.Dividend Adjustment Notice – May 19 ,2025
Dear Client,
Please note that the dividends of the following products will be adjusted accordingly. Index dividends will be executed separately through a balance statement directly to your trading account, and the comment will be in the following format “Div & Product Name & Net Volume”.
Please refer to the table below for more details:

The above data is for reference only, please refer to the MT4/MT5 software for specific data.
If you’d like more information, please don’t hesitate to contact [email protected].
Week Ahead: Moody’s Downgrade Rattles Market Confidence

The trading week commenced under a cloud of fiscal unease after Moody’s became the final major credit rating agency to lower the United States’ sovereign rating, shifting it from AAA to Aa1.
Although the revised rating still signals strong creditworthiness, the symbolic impact is substantial. For decades, US Treasuries have served as the gold standard of global safety. It is an almost risk-free benchmark underpinning worldwide credit markets. That status is now being called into question.
Investor sentiment turned cautious in response. After-hours trading saw yields on the 10-year U.S. Treasury note climb to 4.48%, as risk premiums adjusted. The SPDR S&P 500 ETF dipped by 0.4%, a relatively modest decline, yet underscoring simmering concern beneath the surface. Markets are not yet in turmoil, but the erosion of trust has begun.
The rationale behind the downgrade is clear. The US national debt is forecast to grow from 98% of GDP in 2024 to 134% by 2035, while the annual budget deficit could swell from $1.8 trillion to $2.9 trillion over the same period. Compared with similarly rated economies, these figures are significantly elevated, prompting scrutiny over the country’s premium status.
The Treasury market, already under strain from increased issuance and declining foreign appetite, now faces further headwinds. Countries that once absorbed U.S. debt uncritically are reassessing. Broader shifts in global trade dynamics, tariff conflicts, and the gradual emergence of alternative reserve currencies continue to erode America’s central role in the global financial order.
For the everyday borrower, the implications are tangible. Treasury yields influence everything from mortgage rates to student loan terms. If institutional traders demand greater returns for the risk of lending to the US, banks and lenders will inevitably pass those costs down to households and businesses. Even a small uptick in yield curves can translate to hundreds of billions in added debt servicing costs over time. The result is tighter consumer credit, pricier capital, and diminished room for government stimulus during future downturns.
Politically, the downgrade highlights Washington’s persistent dysfunction. Moody’s had issued warnings as early as November, citing lawmakers’ repeated failure to resolve debt ceiling impasses or enact lasting fiscal reforms. The removal of Speaker Kevin McCarthy in 2023 and extended Congressional paralysis laid bare the governance challenges. Uncertainty surrounding the Federal Reserve’s independence has added fuel to the fire. Remarks by former President Trump regarding potential changes to central bank leadership have unsettled global markets.
Meanwhile, fiscal policy remains contradictory. Trump’s proposal to extend the 2017 tax cuts would slash government revenue by $4 trillion over the next decade. Even with drastic reductions in Medicaid and food assistance spending, the plan is projected to add $3.3 trillion to the national debt. The so-called Department of Government Efficiency, a flagship initiative, has reportedly missed its initial objectives.
In this environment, the US risks drifting into a debt spiral. As interest payments rise, the share of the federal budget allocated to debt servicing grows, leaving less room for essential spending on infrastructure, education, and healthcare. Traders are already reacting. Bond yields are climbing. Equity markets are wobbly. Even the dollar, though still dominant, faces pressure as other economies begin to decouple from traditional US-centric models.
The coming days could prove pivotal. Should the 10-year yield surpass 4.5%, increased equity market volatility is likely. Defensive sectors such as healthcare and utilities may see inflows, while tech shares, often sensitive to interest rate changes, could suffer.
Market Movements This Week
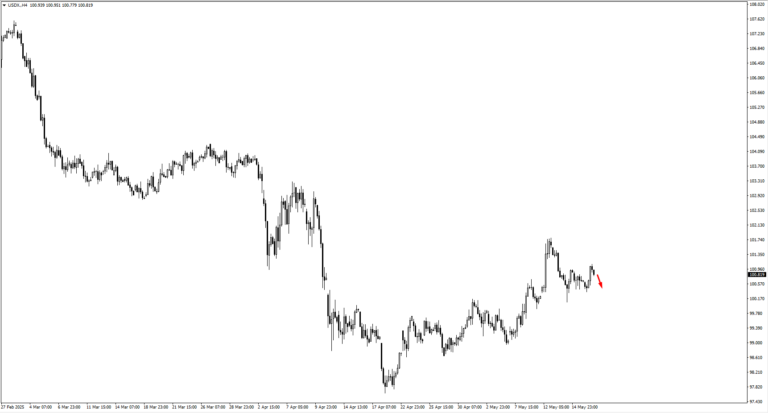
The USD Index (USDX) remains delicately poised. Having fallen towards the 100.60 mark, the dollar now faces an important juncture. A rebound could take it to 101.40 or 102.40, but sentiment needs to stabilise first. A break lower could see the 99.80 region tested, which may trigger wider ripples across risk assets. With US credit quality now under examination, the dollar’s safe-haven credentials are on trial.
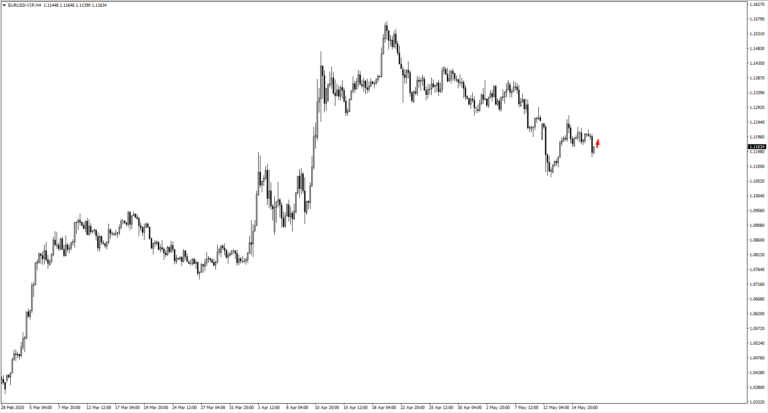
EURUSD is approaching the 1.1195 resistance level. A failure to breach this zone may lead to another test of 1.1105. A sustained rise beyond 1.1300 could signal broader shifts, possibly tied to softer US data or revised rate expectations.
GBPUSD is staging its attempt at higher ground. The 1.3320 level marks the next technical ceiling. If sellers defend this range, bulls may regroup at 1.3215. With UK CPI data due midweek—forecasted at 3.30% y/y compared to the previous 2.60%—volatility in the pair is likely, especially if inflation surprises to the upside. The market is already bracing for a possible rate recalibration.
USDJPY continues its ascent but remains cautious near the 145.00 level. A slide toward 144.65 or 143.80 is plausible if market sentiment sours or yields ease. The yen’s haven appeal remains muted but could return swiftly amid geopolitical shocks.
USDCHF, meanwhile, is trapped in a range. The pair is hovering close to key levels, with a possible bullish bounce eyed at 0.8300. Broader sentiment toward Europe’s monetary trajectory and risk flows into the franc will shape its next steps.
AUDUSD found its footing at 0.6370 and now eyes resistance at 0.6425. This week’s Australian cash rate decision looms large, with markets anticipating a cut to 3.85% from 4.10%. Should that scenario unfold, a retracement back toward 0.6295 could materialise. But if support holds amid a dovish surprise, the Aussie might find breathing room to stabilise.
NZDUSD has bounced from 0.5860, currently testing 0.5905. Failure here could send the kiwi back toward 0.58459. Commodity sentiment and global growth forecasts remain key drivers.
USDCAD continues its slow rotation. If the pair drifts lower, price action near 1.3940 or 1.3910 could offer renewed support. On the upside, resistance is being eyed at 1.4055 and potentially 1.4140. The Canadian dollar remains tethered to oil’s performance, which brings us to energy markets.
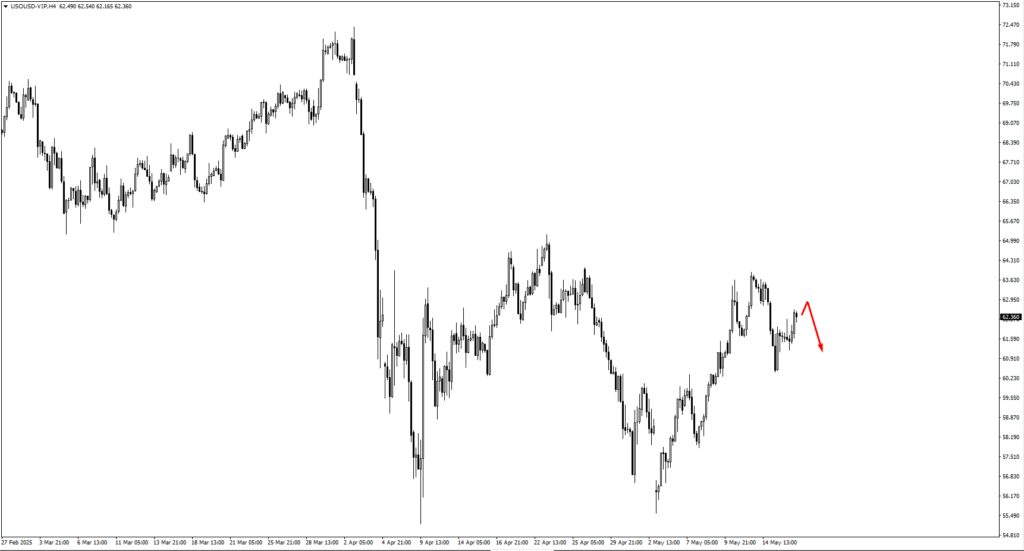
US crude oil (USOil) is stuck in a narrow range. A move toward 63.05 may invite selling pressure. Despite geopolitical tensions, lacklustre demand is keeping prices in check for now.
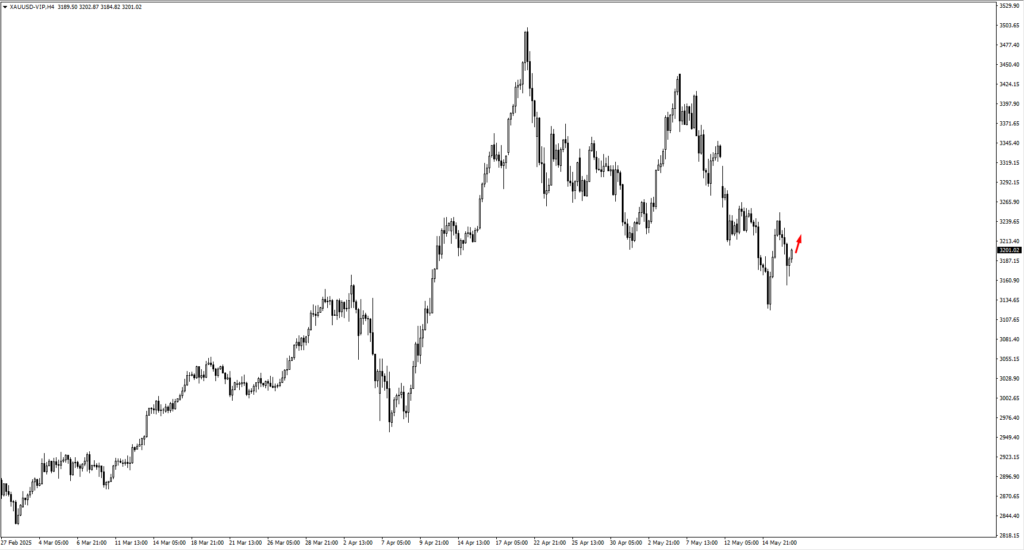
Gold rebounded sharply from $3,154 and is now hovering near $3,210. A clean move through this level may open the door for another test of $3,270, while failure could send it back toward $3,120.72. Its appeal as a hedge remains intact but is complicated by the dollar’s uncertain direction.
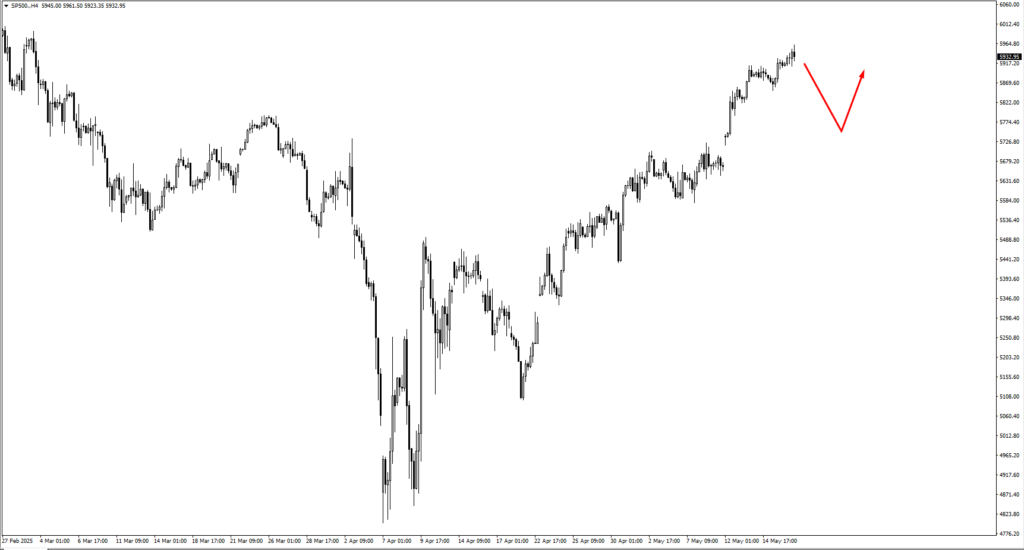
The SP500 is treading carefully after its recent rally. Bullish setups may emerge near 5740 or 5690, but if equities push higher too quickly, a reaction at 6100 could limit upside. With yields rising and the fiscal backdrop turning uncertain, the broader equity market may lack the momentum for a breakout, unless earnings or economic data offer fresh support.
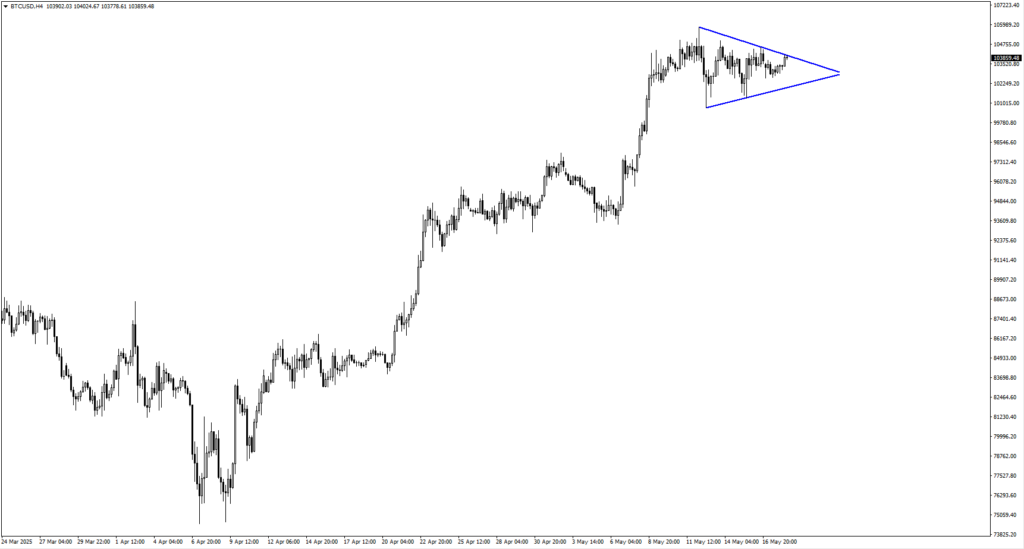
Bitcoin remains tightly coiled just under $100,000. Support at 99,400 and 96,600 will be crucial if prices dip. A breakout would shift attention to new record highs. Traders remain hopeful, but wary.
Natural Gas continues to retreat after peaking at 3.45, now nearing 3.02. While this level might offer support, subdued demand and healthy inventories suggest any rally may be short-lived.
Key Events This Week
On Tuesday, May 20, the market turned its attention toward the Pacific and North America, with two releases drawing early focus. Australia’s cash rate decision came in with a forecast of 3.85%, down from 4.10% previously. This anticipated rate cut reflects increasing pressure on the RBA to ease financial conditions amid a slower domestic economy. Meanwhile, Canada’s Median CPI y/y was forecast to hold steady at 2.90%, matching the prior figure. Any deviation from this inflation forecast would challenge the Bank of Canada’s stance, but with no surprises expected, the pair held ground, consolidating as markets awaited structural direction. Tuesday’s movements were light but preparatory—zones were marked, and momentum traders kept their entries tight.
On Wednesday, May 21, the spotlight shifted to the United Kingdom, where the CPI y/y was forecast to jump to 3.30%, up from 2.60% previously. This sharp expected rise underscores the lingering stickiness of inflation in the UK economy, particularly in core services. However, with broader economic growth faltering and labour conditions beginning to cool, a spike in inflation might not translate directly into rate hikes. Should the actual figure match or exceed the forecast, short-term momentum may favour GBP strength—but upside would likely be capped without a broader shift in the BoE’s tone.
On Thursday, May 22, a wave of PMI data swept through Europe and the United States, offering a barometer for economic sentiment across sectors. Germany’s flash manufacturing PMI was forecast at 48.8, slightly improved from 48.4 previously, while services PMI was expected to rise to 49.6 from 49.0. Though both remain in contraction territory, the marginal increase hinted at a stabilising tone. In the UK, flash manufacturing PMI was forecast at 46.2 (up from 45.4) and services PMI at 50.0, up from 49.0. This would signal a tentative return to growth in services, though manufacturing continues to lag.
Lastly, the U.S. released its own PMI flash readings: manufacturing expected at 49.9, down from 50.2, and services slightly lower at 50.7 from 50.8. These softer forecasts suggested the Fed may remain in a holding pattern. Thursday shaped up as the most technically active day of the week—tight ranges began to widen, and macro narratives re-entered the charts.
Create your live VT Markets account and start trading now.
Chinese officials claim the economy is steadily improving despite various challenges and pressures.
An official from China’s National Bureau of Statistics stated that the economy is growing steadily despite current challenges. Demand for productivity is increasing, and employment remains stable.
The economy is facing obstacles, yet it continues to develop positively. China is also working to diversify and strengthen trade with countries involved in the Belt and Road initiative.
Recent data from April shows that China’s industrial output rose by 6.1% from the previous year, exceeding the expected 5.5%. However, this is a decrease from March’s growth of 7.7%. In contrast, China’s apparent oil demand fell by 5.6% year-on-year in April.
The report from the National Bureau of Statistics indicates a trend that, while rocky, still provides some reassurance. Growth is slowly increasing. Employment levels are close to targets. Furthermore, there are efforts to enhance trade connections, especially through the Belt and Road initiative. This strategy helps strengthen resilience beyond domestic factors, even as internal consumption fluctuates.
Industrial data from April shows something important. Output grew more than expected, hitting 6.1%, which was above the forecast of 5.5%. This may indicate that manufacturing is picking up momentum. However, the decline from March’s 7.7% suggests inconsistency. While factories are active, growth is not uniform. There’s a steady rhythm, but it still varies.
On the other hand, oil demand presents a different picture. It decreased by over 5% during the same month, indicating that either there is enough inventory or that some industrial areas are slowing down. Such a drop typically does not align with a robust economy. It raises caution for sectors heavily reliant on fuel, such as transportation, construction, and machinery production. There may also be seasonal changes, such as businesses tightening up before a new quarter.
From our perspective, this situation calls for careful assessment. The contrast between increasing output and falling energy demand is concerning. One positive trend does not guarantee a broader recovery, especially when key commodities are declining. Strategies that depend heavily on raw materials should be re-evaluated due to this decline in energy demand. This does not necessarily mean weakness across all sectors, but there is uncertainty about sustained demand overall.
Given the data, it’s reasonable to expect that positions linked to commodities reflecting industrial activity, especially energy consumption, may require adjustments. Taking a more active approach to hedging or adjusting expiration dates towards the end of summer may help mitigate risks. Volatility related to trade could resurface, especially with new deals or policy changes from Belt and Road partners.
The drop in apparent oil demand also suggests that traders should consider sectors sensitive to fuel imports or logistical issues. If reduced consumption continues into May, long-term investments in refinery margins or maritime transport could be at risk. This situation may not reverse quickly, so it is better to manage risk carefully now rather than react hastily later.
It’s important to note that even though industrial data exceeded expectations, the gap between market predictions and actual results is narrowing. This suggests that analysts are adjusting their forecasts rather than expecting major increases. For volatility exposure, this could mean more minor fluctuations rather than large swings.
Where policy remains supportive and export routes remain open, we’ll identify which sector tends to diverge. Our focus will be on trends, not just breakpoints. For now, any adjustments should happen gradually and thoughtfully.
Christine Lagarde discusses the decline of the US dollar, linking it to uncertainties in US policies during an interview.
Christine Lagarde, the President of the European Central Bank (ECB), spoke about the changing value of the dollar in uncertain times, noting its unexpected drop. This decline comes from doubts about U.S. policies among some financial market participants.
She pointed out that Europe is seen as a stable economic and political region, even with ongoing challenges to the rule of law and trade in the U.S. This view likely supports the Euro, which has slightly increased, with EUR/USD trading close to 1.1175.
Key Functions of the European Central Bank
The ECB, located in Frankfurt, Germany, oversees monetary policy and interest rates for the Eurozone. Its goal is to maintain price stability and keep inflation around 2%. The ECB uses methods like adjusting interest rates and, during crises, implementing Quantitative Easing (QE). QE generally weakens the Euro as it involves buying assets from banks. On the other hand, Quantitative Tightening (QT) happens when economies recover and inflation rises. QT means stopping bond purchases and halting reinvestments, which usually strengthens the Euro. These strategies are essential for the ECB to manage the Eurozone economy effectively. Lagarde’s remarks suggest that geopolitical views, not just economic data, can influence currency markets in ways that models may not fully recognize. When she mentioned the dollar’s unexpected weakness, she indicated a loss of confidence—not necessarily in the dollar itself, but in the political systems that guide it. This kind of shift takes time. It reminded us that currencies also depend on belief systems, not just statistics. Her comments on doubts about U.S. policy are important. We see this as a sign that confidence is shifting back toward Europe, even with its own challenges. Right now, Europe appears to be the more stable option, especially given the recent turmoil in U.S. institutions. This perception, backed by slightly better Eurozone data, has led to increased interest in the Euro, which is now trading in the 1.1175 range against the dollar. While it’s not a strong rally, it shows noticeable improvement.Eurozone Economic Strategies and Their Impact
The European Central Bank focuses on maintaining price stability using various tools to achieve a 2% inflation target. Typically, rate adjustments are its primary method. Higher rates usually draw in capital, enhancing the Euro’s value. When the economy needs stimulation, the ECB actively engages in asset markets. Through QE—essentially a liquidity boost—they inject euros into the economy by purchasing financial assets. However, this strategy can reduce the Euro’s value due to the increase in currency circulation. Recently, though, we’ve seen a reduction in QE. As inflation nears its target, the ECB’s approach has shifted. They’re no longer making large reinvestments, and bond holdings are starting to decrease—a process known as Quantitative Tightening. Fewer bonds are being rolled over, which typically leads to a stronger Euro. When spending slows and rates remain high, the Euro often benefits from this tighter environment. Currently, multiple factors are in play: global trust issues, a cautious ECB nearing the end of its reinvestment era, and a Euro gaining slightly more attention. These shifts are crucial moving forward, as changes in policy can create and remove opportunities quickly. Traders dealing with derivatives should closely monitor not just usual price and rate indicators, but also timing. If ECB tightening continues—especially during stable market conditions—the Euro might gain more solid ground. The opportunity for options that benefit from low-volatility increases may not last long. Additionally, it’s crucial to watch developments in the U.S., especially regarding fiscal discussions and Federal Reserve policy clarity. If confidence in the U.S. weakens while the ECB tightens and Eurozone indicators improve, we could see a quick tilt toward the Euro. The market will pick up on this before it makes headlines. Being prepared and responsive to data is more critical than ever. With Lagarde emphasizing messages of stability, it’s important to pay close attention to shifts in sentiment—especially in key forward-looking metrics, such as five-year breakevens and cross-asset correlations. Planning derivative trades ahead of these points, especially considering the yield spreads between Bunds and Treasuries, could offer better insights. Increasingly, positioning data shows more participants beginning to invest in Euro-related assets. This doesn’t mean it’s without risk. Trade volumes and spikes in volatility could still surprise us, especially if central bank comments or political events change the outlook. For now, though, there is some actionable upside for the Euro while longer-term policy trends develop. We are positioning ourselves with that in mind. Create your live VT Markets account and start trading now.S&P 500 E-mini futures trade below 5947.0, signaling bearish setups with identified downside targets
Today’s S&P 500 analysis by tradeCompass uses volume profile, liquidity pools, and VWAP to determine market direction. Currently, the market is bearish, with prices below 5947 and a prevailing price currently at 5931.00, which is about a 0.75% drop from Friday’s close.
In this bearish trend, the market is trading below the critical level of 5947, suggesting a negative outlook. A short entry zone is identified around 5933–5934, near today’s VWAP. Bearish targets are set at important liquidity zones: 5916.0, 5908.5, 5900.0, 5864.0, and 5838.0, based on volume profile and VWAP.


