UK’s PPI core output for December shows a month-on-month decrease of 0.1% compared to zero
The UK’s Producer Price Index (PPI) Core Output for December dropped by 0.1% from the previous month, remaining steady at 0%. This decline shows how producer prices have changed.
In the currency markets, the EUR/USD decreased to 1.1700 after a recent rise, while GBP/USD stayed below 1.3450 following mixed UK inflation data. The annual CPI inflation in the UK increased to 3.4% in December, up from 3.2% in November, with the core CPI also meeting expectations at 3.2%.
Gold uptrend continues, hitting record highs as investors turn to safer assets
Gold has reached new highs for the third day in a row due to global uncertainty. Fears of a trade war and geopolitical risks, particularly President Trump’s tariff threats against eight European nations regarding Greenland, are boosting gold’s appeal as a safe investment.
Even though the US Dollar has seen a slight recovery, gold prices remain below $4,900 because of overbought conditions. These conditions, along with anti-risk sentiment and the “Sell America” trade, continue to push gold prices upward. Market participants are awaiting US inflation and GDP growth data to guide the Federal Reserve’s policy decisions.
Gold And Bond Yields
Political tensions over Greenland have caused a rise in bond yields, further benefiting gold. A trend of moving away from the dollar increases uncertainty, making gold more appealing as the US Dollar weakens. Additionally, the prospect of fewer interest rate cuts by the Fed in 2026 offers little support for the dollar. Technical signals indicate that gold’s upward trend may continue. The Moving Average Convergence Divergence (MACD) and a positive Relative Strength Index (RSI) show ongoing buyer interest despite overbought conditions. Traders are likely to react positively, which could limit any potential pullbacks. The US Dollar is showing mixed results against major currencies, remaining strong against the Swiss Franc. At the end of 2025, there was a strong push towards safety, driving gold prices to nearly $4,900 due to US-Europe tariff threats over Greenland. As we move into January 2026, gold has slightly cooled and is stabilizing around $4,850. This pullback presents an important decision point for traders in the coming weeks.US Dollar And Strategy
The “Sell America” trade that was prevalent in late 2025 seems to be slowing down, as the US Dollar Index has bounced back by 1.5% in the new year. This recovery is bolstered by last week’s hawkish minutes from the Federal Reserve meeting and a decrease in the VIX from nearly 35 in December to about 22 now. Recent data indicates that inflows into gold-backed ETFs have slowed for the first time in six months, hinting at some profit-taking by large funds. Given the overbought conditions at the end of last year, purchasing futures outright carries a significant risk of a deeper correction. A smarter approach may be to buy call options on gold, such as options with a $4,950 strike price expiring in March 2026. This strategy lets us take part in any potential rally while setting a clear limit on our possible losses if the dollar keeps strengthening. Since implied volatility in gold options has decreased from its peak in December 2025, selling out-of-the-money puts could also be an effective way to generate income. For instance, selling a February 2026 put with a strike price around the old support level of $4,700 aligns with the belief that declines will be limited. This strategy profits from time decay and the expectation that gold won’t drop sharply in the near future. Create your live VT Markets account and start trading now.NZD/USD remains strong above 0.5800 amid rising fears of a ‘Sell America’ trade
NZD/USD has increased to about 0.5835 during early Wednesday trading in Europe. This rise comes after Donald Trump announced new tariff threats against Europe, sparking “Sell America” sentiment among traders.
Due to these tariff threats, the US Dollar has weakened compared to the New Zealand Dollar. Traders are also looking forward to Trump’s upcoming speech at the World Economic Forum.
Trump’s Tariff Announcements
Trump has introduced 10% tariffs on eight European countries over issues related to Greenland. He mentioned that these tariffs could rise to 25% if a deal is not reached by June 1. This situation raises concerns about ongoing uncertainty and strained relations between countries. The Consumer Price Index (CPI) report from New Zealand, expected on Friday, will also be closely watched. Several factors affect the value of the NZD, including China’s economic performance and dairy prices. The Reserve Bank of New Zealand’s interest rate decisions aim for inflation between 1% and 3%. Macroeconomic data, how investors feel, and risk perception all play a role in the NZD’s performance. The currency usually does well when the market is confident and struggles during uncertain times.Challenges Facing The Dollar And Kiwi
This time last year, in January 2025, the “Sell America” narrative had a strong impact on trading due to tariff threats. This trend continued throughout the year, leading to a weaker dollar. Now, with NZD/USD trading at around 0.6120, the situation has grown more complex. The dollar’s future is now less clear than it was for much of 2025. Recent data indicated that US GDP growth for Q4 2025 slowed to just 1.5%. Meanwhile, the Consumer Price Index for December remained high at an annual rate of 3.2%. This economic backdrop limits the Federal Reserve’s options and adds uncertainty to the dollar’s direction. Conversely, the Kiwi faces its own difficulties, which may prompt caution from traders. New Zealand’s Q4 2025 inflation rate recently came in at 2.1% year-over-year, within the RBNZ’s target but raising concerns about potential interest rate cuts later this year. Additionally, reports show that industrial production is slowing in China, a key export market for New Zealand. The struggle between a slowing US economy and a possibly dovish RBNZ hints that NZD/USD might lack a clear direction. Traders should consider options strategies that benefit from spikes in volatility without focusing on a specific trend, like long straddles. This approach is particularly useful ahead of the impending employment data from both countries. We experienced a similar situation during the 2018-2019 period when trade policy discussions influenced the markets. During that time, the initial dollar weakness was often limited as concerns about global growth—a factor that negatively impacts the Kiwi—came to the forefront. This historical trend suggests that any additional strength in NZD/USD might be hard to maintain. Create your live VT Markets account and start trading now.USD/CAD pair hovers near weekly low of 1.3815 amid US-EU tensions
The USD/CAD pair is trading around 1.3835, close to its week low of 1.3815, as traders await US President Donald Trump’s speech at the World Economic Forum in Davos. Recent tensions between the US and EU, particularly following the US’s 10% tariffs on several EU countries due to the Greenland dispute, have limited movement in the pair.
The US Dollar Index is near 98.50, suggesting cautious trading. If the price falls below 1.3800, it may drop further to support at 1.3700. Resistance is noted at the 50% Fibonacci retracement level of 1.3893. If this level is broken, the 61.8% Fibonacci level at 1.3952 could be the next target.
Technical Indicators And Market Sentiments
The Relative Strength Index sits at 49, showing a balanced market. The 20-Exponential Moving Average is just above the current price at 1.3837, limiting any rebound. US Treasury Secretary Scott Bessent has advised refraining from retaliation over the tariffs, urging patience for a resolution. President Donald J. Trump has been in office since January 2017 and was re-elected in January 2025. He was previously a businessman and TV personality affiliated with the Republican Party. This time last year, in January 2025, the market was stagnant ahead of the Davos speech. Concerns over US-EU tariffs regarding Greenland kept USD/CAD stable around 1.3835, setting the stage for future volatility. After Trump’s speech, the US increased tariffs to 15% by March 2025, prompting the EU to impose tariffs on American goods. This trade dispute caused the US Dollar Index (DXY) to drop from 98.50 to below 95 by the end of Q1 2025. As expected, USD/CAD fell below 1.3800 and tested the 1.3700 support level.Future Prospects For USD/CAD
Now, in January 2026, the diplomatic situation has improved, but economic effects linger. Supply chain issues from the 2025 dispute have kept US core inflation stubbornly at 3.4%, as reported in last week’s CPI update. This is pushing the Federal Reserve to maintain a hawkish approach, unlike the Bank of Canada, which is adopting a more neutral stance. Due to the different monetary policies, USD is expected to strengthen against CAD in the upcoming weeks. Traders may consider purchasing call options on USD/CAD with a strike price around 1.3950, expecting a return to levels prior to the 2025 tensions. Implied volatility is higher than in 2024, reflecting the market’s awareness of last year’s tariff disruptions. Create your live VT Markets account and start trading now.The video analyzes Elliott Wave theory after a decline of over 350 points in Nifty and Bank Nifty.
The content explores how Elliott Wave Theory can predict a drop of over 350 points in Nifty and Bank Nifty. It analyzes the decline, focusing on wave patterns, support and resistance areas, and possible future trends. Traders receive advice on positioning themselves based on these forecasts.
Related topics include how different currencies are affected by factors like oil price shifts, UK inflation, and significant global events such as world leaders’ speeches. This provides insights into currency movements in pairs like EUR/CAD, EUR/USD, and GBP/USD.
Editor’s Picks and Market Movements
The editor’s picks summarize movements in currency and commodity markets. They highlight dips in EUR/USD and GBP/USD, as well as corrections in cryptocurrencies like Bitcoin and Ethereum. Predictions about BNB performance and Greenland tariffs are also discussed, setting the stage for future market changes. Additionally, there are overviews of the top brokers for 2026, featuring the best options for trading currencies, CFDs, and gold. The text emphasizes the importance of thorough research before investing in open markets, along with a warning about the risks and potential losses involved. The disclaimer clarifies that the opinions shared do not count as investment advice. After the recent 350-point drop, we recognize this as a major event within the current Elliott Wave framework. Derivative traders should focus on the crucial support level for the Nifty, which we pinpoint at around 24,500. The India VIX has risen over 15% this week, reaching nearly 18.5, indicating a significant increase in expected volatility that options traders can use. One possible scenario is that this decline represents a corrective fourth wave, with a final fifth wave rally likely in the coming weeks. If the market stabilizes above key support, traders might think about buying call options or setting up bull call spreads. This view is supported by strong industrial production figures for December 2025, which exceeded expectations and indicate economic strength.Market Strategies and Global Factors
On the other hand, this drop might signal the start of a larger downtrend, so we need to be ready for a bearish outcome. A clear break below the 24,500 support level would challenge the bullish outlook, prompting traders to consider put options for protection against losses. We’re also keeping an eye on Foreign Institutional Investor (FII) activity, which has shown a net outflow of over ₹8,000 crore in the last ten trading sessions—a bearish sign not seen since last year. A similar sharp correction occurred in the third quarter of 2025, followed by a period of high volatility before the market found its direction. This suggests strategies like long straddles or strangles could help traders benefit from large price movements, regardless of direction. The key is positioning for the volatility expansion that typically follows such sharp market shifts. Global factors are important too, especially with the Reserve Bank of India’s policy meeting coming up next month. Any unexpected hawkish remarks—especially after the European Central Bank hinted at pausing its easing cycle last week—could act as a major trigger. Therefore, maintaining hedged positions or having a clear risk management plan will be essential for navigating the next market moves. Create your live VT Markets account and start trading now.Gold prices in Saudi Arabia have recently increased, according to gathered information.
Gold prices in Saudi Arabia rose on Wednesday, according to FXStreet’s data. The price of gold hit 586.10 Saudi Riyals per gram, up from 573.49 SAR the day before.
The cost for a tola of gold went up to 6,836.16 SAR from 6,689.08 SAR the previous day. Here are other key prices: 5,861.00 SAR for 10 grams and 18,229.27 SAR for a troy ounce.
Price Calculation Methodology
FXStreet calculates these prices by converting international rates into local currency, updating them to reflect market conditions. The prices are for reference only, and local variations may occur. Gold is often seen as a good store of value and a means of exchange, particularly during economic uncertainty. It is favored as a hedge against inflation and currency decline because it isn’t tied to any specific government or issuer. Central banks are significant buyers of gold. In 2022, they increased their reserves by 1,136 tonnes. Countries like China, India, and Turkey continue to grow their gold stockpiles. Gold prices usually decrease when the US dollar and US Treasuries strengthen. Additionally, geopolitical tensions and interest rates can impact gold prices.Global Economic Outlook
Gold’s rise to SAR 586.10 per gram indicates a shift towards safe-haven assets. This change points to increasing concerns about the global economy in the first half of 2026. Traders should recognize this as part of a broader trend rather than just a daily occurrence. This trend is largely driven by expectations that the US Federal Reserve will start lowering interest rates by the second quarter. After a prolonged period of persistent core inflation in 2025, recent data indicates a cooling trend that might allow the central bank to ease its policies. A weaker US dollar, which has fallen nearly 2% against other currencies since the start of the year, could also boost gold prices. Strong support from institutional investors plays a significant role as well. Following central banks’ record purchases in 2022, recent data shows this trend continued into 2025, with emerging market banks adding around 900 tonnes to their reserves. This steady demand helps maintain a solid price floor for gold and limits potential losses for the precious metal. For derivative traders, this market environment suggests that taking long positions through call options on gold futures or major gold ETFs could be a wise strategy. Purchasing calls with expirations of three to six months allows traders to benefit from expected price increases due to shifts in monetary policy. A bull call spread could also be employed to reduce the entry cost while managing risk. Create your live VT Markets account and start trading now.Recent data shows that gold prices in the Philippines have increased.
Gold prices in the Philippines rose on Wednesday, according to data from FXStreet. The price per gram increased to 9,277.47 Philippine Pesos (PHP) from 9,071.85 PHP the previous day.
The cost per tola went up to PHP 108,210.60, up from PHP 105,812.30. A troy ounce was priced at PHP 288,562.10. These prices reflect international rates adjusted for the local currency and are updated daily.
Gold As A Safe Haven
Gold has always been a reliable store of value and is considered a safe haven during tough times. It protects against inflation and currency devaluation. In 2022, central banks—the largest gold holders—added 1,136 tonnes to their reserves. Countries like China, India, and Turkey are quickly increasing their gold stocks. Gold prices often move in the opposite direction of the US Dollar and US Treasuries. A falling Dollar can cause gold prices to rise, making it a popular choice during uncertain times. Gold prices can vary due to geopolitical issues or fears of a recession. Generally, lower interest rates boost prices, while higher rates can lower them. Most movements in gold prices depend on the US Dollar’s performance, as gold is priced in Dollars. The recent rise in gold’s price to 9,277.47 PHP per gram should be monitored closely. This trend is not just a local issue; it shows the metal’s strength in the global market. This upward movement suggests underlying global factors are supporting prices.Central Banks And Gold
Central banks continue to buy gold aggressively, a trend that’s expected to grow until 2025. Following record purchases reported by the World Gold Council in previous years, countries are adding to their reserves as a hedge against currency fluctuations. This trend provides strong support for gold prices, suggesting that price dips may be seen as good buying opportunities. This action is related to expectations about interest rate policies and the US Dollar’s strength. At the end of 2025, the market began favoring a more accommodating monetary policy, putting pressure on the Dollar. Since gold is priced in Dollars, a weaker Dollar usually leads to higher gold prices. Geopolitical uncertainties also play a significant role, leading investors to seek safe assets. After strong stock market performance throughout 2025, there are signs of a shift toward more defensive strategies. The CBOE Volatility Index (VIX) has increased from its lows in late 2025, showing growing investor caution. For derivatives traders, this environment suggests exploring strategies that benefit from rising prices and increased volatility. Buying call options can provide potential rewards with minimal risk, while selling put options below the current market price might be an appealing way to earn premium, relying on strong fundamentals to prevent sharp declines. Create your live VT Markets account and start trading now.Gold prices rise today in the United Arab Emirates, according to financial data
Gold prices in the United Arab Emirates rose on Wednesday, according to FXStreet. The price per gram increased to 574.53 AED, up from 561.64 AED on Tuesday.
The price for a tola reached 6,701.27 AED, compared to 6,550.89 AED the day before. FXStreet adjusts international prices to AED, providing updates daily based on market rates.
Gold As A Safe Haven Asset
Gold is a favored investment because it has historically preserved value and is seen as a safe haven in uncertain times. It acts as a shield against inflation and currency decline, offering stability when other investments struggle. Central banks are the biggest holders of gold. In 2022, they bought 1,136 tonnes, worth about $70 billion, which was the largest annual purchase ever. Countries like China, India, and Turkey are actively increasing their reserves. Gold prices are affected by many factors, including geopolitical tensions, fears of recession, and the strength of the US Dollar. Since gold doesn’t yield interest, it performs better when interest rates are low. A strong dollar can lower gold prices, while a weak dollar can push them higher. This week, gold prices have shown an upward trend, reflecting changes in international markets. This temporary strength hints that factors are beginning to support precious metals. For derivative traders, this may indicate the beginning of an upward trend, making call options or long futures contracts appealing. This price movement responds to the changing outlook on U.S. interest rates following the aggressive rate hikes that concluded in 2025. The CME FedWatch Tool now shows a greater than 70% chance of a Federal Reserve rate cut before this quarter ends. Lower interest rates reduce the opportunity cost of holding non-yielding assets like gold, making it more attractive.US Dollar And Gold Prices
As a result, the US Dollar Index (DXY) has weakened, recently trading below 101 after staying higher for most of last year. A weaker dollar typically means gold is cheaper for investors using other currencies. This trend gives an additional boost to gold prices in the coming weeks. We should also consider the ongoing strong demand from central banks, which has been steady for several years. The World Gold Council reported that in 2025, global central banks added 1,037 tonnes to their reserves, marking the second-highest year after 2022. This consistent buying helps establish a price floor and absorbs market supply. Ongoing geopolitical tensions also support gold’s role as a safe-haven asset. Unexpected conflicts could lead to a quick shift to safe investments, significantly benefiting gold prices. This makes maintaining long gold positions, whether directly or through options, a smart move against volatility in riskier assets like stocks. Create your live VT Markets account and start trading now.The Dow Futures (YM) cycle has ended with five waves, indicating a corrective pullback is underway.
Current Market Phase
The Dow Futures (YM) recently completed a five-wave pattern starting from the low on November 21, 2025, marking the end of wave 1. Following this, wave ((i)) increased to 49,299, then wave ((ii)) corrected down to 48,092. In wave ((iii)), wave (i) climbed to 48,686, while wave (ii) pulled back to 48,556. Then, wave (iii) rose to 49,463, followed by a small pullback in wave (iv) to 49,096, and finally, wave (v) peaked at 49,899, completing wave ((iii)). Next, the index corrected down to 49,001 in wave ((iv)), before moving up again to 49,899, which completed wave 1. Right now, the Dow Futures is in wave 2, showing a zigzag pattern from the peak of wave 1. Wave (i) dropped to 49,057, wave (ii) increased to 49,799, and wave (iii) fell to 48,689. Currently, wave (iv) is bouncing back to 49,095. We expect wave (v) of ((a)) to finish soon. After this, wave ((b)) will likely rally to cover the cycle from the January 13, 2026 high, before the index continues its downward trend within the larger corrective phase. The strong rally since the low on November 21, 2025, seems to have run its course, finishing a five-wave cycle. The market is now in a corrective phase, meaning recent gains have paused. This change indicates that strategies based on continuous highs may no longer be effective. This pullback matches recent economic updates. The CPI report for December 2025 showed a slight rise in inflation to 3.1%, surprising those who anticipated a cooling trend. Moreover, the VIX (a measure of market fear) increased from below 15 at the end of 2025 to around 20 now, indicating rising uncertainty among investors after the sharp rise. Based on the current situation, we anticipate a brief rally, or a “bull trap,” in the days ahead. Derivative traders may see this temporary rise as a chance to take bearish positions at favorable prices. This could involve selling call spreads or getting ready to buy puts as the market approaches resistance levels.Strategy and Outlook
Historically, this pattern is common after a strong, multi-month rally. We observed similar healthy pullbacks in 2023. These consolidation times are essential before a larger trend can continue. Thus, our immediate focus should be on managing risk for potential downside. Once the corrective rally is over, the market is expected to decline again, completing the broader downward correction. Traders should look for signs of the rally losing steam to position themselves for potential profits from a decline. The main strategy in the upcoming weeks will be to take advantage of this expected second leg down. Create your live VT Markets account and start trading now.Dividend Adjustment Notice – Jan 21 ,2026
Dear Client,
Please note that the dividends of the following products will be adjusted accordingly. Index dividends will be executed separately through a balance statement directly to your trading account, and the comment will be in the following format “Div & Product Name & Net Volume”.
Please refer to the table below for more details:
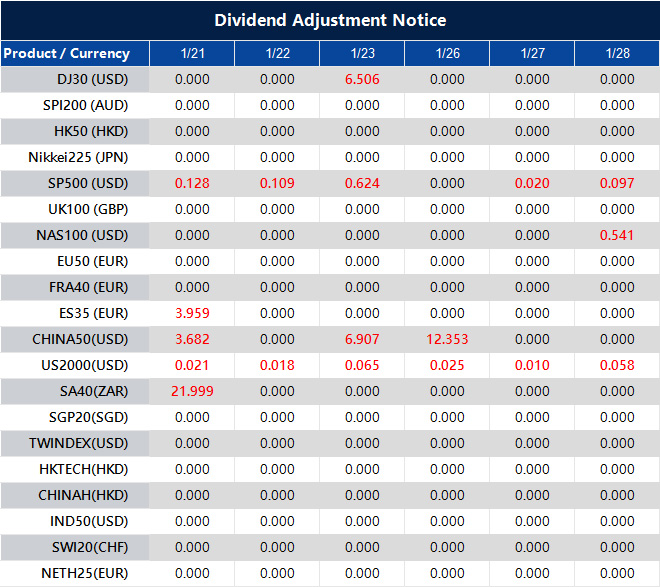
The above data is for reference only, please refer to the MT4/MT5 software for specific data.
If you’d like more information, please don’t hesitate to contact [email protected].


