With reduced tensions in Iran and a cautious market, WTI remains consistently above $59.30.
WTI continues to hold steady above $59.00 as the market assesses tensions in Iran and possible tariff threats from Trump. West Texas Intermediate (WTI), the US crude benchmark, is trading around $59.30 in early European hours. Traders are looking forward to the API crude oil stockpiles report set for Tuesday.
Over the weekend, tensions in Iran subsided slightly, although their Supreme Leader reported many casualties from recent protests. Observers are eagerly waiting for news on US-Iran relations, especially with reports of US military movements towards the Middle East, alongside Trump’s suggestion to delay any action against Iran.
Disputes over Greenland’s sovereignty lead to a drop in the US Dollar Index to nearly 99.10
The US Dollar Index has dropped to about 99.10 due to rising tensions between the US and EU over Greenland. The EU leader has warned that US tariff threats could escalate these tensions.
As a result, the US Dollar is underperforming, falling by 0.25% to nearly 99.15. It is weakest against the Swiss Franc amid overall currency fluctuations.
US Plans To Buy Greenland
President Donald Trump has suggested imposing tariffs on EU nations that oppose the US plans to purchase Greenland. This could negatively affect US-EU relationships. The European Commission has raised concerns about how this might impact territorial integrity and sovereignty. Michelle Bowman from the Federal Reserve has called for more interest rate cuts, pointing to a weak job market. These dovish statements add pressure to the US Dollar. The US Dollar is the official currency of the United States and is the most traded currency globally, accounting for 88% of foreign exchange transactions. It is largely influenced by Federal Reserve policies and general economic conditions in the US. Quantitative easing (QE) and quantitative tightening (QT) policies from the Federal Reserve also affect the Dollar. QE can weaken the Dollar by boosting credit flow, while QT can strengthen it.Geopolitical Stress And The Dollar
The US Dollar is losing value due to geopolitical stress and a dovish Federal Reserve. The December 2025 jobs report revealed weak growth, with only 50,000 new jobs added, further supporting the Fed’s discussions on cutting rates. This combination of factors makes shorting the Dollar appealing in the short term. The growing dispute with the EU over Greenland creates uncertainty in the market, leading to increased volatility. It might be wise to explore strategies that benefit from larger price movements, like buying options on currency pairs such as EUR/USD. In previous trade disputes from 2018-2019, similar tariff threats caused significant spikes in currency volatility, rewarding those who invested in volatility. With the Fed hinting at more rate cuts, the Dollar is likely to decline further. History shows that after the Fed shifted to rate cuts in mid-2019, the Dollar Index dropped nearly 10% over the next year. Taking long positions in futures contracts for the Euro or Swiss Franc, or buying call options on them, aligns with this monetary policy outlook. Geopolitical tensions are driving investors toward safe-haven assets, as seen with gold reaching a record high. This trend of seeking safety is expected to continue as long as the Greenland situation remains unresolved. Derivative traders should consider this a chance to maintain or start long positions in gold by using futures or call options on gold-backed ETFs. The February 1st tariff deadline is a crucial date that may trigger significant market movements. We should pay attention to options contracts expiring in mid-February or March to leverage potential market changes around this event. This strategy helps position us for a big move while maintaining a clear risk profile. Create your live VT Markets account and start trading now.Australian Dollar struggles against strengthened Japanese Yen near 105.65 during early European trading
The AUD/JPY pair dropped to around 105.65 during early European trading on Monday due to a stronger Japanese Yen. This shift is partly due to possible intervention by Japanese officials to support the Yen against the Australian Dollar. The pair’s first resistance level is at 106.48, while buyers might find support at 105.25. Japanese Finance Minister Satsuki Katayama mentioned that Japan may consider working with the United States on currency intervention to address Yen weakness.
Political uncertainty in Japan, including the possibility of a snap election, may negatively impact the JPY in the short term. Prime Minister Sanae Takaichi’s intentions to dissolve parliament for fiscal support have added to the apprehension. Despite these uncertainties, the AUD/JPY maintains a positive trend above 101.60. The relative strength index is neutral to bullish at 59.89, indicating ongoing upward momentum. Charts show less volatility and suggest a potential breakout, with the upper Bollinger Band resistance at 106.48. A close above this resistance may lead to further gains, while a drop below the 20-day middle Bollinger band at 105.25 could signal a decline.
Market Standoff
The AUD/JPY pair is currently trading quietly around 105.65, but there is a significant standoff happening. Japanese authorities are warning about potential market intervention, which is limiting upward movement. These warnings intensified after the pair surged to 106.90 last week, making traders cautious about aggressive buying. However, on a technical level, the uptrend remains strong as long as we stay above the 105.25 area, which is acting as a support level. Buyers have stepped in each time the pair dipped toward this threshold in recent days, showing that many believe in the pair’s strength and view dips as buying opportunities. The political situation in Japan adds another layer of uncertainty that may help the Australian dollar against the yen. Prime Minister Takaichi is expected to call a snap election on Friday, January 23rd, creating uncertainty that typically weakens a currency. This potential political instability is a key reason the yen hasn’t gained more strength, despite the warnings of intervention.Impact On Derivative Traders
From the Australian perspective, recent data is supporting the Aussie. Last week’s quarterly CPI report for Q4 2025 was slightly above expectations at 3.2%, lowering the likelihood of an imminent rate cut from the Reserve Bank of Australia. This contrasts with the Bank of Japan, which is still dealing with its historically loose monetary policy from 2024. For derivative traders, the current situation of low price action and growing tension is intriguing. The tight consolidation has pushed one-month implied volatility to a six-month low of 9.5%, making options relatively inexpensive. This presents an opportunity to set up trades, like long straddles, that could benefit from significant price swings in either direction after the election or any actual intervention. It’s essential to also remain aware of the larger context, as global risks are increasing with renewed trade tensions between the US and the EU. As seen during previous periods of stress in 2025, any major flight to safety in global markets would likely favor the yen as a safe-haven asset. A sudden geopolitical event could easily disrupt the current technical patterns and drive this pair sharply lower. Create your live VT Markets account and start trading now.USD/CHF falls to around 0.7985 as dollar weakness leads to increased selling pressure
The USD/CHF pair has fallen over 5%, nearing 0.7985, mainly due to the weakness of the US Dollar. Tensions between the US and EU over Greenland’s sovereignty have negatively impacted the US Dollar, causing it to perform poorly.
The US Dollar Index (DXY) is down by 0.25%, currently at around 99.15. President Donald Trump has threatened a 10% tariff on imports from several EU countries, adding to the tensions as EU leaders issue warnings about the potential impact on international relations.
Swiss Franc’s Gain
The Swiss Franc has strengthened because it is viewed as a safe haven amid the US-EU conflict, leading to increased demand. This week, attention will also be on speeches from global central bankers at the World Economic Forum in Davos, especially from Swiss National Bank Chairman Martin Schlegel. The US Dollar, which is a major global currency, is affected by decisions made by the Federal Reserve, especially regarding interest rates. When the Fed conducts quantitative easing (buying bonds to inject cash into the economy), it often weakens the US Dollar. In contrast, quantitative tightening (stopping those bond purchases) usually supports the Dollar. Given the steep decline in USD/CHF, traders should expect increased market volatility. The implied volatility of one-month USD/CHF options has surged to over 11%, a level not seen since the banking stress in the US in early 2025. This indicates that traders are anticipating significant price movements in the coming weeks. Derivative traders seem to be betting on further declines or ongoing volatility. Open interest in put options with strike prices between 0.7800 and 0.7900 has soared by nearly 40% in the last two trading sessions, suggesting a strong belief that the pair may drop further before stabilizing.Upcoming Economic Events
A key event this week is SNB Chairman Schlegel’s speech at Davos, which will be closely monitored. The SNB has a history of significant actions to weaken the franc, most notably in 2015, so any dovish comments could trigger a sharp short squeeze. Traders might consider buying short-term call options to protect against unexpected remarks. This currency pressure is particularly challenging for the Swiss economy, as the latest manufacturing PMI from early January fell to 49.1, indicating a contraction. A consistently strong franc will worsen the situation for Switzerland’s vital export sector. This economic weakness may prompt the SNB to act sooner rather than later. In the US, market movements are not being driven by Federal Reserve policy. The latest inflation report showed that Core PCE is stable at 2.4%. This suggests that the Dollar’s weakness stems more from geopolitical issues rather than expectations of changing interest rates. Traders should focus on diplomatic developments as the main influence on the dollar’s value. With the February 1st tariff deadline approaching, uncertainty remains high. Using options strategies like straddles or strangles could be wise, as they benefit from significant price movements in either direction. This strategy allows traders to take advantage of volatility resulting from either a breakthrough in diplomacy or an escalation of the trade dispute. Create your live VT Markets account and start trading now.EUR/JPY rises above 183.50 after three days of decline, trading near 183.60 in Asia
EUR/JPY climbed above 183.50 and reached about 183.60 during Asian trading on Monday. The Euro gained support after EU ambassadors decided to push back against US tariff measures and prepare for possible retaliation.
US President Donald Trump announced tariffs on goods from eight European countries that opposed his Greenland acquisition plan. A 10% tariff is set to begin on February 1 for products from Denmark, Sweden, France, Germany, the Netherlands, Finland, Britain, and Norway.
Japan’s Industrial Production dropped by 2.7% in November 2025, exceeding the 2.6% preliminary estimate. This decline reverses a 1.5% increase in October and is the largest drop since January 2024.
Impact of the Japanese Yen
The Japanese Yen is limiting the gains of EUR/JPY due to expected rate hikes from the Bank of Japan and increased fiscal spending. However, the central bank is likely to keep its policy rate at 0.75% this week, considering potential changes in June. Finance Minister Satsuki Katayama mentioned a possible joint intervention with the US to support the Yen, stating that all options, including direct market intervention, are on the table to combat Yen depreciation. Tariffs are customs duties on imported goods designed to protect local industries and give them a competitive edge. They are different from taxes, which are applied at the point of sale. The effects of tariffs are debated; some see them as protective, while others warn they could lead to trade wars.Expected Market Volatility
With new US tariff threats against major European countries, we should expect significant volatility in EUR/JPY over the coming weeks. The February 1 deadline is crucial, and options pricing shows that one-month implied volatility for the pair has soared to 14.5%, the highest since the aftermath of the 2024 US elections. This situation makes simple spot positions riskier; traders should consider strategies that profit from price fluctuations rather than just direction. The Euro’s strength is delicate and highly influenced by news from Brussels and Washington. Throughout 2025, we observed how sensitive the Euro was to trade talks, and any indication of a weakening EU stance could lead to a quick reversal. Traders might look into buying put options on the Euro to protect against the risk of President Trump implementing his tariff plan, which could heavily impact export-driven economies, like Germany. On the flip side, the Yen faces mixed pressures creating uncertainty. The negative industrial production data from November 2025 is a challenge, but the Bank of Japan’s more aggressive approach and the Ministry of Finance’s threats of intervention provide some support for the currency. Recent fears of interventions have led to nearly $50 billion being withdrawn from carry trades, showing how quickly market sentiment can shift against a weak Yen. For those trading derivatives, this situation makes long volatility positions, like straddles or strangles on EUR/JPY, appealing as we approach the February 1 deadline. Such strategies allow us to benefit from significant price movements in either direction—whether it’s a rally if tariffs are avoided or a drop if they are enforced. Historically, these strategies perform well during times of high geopolitical uncertainty, like the Brexit negotiations. Additionally, we should watch the wider market impact, as these tariff threats extend beyond the Euro. A full trade dispute could spark a global risk-off sentiment, strengthening the safe-haven Yen against commodity currencies such as the Australian and Canadian dollars. The VIX index, a major measure of market fear, has already risen by 3 points to 19.8 since the announcement, indicating that traders should brace for broader market turbulence. Create your live VT Markets account and start trading now.Gold prices in Saudi Arabia increased today based on market data.
Gold prices in Saudi Arabia rose on Monday, according to FXStreet. The price per gram jumped to 563.03 Saudi Riyals (SAR), up from 552.38 SAR on Friday. The price per tola also increased to SAR 6,566.88, compared to SAR 6,442.79 before.
FXStreet calculates these prices by converting international gold rates (USD/SAR) into local currency and units, updating them daily based on local market conditions. Actual local rates may vary slightly from these reference prices.
The Importance of Gold as an Investment
Gold is seen as a reliable investment. Many view it as a safe choice during uncertain times and as protection against inflation. Because it isn’t tied to any issuer or government, it’s considered a secure asset. Central banks are the biggest gold buyers. In 2022, they added 1,136 tonnes worth about $70 billion. Countries like China, India, and Turkey are quickly increasing their reserves. Gold prices usually move in the opposite direction of the US Dollar and US Treasuries. Economic instability or fears of a recession often boost gold prices due to its status as a safe haven, while a strong Dollar typically keeps prices in check. The recent rise in gold prices, reflected locally, signals a shift in the global economic landscape. This change suggests that investors are beginning to favor safe-haven assets. This isn’t just a brief spike; it’s part of a larger trend that began in late 2025.Effects of Changing Monetary Policies
Expectations for central bank policies are shifting, especially regarding the US Federal Reserve. After extended inflation throughout much of 2024 and the resultant economic slowdown in 2025, the market expects monetary easing. Recent data shows that inflation, indicated by the US Consumer Price Index for December 2025, has dropped to 2.5%, a manageable level. This directly influences the U.S. Dollar, which typically moves opposite to gold. The Dollar Index (DXY) has fallen below the crucial 102 mark, a stark change from its strength in early 2025. With Fed funds futures indicating at least two interest rate cuts by the end of 2026, the Dollar’s outlook appears negative, benefiting gold. Central banks continue to show consistent demand for gold. In fact, they added over 800 tonnes to their reserves in 2025, based on reports from the World Gold Council. This ongoing institutional buying helps establish a price floor and reflects a long-term trust in gold as a primary reserve asset. For derivative traders, this situation suggests it’s time to explore strategies that take advantage of upward momentum and potential volatility increases. Buying long-dated call options on gold ETFs or futures, such as those for June and September 2026, could be a smart move to capture upside while managing risk. The implied volatility remains relatively low compared to where it could rise if rate cuts happen. Given the likelihood of sharp market reactions to central bank announcements, consider using call spreads to lower the initial investment cost. Selling a higher-strike call against a purchased call can finance the position and enhance the risk-reward profile. This strategy allows for a bullish outlook while protecting against a sideways market or a moderate pullback. Create your live VT Markets account and start trading now.Gold prices in the Philippines rise today, according to data from various sources.
Gold prices in the Philippines increased on Monday. According to FXStreet, the price rose to 8,914.57 Philippine Pesos (PHP) per gram, up from PHP 8,757.33 last Friday. The price per tola also went up, reaching PHP 103,977.80 from PHP 102,143.80.
FXStreet updates its gold price figures daily, adapting them to local currencies and measurement units. Keep in mind that the prices are reference points and can slightly vary in local markets.
Role and Function of Gold
Gold is often seen as a safe investment and is widely used in jewellery. It serves as a reliable asset during economic downturns and is a hedge against inflation and currency loss. Central banks hold significant gold reserves; in 2022, they added 1,136 tonnes (or about $70 billion) to their stocks. Typically, gold prices rise when geopolitical tensions increase or during fears of a recession. Prices also tend to go up when interest rates drop and inversely correlate with the US Dollar; when the dollar weakens, gold prices usually increase. Today, gold reached a new high due to rising geopolitical tensions linked to US tariff threats against Europe. This has led investors to sell riskier assets in favor of safer options like gold. For traders dealing in derivatives, this indicates a time of high volatility and an upward trend for gold. We suggest taking bullish positions on gold in the coming weeks. Strategies like buying call options or long positions in futures contracts can take advantage of this rising trend. The current market fear is a strong motivator and will likely remain for some time.Strategic Considerations for Traders
This increase is backed by strong demand observed over the past year. In 2025, central banks aggressively purchased gold, with the World Gold Council reporting over 800 tonnes in net purchases to diversify away from the US dollar. Additionally, there were consistent inflows into gold-backed ETFs in the last quarter of 2025, showing that both institutional and retail investors share this view. The weakening US Dollar is a big boost for gold. Today, the Euro and British Pound have strengthened against the dollar, making gold cheaper for those holding other currencies. Traders should watch the US Dollar Index (DXY) closely; further dollar weakness will likely push gold prices higher. The recent jump in prices has also increased implied volatility in the options market. Buying call options now seems like a smart move, allowing traders to benefit from price increases while limiting potential losses to the premium paid. In this uncertain environment, selling uncovered options poses a high risk. There’s a noticeable shift away from speculative assets, which strengthens the trend to safer investments. The sharp decline in meme coins like Dogecoin and Shiba Inu indicates that speculative investments are pulling back. This capital is looking for safety, and gold is the main beneficiary. As we look ahead to early 2026, it’s clear that the central banks’ major gold purchases in 2022 and 2023 signal a long-term trend. The current geopolitical issues are accelerating a rally built on solid foundations of reducing reliance on the US dollar and hedging against inflation. In the coming weeks, developments regarding US-Europe tariff issues will be crucial for short-term price movements. Create your live VT Markets account and start trading now.Week Ahead: Currency Breakdown And The Switch To Digital Alternatives

History delivers a clear message to markets. When a currency loses credibility, confidence is usually the first casualty, followed soon by institutions themselves.
Germany’s experience in 1923 is a classic example. Hyperinflation reduced the mark to near worthlessness, with citizens needing wheelbarrows of cash simply to purchase basic goods.
By November of that year, one US dollar was worth around 4.2 trillion marks. Personal savings were destroyed, and the government collapsed shortly afterwards.
A similar chain of events played out in Indonesia in 1998. During the Asian financial crisis, the rupiah lost roughly 80% of its value in just a few months.
Rising prices sparked widespread protests, and by May 1998, President Suharto stepped down after more than three decades in power.
For traders, these episodes matter because they illustrate how currency failure can rapidly alter political stability, redirect capital flows, and reshape demand for assets.
Iran’s Currency Crisis And Capital Flight
A comparable pattern is now emerging in Iran. Late last year, private lender Ayandeh Bank collapsed under the weight of nearly USD 5 billion in non-performing loans.
The government’s response was to print money to absorb the losses, a move that accelerated the currency’s decline rather than restoring confidence.
Already weakened by sanctions and policy errors, the Iranian rial entered a sharp downward spiral. After sustained losses through 2025, the currency sank to fresh record lows near 1.5 million per dollar on the black market.
By late December, rising living costs and eroding trust in institutions had triggered nationwide protests.
From a market perspective, currency collapse typically drives defensive behaviour. As the rial deteriorated, households and businesses moved swiftly to protect wealth through alternative channels, fuelling demand for assets outside the traditional banking system.
Why Crypto Gains Ground When Fiat Fails
History also shows that governments often respond to currency breakdown with redenomination. Venezuela offers a recent case. In 2018, authorities introduced a new sovereign bolivar, slashing five zeros from the old currency.
Inflation persisted. By 2021, another reform followed, with the launch of a digital bolivar that removed six additional zeros.
The outcome was largely unchanged. By late 2021, it still took millions of bolivars to buy a loaf of bread.
Those with access to US dollars via remittances or exports fared better, while workers paid solely in bolivars were trapped in an increasingly dysfunctional domestic economy.
To close that gap, many Venezuelans turned to cryptocurrencies. Digital assets became a means to receive remittances, preserve income, and transact beyond failing financial systems. For traders, this helps explain why crypto demand often rises during periods of crisis, even as prices remain volatile.
Iran’s Early Lead In Digital Adoption
Iran differs from Venezuela in one important respect: digital asset adoption is already high.
By 2023, around one in five Iranians owned cryptocurrency, and nearly one in three had used or invested in digital assets, among the highest adoption rates globally.
Years of sanctions and restricted access to international finance pushed many Iranians towards Bitcoin and stablecoins well before the current turmoil. As a result, if banking stress intensifies or political instability accelerates, capital can move into digital assets quickly, without the steep learning curve seen in other economies.
For global markets, this reinforces the view that crypto is increasingly functioning as financial infrastructure rather than purely a speculative vehicle in fragile states.
What Traders Are Watching Into 2026
Despite growing real-world usage, crypto markets remain sensitive to broader macro conditions. As of January 2026, expectations of persistently high interest rates and a relatively tight stance from the US Federal Reserve have weighed on Bitcoin.
Regulatory uncertainty has added to the pressure. In mid-January, delays to a US Senate crypto bill pushed Bitcoin back below the USD 95,000 level.
Early-year trading often remains choppy due to tax-related selling and shifts in liquidity. However, if inflation continues to ease and major central banks pivot towards looser policy later in 2026, liquidity conditions could improve.
In such an environment, assets like Bitcoin may attract renewed inflows, particularly as real-world use cases expand during episodes of currency stress.
Market Movements Of The Week
Bitcoin (BTCUSD)
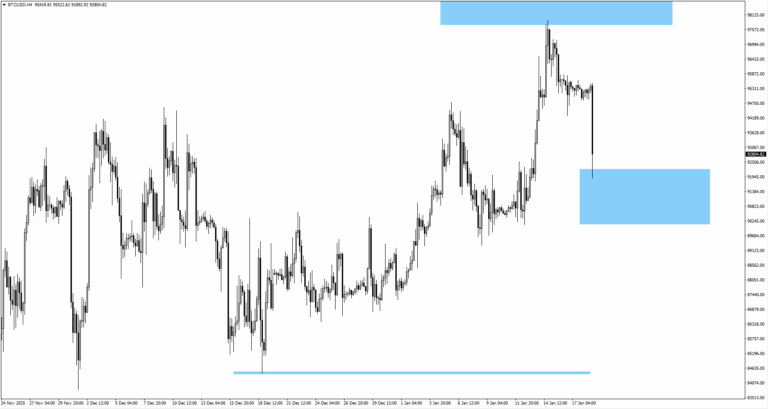
– Bitcoin pulled back below 95,000 dollars following US regulatory delays.
– Elevated rates continue to cap short-term upside.
– Structural demand remains supported by emerging market adoption.
Gold (XAUUSD)
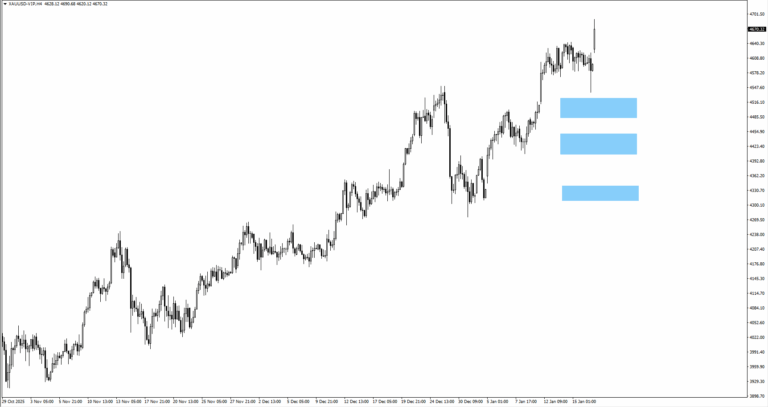
– Gold reached fresh all-time highs near 4,6904,505 before consolidating.
– Safe-haven demand remains firm amid currency stress headlines.
– Traders monitor US policy signals for directional clarity.
US Dollar Index (USDX)
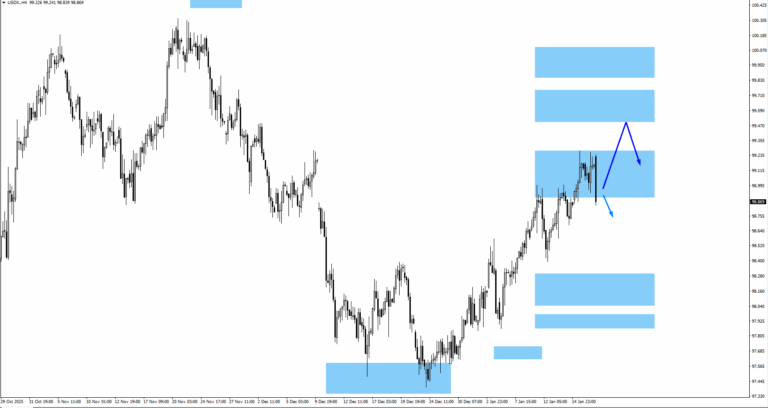
– USDX trades near the 99.10 monitored area.
– Tariff rhetoric and rate expectations support near-term strength.
– Resistance sits near 99.70 and 100.00.
S&P 500 (SP500)
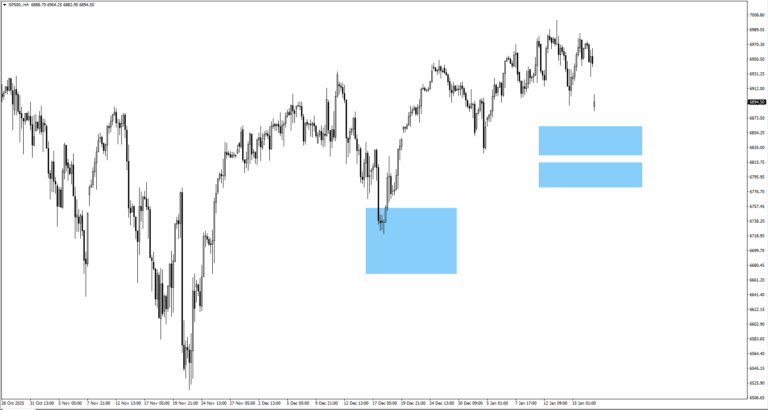
– The 7,000 level remains a key resistance area.
– Geopolitical risk could trigger pullbacks toward 6,840 or 6,795.
– Equity sentiment remains sensitive to macro stability signals.
Key Events This Week
19 January
1. US Bank Holiday
Thinner liquidity conditions may distort early-week price action.
20 January
1. UK BOE Governor Bailey Speaks
Refer to market structure for directional bias.
21 January
1. US President Trump Speaks
Monitor for further geopolitical and policy-related updates.
22 January
1. US Core PCE Price Index m/m, Forecast: NA, Previous: 0.20%
Inflation sensitivity remains elevated.
2. US Final GDP q/q, Forecast: 4.30%, Previous: 4.30%
Refer to market structure for confirmation.
23 January
1. JP BOJ Policy Rate, Forecast: 0.75%, Previous: 0.75%
Focus on Ueda’s guidance and yen reaction.
Bottom Line
Markets remain closely tied to the credibility of money itself. Ongoing currency strains across parts of the developing world continue to support demand for alternative stores of value, while tighter global financial conditions keep near-term volatility elevated across risk assets.
Crypto markets remain highly responsive to interest rate expectations and regulatory developments, yet adoption driven by necessity rather than speculation continues to build quietly in the background.
Traders are focused on upcoming policy signals and inflation data, which will shape liquidity conditions and determine whether defensive positioning gives way to a renewed appetite for risk later in 2026.
Dividend Adjustment Notice – Jan 19 ,2026
Dear Client,
Please note that the dividends of the following products will be adjusted accordingly. Index dividends will be executed separately through a balance statement directly to your trading account, and the comment will be in the following format “Div & Product Name & Net Volume”.
Please refer to the table below for more details:
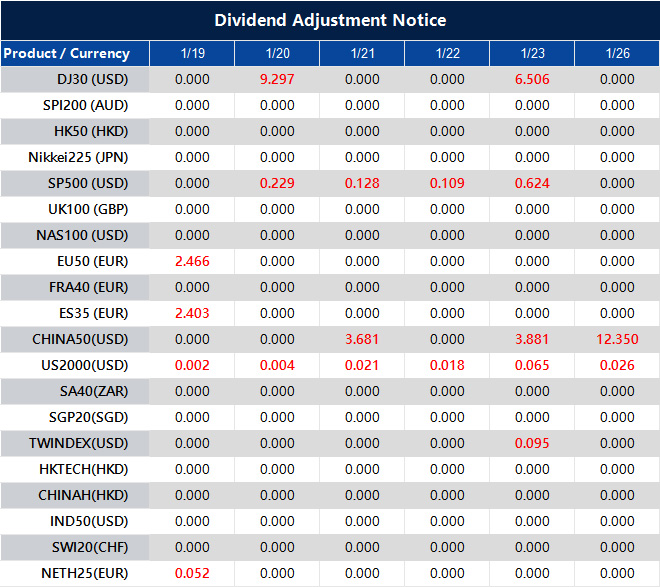
The above data is for reference only, please refer to the MT4/MT5 software for specific data.
If you’d like more information, please don’t hesitate to contact [email protected].
Gold prices rise in the United Arab Emirates, according to earlier data reports.
Gold prices in the United Arab Emirates went up on Monday, according to FXStreet data. The price per gram rose to 550.94 AED from 541.09 AED on Friday. The cost per tola also increased to 6,425.92 AED from 6,311.18 AED.
Gold prices are set by FXStreet, which adjusts international rates for local currency and units. These prices change daily and may be slightly different from local rates. Gold is still seen as a reliable investment and is favored during economic uncertainty because it protects against inflation.


