Gold rose above $4,680 in early European trading on Wednesday, reaching an over one-week high. It extended a rebound from a more than one-month low near $4,500 set on Monday, as the US Dollar weakened.
US President Donald Trump said on Tuesday that “Project Freedom”, aimed at guiding commercial ships out of the Strait of Hormuz, will be paused briefly to allow talks with Iran. He also said on Truth Social that progress has been made towards an agreement with Iranian representatives.
Geopolitical Signals Support Gold
Defence Secretary Pete Hegseth said the US was not seeking to re-escalate tensions and that the ceasefire holds for now. Secretary of State Marco Rubio said the US-led ‘Operation Epic Fury’, launched with Israel on 28 February, is over.
Crude oil fell to a one-week low, which reduced inflation concerns and eased expectations for tighter US monetary policy. CME Group’s FedWatch Tool shows traders pricing in over a 35% chance of a US rate rise by the end of this year.
Traders are watching the US ADP private-sector jobs report, speeches from FOMC members, and Friday’s US Nonfarm Payrolls report.
Technically, gold is above the 200-period SMA at $4,651.69, with RSI near 59 and a rising, positive MACD histogram. Support levels are $4,588.83, $4,495.62, and $4,402.41.
Lessons From The 2025 Rally
Looking back at this time in 2025, we saw gold begin a significant rally from the $4,500 level. This move was driven by optimism around a potential US-Iran peace deal, which weakened the US dollar and lowered oil prices. The market was uncertain, but the technical signs were pointing towards a bullish recovery.
That optimism proved well-founded, as the follow-through buying did materialize in the weeks that followed May 2025. The market’s fear of a Fed rate hike faded, and we saw the central bank pivot toward a more neutral stance later that year, which further fueled gold’s ascent. This historical setup reminds us how quickly geopolitical de-escalation can shift capital towards non-yielding assets like gold.
Today, with gold trading near $4,950, the situation is different yet contains echoes of the past. Recent data shows US inflation, as measured by the CPI, has moderated to 3.1%, but it remains stubbornly above the Fed’s target. This has created uncertainty about the timing of the next rate cut, keeping traders on edge.
Given this context, derivative traders should consider using options to manage risk and capture potential upside. With the CBOE Volatility Index (VIX) currently hovering at a relatively low 14, buying call options on gold ETFs or futures could be a cost-effective way to position for a rally. This strategy allows for participation in further gains while strictly defining the maximum potential loss.
For those anticipating sideways consolidation before the next major move, selling covered calls against an existing gold position could generate income. Alternatively, a calendar spread using gold futures would allow a trader to profit if the price remains stable in the short term but is expected to rise later. This approach benefits from the decay of the front-month option’s value.
The key risk now is a surprise shift in Fed language, which could cause a rapid repricing of rate expectations and a pullback in gold. We remember how the focus was on the NFP report back in 2025; today, the focus is just as intense on every piece of inflation and employment data. Therefore, any long positions via futures should be protected with disciplined stop-loss orders.
Global equities rose on Tuesday, led by US technology and semiconductor stocks. The S&P 500 gained 0.8% and the small-cap Russell 2000 rose 1.8%, while Intel, Qualcomm and Micron climbed 11–13%.
Asian markets also advanced, with Korea up 6% and Shenzhen up 2.5% after a holiday. Korea was up 70% year to date and 180% over the last 12 months.
European Market Divergence
European shares lagged the US over the past month, with the Stoxx 600 up 2% versus a 10% rise in the S&P 500. The difference was linked to sector make-up rather than energy prices alone.
Cyclical sectors and smaller companies also moved higher after US ceasefire comments. Regional banks, materials and industrials rose 1–2%, and the Stoxx 600 added 0.7%.
The article was produced using an AI tool and checked by an editor.
The continued surge in technology, especially semiconductors, suggests maintaining a bullish stance. We should consider long calls or bull call spreads on tech-heavy indices like the Nasdaq 100 (QQQ) or semiconductor ETFs (SOXX). The SOX index, which tracks these companies, is up over 15% in the last month alone, showing powerful momentum that is likely to persist in the near term.
Options Trade Ideas
The rebound in general cyclicals and small caps is a signal that the rally is broadening. This follows last week’s ISM manufacturing report, which surprised to the upside at 51.2, suggesting a resilient industrial sector. We should look at call options on the Russell 2000 (IWM) or industrial ETFs (XLI) to capture this potential catch-up trade.
There is a clear divergence between US and European markets that presents a pairs trade opportunity. The underperformance of the Stoxx 600 is due to its lack of high-growth tech, a structural issue that will not change quickly. Year-to-date, the Nasdaq 100 has outperformed the Stoxx 600 by nearly 12 percentage points, a gap we expect to widen.
We saw a similar pattern in late 2024, where tech led a sharp rally before a brief consolidation. The “jaw dropping speed” of this move means implied volatility is high, with the VIX index holding above 18. This makes selling out-of-the-money put spreads on strong indices an attractive way to collect premium while expressing a bullish view.
Oil and jobs may look like separate market stories. One sits in the commodities market. The other lands through the US economic calendar. In practice, both feed into the same question: how much room does the Federal Reserve really have to cut rates?
That question now matters more than the headline move in any single asset. Oil affects inflation expectations. Jobs data shapes confidence in the strength of the US economy. The Fed sits between both. When energy prices stay high and the labour market refuses to crack, markets may need to rethink how quickly inflation can fall and how soon policy can loosen.
This is why oil and Nonfarm Payrolls deserve to be read together. High oil prices can keep cost pressure alive across transport, manufacturing, logistics, and consumer fuel. A resilient jobs market can keep wage pressure firm and reduce the urgency for rate cuts. Together, they can push traders back toward a higher-for-longer rate view.
Oil Is Still An Inflation Story
Oil has pulled back from recent spikes, but prices remain high enough to keep inflation risk on the table. Brent crude recently traded near $107.98 per barrel, while WTI sat around $100.44 after signs of possible progress toward a US-Iran peace deal. Even with that pullback, a reported 8.1 million-barrel draw in US crude inventories kept the supply backdrop tight.
That matters because oil does not stay neatly inside the energy market. It moves through shipping, manufacturing, aviation, trucking, plastics, food distribution, and household fuel costs. When oil remains elevated for long enough, businesses face higher input costs. Some absorb the margin squeeze. Others pass those costs to consumers.
This is why oil can shift the tone of the inflation debate before the next CPI release lands. A short spike may be dismissed as noise. A longer stretch above the $100 area becomes harder for central banks to ignore.
The demand picture also complicates the story. Recent energy market data has pointed to softer global demand momentum, which means oil now carries two-sided risk. On one side, supply shocks and geopolitical risk can keep prices elevated. On the other, high prices can damage demand if households and businesses start cutting back.
Traders should not treat higher oil as automatically bullish for the wider economy. At some point, expensive energy becomes a tax on growth.
Jobs Data Keeps The Fed From Moving Too Early
The labour market adds the second layer of pressure. Recent US jobs data has shown a market that is cooling in parts, but not breaking. Job openings have eased, but hiring has remained firm enough to suggest that employers are still adding labour when needed.
This is exactly the kind of mixed labour backdrop that can keep the Fed cautious. Lower job openings point to softer demand for workers. Stronger hiring, however, does not point to a recessionary labour shock.
For rate-cut expectations, the detail matters. A weak NFP print may support hopes for cuts. But if unemployment stays contained and wage growth remains firm, the Fed may still resist easing too quickly. Policymakers do not need a booming labour market to stay cautious. They only need enough labour resilience to avoid panic.
That is why traders should focus on the full jobs picture rather than the headline payroll number alone. Payroll growth, unemployment, labour force participation, average hourly earnings, and revisions all matter. A strong headline number with hot wages can push yields higher. A soft payroll print with tame wages can support rate-cut bets. A messy middle result can create the most volatility.
The Real Market Driver Is The Oil-Jobs Combination
Oil and jobs become more powerful when read together.
If oil stays high while jobs remain strong, markets may read the setup as inflationary. That can support the US dollar, lift Treasury yields, and pressure rate-sensitive assets such as growth stocks.
If oil stays high while jobs weaken, the setup becomes more uncomfortable. The Fed then faces a policy conflict: inflation pressure from energy, but slowing growth from weaker employment. That mix can create choppy price action because markets struggle to decide whether to trade inflation risk or recession risk first.
If oil falls while jobs soften, the market gets a cleaner dovish signal. Inflation pressure eases, growth cools, and rate-cut expectations can rebuild. That is usually more supportive for equities, gold, and risk appetite, unless the labour slowdown looks severe enough to trigger recession fears.
The point is not to treat oil or NFP as standalone signals. The point is to identify which macro regime is forming.
How This Affects Major Markets
US Dollar
The US dollar tends to benefit when markets price a firmer Fed path. If oil keeps inflation sticky and jobs stay resilient, traders may delay expectations for rate cuts. That can support USD, especially against currencies linked to economies with weaker growth or more dovish central banks.
The risk is that dollar strength may fade if oil falls sharply and labour data weakens at the same time. That would revive the case for lower US rates and reduce the dollar’s yield appeal.
Gold
Gold faces a more complicated setup. Higher yields and a stronger dollar can pressure XAUUSD because gold does not pay interest. But geopolitical stress, inflation fear, and market volatility can still support haven demand.
That means gold may not trade as a simple “rates down, gold up” story. If oil shocks fuel inflation and geopolitical fear at the same time, gold can stay supported even when yields rise. The cleaner bullish setup for gold would be falling yields, softer USD, and lingering uncertainty.
Equities
Equities usually dislike the combination of high oil and firm yields. Higher energy costs can hurt margins, while higher yields reduce the appeal of long-duration growth stocks. This is especially relevant for indices with heavy technology exposure.
Energy stocks may perform better if crude prices stay elevated, but that does not mean the broader equity market will enjoy the same tailwind. Expensive oil can help producers while hurting consumers, transport companies, airlines, manufacturers, and rate-sensitive sectors.
Oil And Energy Stocks
Energy-linked assets remain tied to both headline risk and physical supply conditions. Recent oil weakness came as markets priced hope around geopolitical relief, but inventory draws and supply uncertainty have kept the market from fully relaxing.
For traders, the key is whether crude holds above the psychologically important $100 area. A sustained break below that zone would soften the inflation narrative. A recovery back toward $110 or higher would likely revive concerns about sticky prices and higher-for-longer rates.
The next phase depends on whether oil and labour data confirm or contradict each other.
For oil, traders should watch whether Brent can hold above the $100 to $105 region after recent geopolitical relief. A move back toward $110 or $115 would suggest that the market still sees a supply risk premium. A deeper fall below $100 would reduce inflation pressure and give risk assets more breathing room.
For labour data, the focus should sit on wage growth and unemployment, not just headline job creation. A strong payroll number with firm wages would likely support a cautious Fed stance. A weaker payroll print with rising unemployment and cooling wages would give markets more reason to price rate cuts.
For the Fed, the key signal is not whether officials sound slightly dovish or slightly hawkish from one speech to the next. The key signal is whether inflation risk from energy fades fast enough for policymakers to trust the disinflation trend.
Cautious Forecast
The near-term outlook remains sensitive to oil headlines and US labour data. If Brent crude stays above $100 and US jobs data remains steady, markets may struggle to price aggressive Fed cuts. That would favour a firmer dollar, choppier gold trade, and more pressure on rate-sensitive equity sectors.
If oil prices fall further and upcoming labour data shows clearer cooling, rate-cut expectations may rebuild. That would ease pressure on equities and could support gold if Treasury yields move lower. For now, markets remain vulnerable to any data that challenges the rate-cut narrative.
FAQs
1) How do oil prices and US jobs data affect Federal Reserve interest rate decisions?
High oil prices and a resilient labor market signal persistent inflationary pressures. When the job market is strong and energy prices remain elevated, the Federal Reserve is likely to keep interest rates higher for longer. If inflation and job growth cools, the Fed may consider cutting interest rates to stimulate the economy.
2) Why do high oil prices impact the inflation debate?
Oil is not just an isolated commodity; its costs are embedded throughout the global supply chain, affecting transport, manufacturing, logistics, and household fuel. A sustained period of oil prices remaining above $100 per barrel increases input costs for businesses, which are frequently passed on to consumers, driving up overall inflation.
3) Does a strong labor market mean the economy is booming?
Not necessarily. While a resilient job market prevents immediate recessionary shocks, mixed signals—such as cooling job openings and firm hiring—indicate that the economy is cooling in parts but not breaking. For the Fed, this means they can remain cautious without needing to panic-cut rates or react to a sharp rise in unemployment.
4) How does the current macro environment affect the US Dollar and Gold?
US Dollar: Tends to strengthen when market prices are on a “higher-for-longer” Fed path, as higher rates increase the yield appeal of the dollar compared to other currencies.
Gold: Faces downward pressure from higher yields and a stronger dollar, as non-yielding assets become less attractive. However, geopolitical stress or acute inflation fears can still drive safe-haven demand for gold.
5) Which sectors of the stock market are most affected by high oil prices?
Negative Impact: Rate-sensitive sectors, especially long-duration growth stocks (like technology), transportation, aviation, and consumer goods companies. Higher energy costs reduce profit margins.
Positive Impact: Energy-linked stocks and commodity producers tend to benefit from higher oil prices.
Start trading now – Click here to create your real VT Markets account
Commerzbank’s Antje Praefcke says developments linked to the Iran conflict are the main factor shaping EUR/USD, with US data having less influence. She expects the pair to remain in its recent range unless events in the Middle East clearly escalate or de-escalate.
The US data calendar includes JOLTS Job Openings, the ADP Index, and the official jobs report on Friday. JOLTS was described as “somewhat softish”, while a strong ADP reading could lift the US dollar slightly and a weaker Nonfarm Payrolls (NFP) result could weigh on it.
Iran Conflict Drives Range Trading
Praefcke notes that US employment data has been volatile in recent months and has not provided clear signals. She expects April job growth to be relatively modest, suggesting that, unless there are unexpected outliers, the figures may have limited impact on the US dollar.
She adds that other themes are secondary while the Middle East war continues without signs of ending. A clear shift in the Iran conflict, either de-escalation or renewed escalation, is presented as the main condition for EUR/USD to move out of the range seen for several weeks.
For the coming weeks of May 2026, we believe the situation in the Middle East involving Iran remains the most important factor for the EUR/USD pair. Upcoming US economic data is likely to be a secondary concern for the market. As a result, the currency pair will probably stay within its recent trading channel.
We just saw the April Nonfarm Payrolls report last Friday, which showed a gain of 170,000 jobs, slightly missing expectations but not weak enough to alter the Federal Reserve’s policy view. This type of mixed data has been common recently, leaving the US Dollar without a clear catalyst. Because of this, we don’t expect employment figures to drive any significant moves.
Positioning For Low Volatility
Given that EUR/USD has been trading tightly between 1.0650 and 1.0850, derivative traders could consider strategies that profit from low volatility. Selling out-of-the-money options, such as in an iron condor or a strangle, could be a viable approach. These strategies benefit from the pair remaining within this expected range as the options’ time value decays.
Implied volatility on one-month EUR/USD options has fallen to around 5.5%, reflecting the market’s current lack of directional conviction. While this makes selling premium attractive, it also signals that any unexpected news could cause a sharp reaction. This low volatility environment is a direct result of traders waiting for geopolitical cues rather than trading on economic numbers.
However, we must remain prepared for a sudden breakout should the situation with Iran change. We only have to look back to the sharp market reactions in late 2025 when these tensions first flared up to understand the risk. Any headline suggesting a clear escalation or a move towards diplomacy could easily push the pair out of its current range.
To protect against such a sudden move, traders could hold a small number of long-dated, out-of-the-money puts or calls. This acts as a cheap form of insurance against a sharp, unexpected move in either direction. The primary focus should be on monitoring geopolitical headlines, as these will likely trigger the next significant trend.
EUR/USD rose to about 1.1730 in early European trade on Wednesday, moving above 1.1700. Markets awaited the US ADP April Employment Change report due later on Wednesday.
On Tuesday, US President Donald Trump said “great progress has been made toward a complete and final agreement with representatives of Iran”. He also said he agreed to pause “Project Freedom”, an initiative linked to moving commercial ships through the Strait of Hormuz.
Geopolitics And Risk Sentiment
Iran earlier on Tuesday introduced a new mechanism for ship transits through the Strait of Hormuz amid tensions with Washington. Traders continued to watch for further updates on a possible US-Iran ceasefire.
In Europe, markets increased expectations for a European Central Bank rate rise as early as June 2026, amid concern about sticky inflation. On Monday, Bundesbank President Joachim Nagel said the ECB may need to raise rates in June if the inflation outlook does not improve in the coming weeks.
In the US, the Federal Reserve maintained a firm stance, with no near-term signal of rate cuts.
The current environment strongly suggests positioning for further Euro strength against the US dollar. Hopes for a US-Iran deal are reducing demand for the safe-haven dollar, creating a tailwind for the EUR/USD pair. This geopolitical shift coincides with growing expectations for a European Central Bank rate hike.
Options Strategy Considerations
With Eurozone inflation for April holding at 2.8%, well above target, we see a hawkish ECB as the primary driver. Markets are now pricing in a greater than 70% chance of a rate hike in June, making long EUR call options with July expirations an attractive strategy. This would allow traders to capture any upward momentum following the central bank’s decision.
The potential de-escalation in the Strait of Hormuz is a major risk-off event being unwound, similar to what we observed back in 2015 with the initial nuclear deal negotiations. A final agreement would likely weigh on oil prices and further weaken the dollar’s appeal. Selling out-of-the-money USD calls could be a way to express this view.
Implied volatility for the currency pair has eased on the positive news, but this may be a chance to consider strategies that benefit from a potential reversal. If the talks break down, we could see a rapid flight back to the dollar. Buying cheap, short-dated EUR puts could serve as a tactical hedge against this risk over the next few weeks.
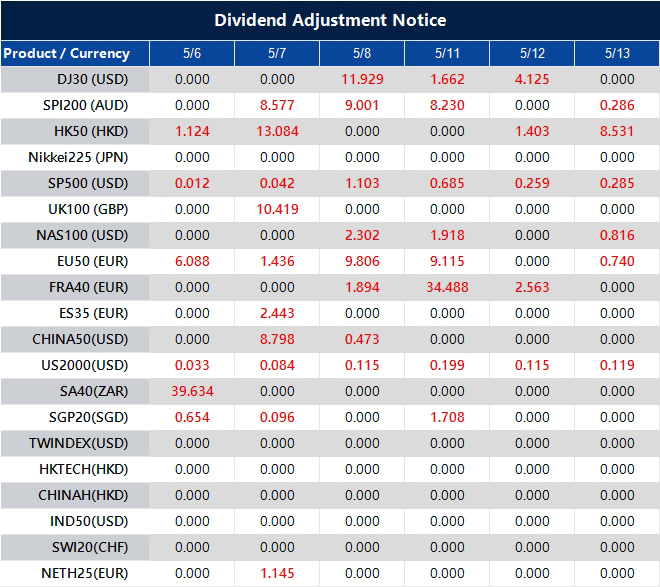
Please note that the dividends of the following products will be adjusted accordingly. Index dividends will be executed separately through a balance statement directly to your trading account, and the comment will be in the following format “Div & Product Name & Net Volume”.
Please refer to the table below for more details:
The above data is for reference only, please refer to the MT4/MT5 software for specific data.
If you’d like more information, please don’t hesitate to contact [email protected].
Voya Financial reported revenue of $318 million for the quarter ended March 2026, up 8.2% year on year. EPS was $2.26, compared with $2.15 a year earlier.
Revenue beat the Zacks Consensus Estimate of $310.83 million by 2.31%. EPS exceeded the consensus estimate of $2.02 by 11.88%.
Total AUM and AUA in Retirement were $779.7 billion versus an average estimate of $798.44 billion. Client Assets in Retirement eliminations were $-4.76 billion versus $-9.42 billion estimated.
General Account total AUM and AUA were $36.9 billion compared with a $37.71 billion estimate. End of period AUM was $169.77 billion for Institutional versus $173.23 billion estimated, and $146.76 billion for Retail versus $151.71 billion estimated.
Client Assets subtotal for external clients were $316.53 billion versus $324.94 billion estimated. Net investment income revenue was $569 million versus $515.52 million estimated, a 1.6% rise year on year.
Premiums were $744 million compared with a $787.18 million estimate, up 1% year on year. Fee income was $604 million versus $659.42 million estimated, up 6% year on year.
Adjusted operating revenues in investment management were $243 million for fee income versus $247.6 million estimated, up 3% year on year. Total investment management adjusted operating revenues were $251 million versus $255.74 million estimated, up 3.3%.
Investment management net investment income and net gains (losses) were $7 million versus $7.65 million estimated. This was up 16.7% year on year.
Voya’s recent earnings report presents a classic case of a strong headline beat hiding underlying weakness, which creates an opportunity for us. The reported 8.2% year-over-year revenue growth and an 11.88% earnings surprise will likely cause an initial positive reaction in the stock price. Traders should be cautious, as the drivers of this beat appear to be unsustainable.
The core issue is the miss on Assets Under Management (AUM) across the board, which is the primary engine for future fee income. We see that total retirement AUM missed estimates by over $18 billion, with similar shortfalls in both institutional and retail client assets. This suggests the company is struggling to attract and retain capital, which is a bearish signal for future quarters.
The strong earnings were fueled by a beat in net investment income, which has been boosted by the higher interest rate environment that persisted through 2025. This income surge masked disappointing results in fee and premium income, which are more indicative of core business health. As the market digests this report, the focus will likely shift from the temporary income boost to the weaker fundamental asset growth.
This is occurring in a challenging market, where actively managed funds saw over $400 billion in net outflows in 2025, a trend that appears to be continuing. Even with the S&P 500 gaining a modest 4% year-to-date in 2026, Voya’s AUM has not kept pace with analyst expectations. This context makes the initial positive stock reaction look like a potential bull trap.
Therefore, we should view any initial strength as an opportunity to initiate bearish positions. Buying put options dated a few weeks out could capitalize on a potential price decline as the market sentiment shifts to the weaker AUM figures. This strategy allows us to profit if the stock corrects downwards once the initial earnings enthusiasm fades.
EUR/JPY fell on Wednesday from just under 185.00 to 182.05, then rebounded to 183.40. Moves in other Yen pairs were also reported, raising suspicion of action by Japan’s Ministry of Finance.
Japan does not comment on currency operations, but Bank of Japan data released last week indicated the ministry may have used 5.48 trillion Yen (USD 35 billion) to support the Yen last Thursday. A former Japanese official also warned of possible further action during the Golden Week holiday.
Intervention Risk Back In Focus
Finance Minister Satsuki Katayama repeated this week that Tokyo would act against speculative Yen selling. She said “decisive measures” would be taken in line with a statement signed with the United States last year, at an Asian Development Bank meeting in Uzbekistan.
Attention now turns to Euro area data, including Germany and Eurozone final HCOB Services PMI readings for April and March PPI figures. In Japan, Labour Cash Earnings and the minutes from the Bank of Japan’s latest policy meeting are due in Thursday’s Asian session.
As we see EUR/JPY trading near the 195.50 level, the risk of intervention from Japanese authorities feels very familiar. We are reminded of the events around this time in May 2025, when a suspected intervention pushed the pair down by three hundred pips in a matter of hours. The current high levels present a similar setup for another sharp, sudden move.
Looking back at the data from the 2025 intervention, we saw the Ministry of Finance deploy an estimated ¥5.48 trillion to defend the currency. That action showed a clear willingness to spend significantly to curb what they called speculative moves against the Yen. This historical precedent is the most important factor for traders to consider right now.
The fundamental picture continues to support a weak Yen, which only increases the tension. The interest rate differential remains wide, with the ECB’s policy rate at 3.0% while the Bank of Japan’s rate is only at 0.5%, encouraging carry trades that sell the JPY. Recent Eurozone core inflation data holding firm at 2.7% suggests the ECB will be slow to cut rates further, keeping this pressure on.
Options Volatility Likely To Rise
For derivative traders, this means we should expect a significant increase in implied volatility for Yen pairs. During the intervention period in 2025, one-month implied volatility on USD/JPY jumped from around 8% to over 12%, making options much more expensive. A similar spike is likely now, so positioning before volatility rises further is key.
This environment suggests that buying downside protection, such as EUR/JPY put options, could be a prudent strategy. These positions would benefit directly from a sudden, intervention-driven drop in the exchange rate. The cost of these options will rise as intervention fears grow, rewarding those who act preemptively.
Russia’s S&P Global Services Purchasing Managers’ Index (PMI) rose to 49.7 in April. It was 49.5 in the previous month.
With Russia’s services sector activity improving to 49.7, we are seeing the pace of contraction slow significantly. While this is still below the 50-point mark indicating growth, the positive trend suggests the domestic economy is nearing a point of stabilization. This subtle shift is important, signaling that the worst of the recent economic pressure might be easing.
Services Activity Nearing Stabilization
This data could provide a floor for the Russian ruble, which has shown resilience holding below the 95 level against the US dollar. With signs of economic stabilization, the central bank may be less inclined to cut interest rates, which supports the currency. We believe selling short-term RUB puts or constructing bull put spreads could be a viable strategy to capitalize on this reduced downside risk.
For equities, the MOEX Russia Index has been trading in a range between 3,100 and 3,300 for the past quarter. This PMI data reinforces the lower end of this trading band, making a sharp breakdown less likely. Looking back at 2025, we saw a similar period where stabilizing economic data led to a prolonged period of range-bound trading rather than a new bull market.
Overall, the signal is not one of aggressive buying but of fading pessimism and potentially lower volatility. Traders should consider strategies that benefit from stability, such as selling out-of-the-money options on Russian ETFs. The data suggests the economic environment is becoming more predictable, which typically dampens the large price swings seen over the last few years.
Gold prices in the United Arab Emirates rose on Wednesday, based on data compiled by FXStreet. Gold was priced at AED 549.08 per gram, up from AED 538.00 on Tuesday.
Gold rose to AED 6,404.37 per tola from AED 6,275.10 a day earlier. The listed rates were AED 5,491.08 for 10 grams and AED 17,078.19 per troy ounce.
Uae Gold Rate Snapshot
FXStreet derives UAE gold prices by converting international prices using USD/AED and local units. Prices are updated daily at the time of publication and are for reference, as local rates may differ slightly.
Central banks are the largest holders of gold. They added 1,136 tonnes worth about $70 billion in 2022, according to the World Gold Council, the highest annual total since records began.
Gold prices often move opposite to the US Dollar and US Treasuries. Price drivers also include geopolitical risk, recession fears, interest rates, and changes in the US Dollar, as gold is priced in dollars (XAU/USD).
We are seeing gold prices firm up, which reflects a broader trend linked to shifting market expectations. The recent strength is largely tied to signals from the US Federal Reserve suggesting a potential pause in the rate-hiking cycle that defined the second half of 2025. As a non-yielding asset, gold becomes more attractive when the opportunity cost of holding it, set by interest rates, stops rising.
Market Strategy Considerations
Central bank demand continues to provide a strong floor for the price, with recent data for the first quarter of 2026 showing net purchases of over 290 tonnes globally. This robust buying, particularly from emerging market banks, continues the record pace we saw a few years back in 2022 and helps insulate the metal from short-term dips. April 2026 inflation figures, while slightly lower, also remain above central bank targets, reinforcing gold’s appeal as a hedge.
The US Dollar index has softened nearly 2% since the March 2026 Fed meeting, providing a direct tailwind for gold prices. We are also monitoring ongoing geopolitical tensions in Eastern Europe, which is sustaining safe-haven flows into the asset. This combination of a weaker dollar and risk aversion creates a supportive environment for further gains.
Given this backdrop, we should consider positioning through long-dated call options to capture further upside while clearly defining our risk. With implied volatility rising, selling cash-secured puts near key technical support levels, such as the $2,450 per ounce mark, could be an effective strategy to collect premium. This approach allows us to benefit from the upward trend even if the price consolidates in the near term.
When we look back at the price action in 2025, we remember the sharp pullback that occurred when the market incorrectly priced in several aggressive rate hikes. Any surprisingly strong economic data that shifts the Fed’s tone could trigger a similar sell-off, making tight stop-losses on futures positions crucial. We must also watch the stock market, as its current strength could eventually draw capital away from safe havens if risk appetite continues to grow.