Back

SpaceX IPO Rumours Explained: What’s True and What’s Not

Key Points

  • SpaceX is not publicly traded, and there is no confirmed IPO timeline despite ongoing speculation.
  • Elon Musk has consistently prioritised long-term mission goals over public market pressure.
  • A Starlink IPO is more realistic, but only once revenue and cash flow stabilise.

Interest in a SpaceX IPO has grown alongside the company’s rapid rise in valuation and influence. As one of the most valuable private companies in the world, SpaceX sits at the centre of several powerful narratives — space exploration, satellite infrastructure, and next-generation technology.

That combination makes it a natural target for speculation.

Search trends around “SpaceX stock” and “SpaceX IPO” have surged, particularly as retail traders look for the next high-growth opportunity similar to Tesla or Nvidia. However, much of what circulates online tends to blur the line between possibility and reality.

To understand whether a SpaceX IPO is likely, it is important to separate speculation from what has actually been said and done.

Myth 1: SpaceX is Already Publicly Traded

SpaceX remains a privately held company, and this is one of the most common points of confusion.

Unlike publicly listed firms, SpaceX shares are not available on exchanges such as the Nasdaq or NYSE. Ownership is concentrated among founders, employees, and private traders who participate in funding rounds.

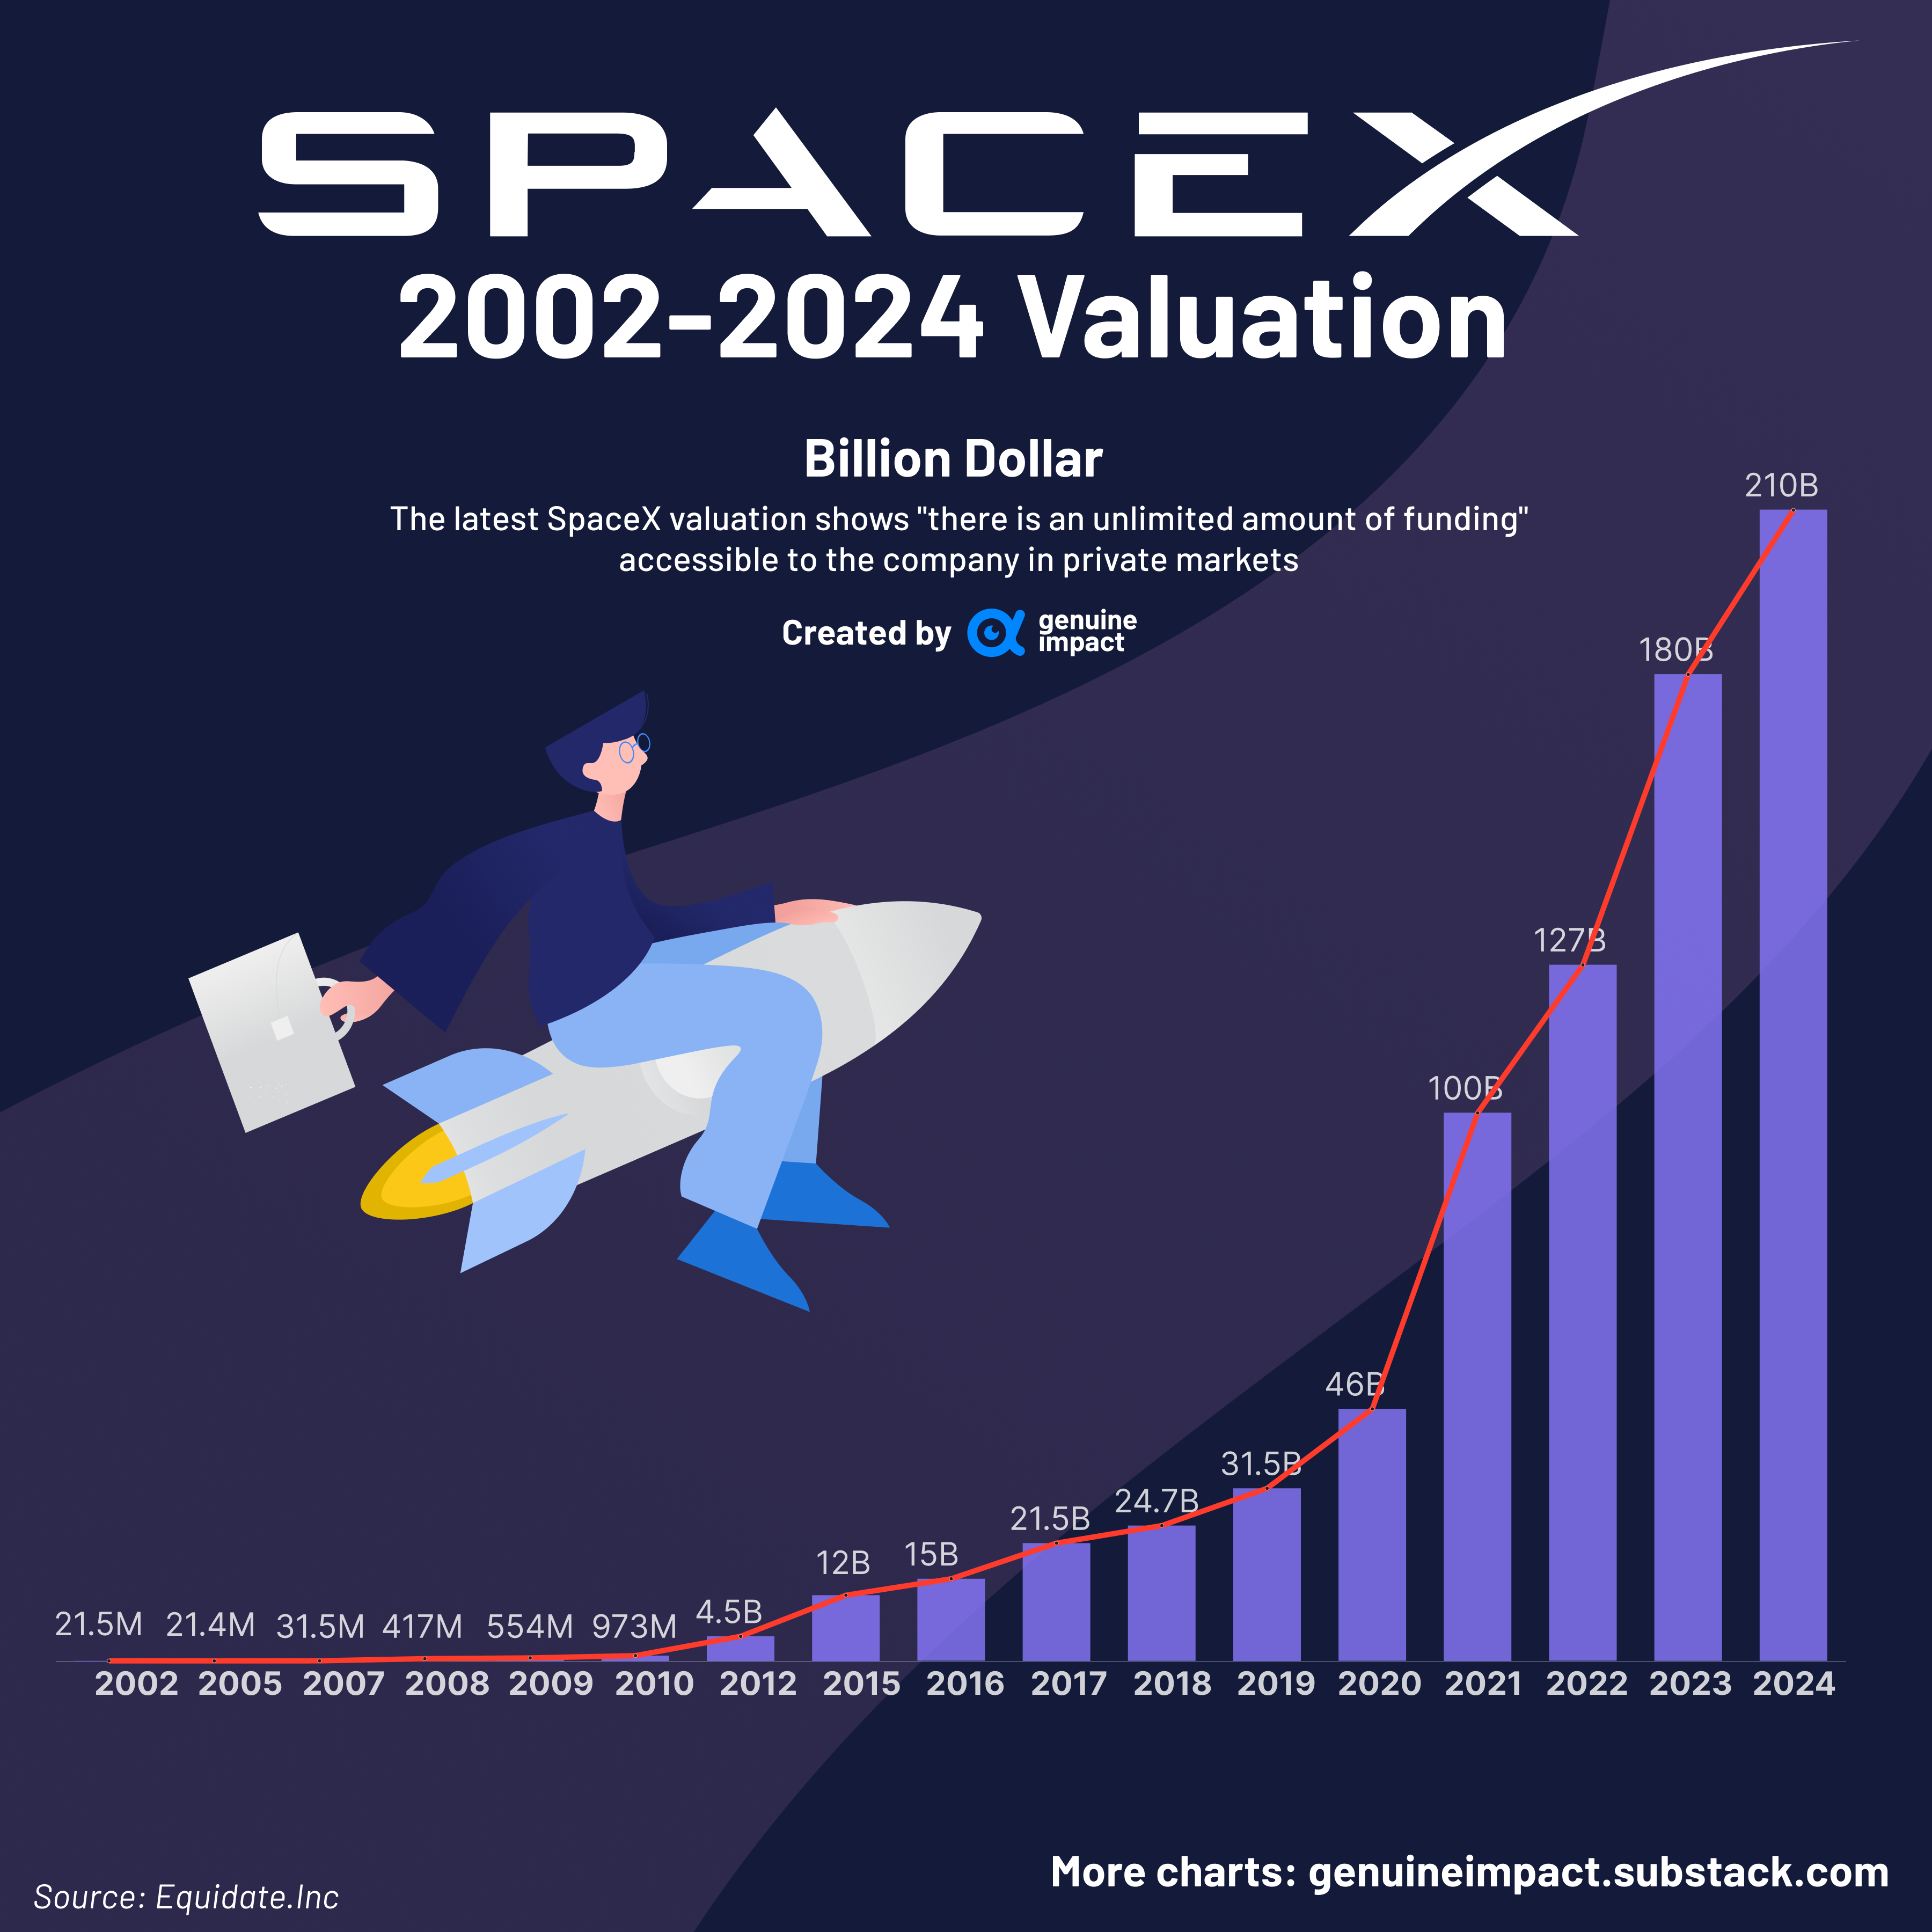
Recent private market valuations have placed SpaceX in the range of $150 billion to $180 billion, reflecting strong investor confidence in both its launch business and Starlink division.

However, this valuation does not translate into public accessibility. For most traders, SpaceX stock simply does not exist in a tradable form.

This disconnect between visibility and accessibility is one of the main drivers behind persistent IPO rumours.

Myth 2: A SpaceX IPO Has Already Been Announced

There is no confirmed SpaceX IPO date, and no official filing indicating that the company is preparing to go public.

Elon Musk has addressed this topic on multiple occasions, and his position has been relatively consistent. He has emphasised that taking SpaceX public too early could create pressure to prioritise short-term profitability over long-term objectives.

This matters because SpaceX operates very differently from a typical technology company. Its core activities likerocket development, reusable launch systems, and deep-space missions require heavy capital investment with uncertain timelines.

In public markets, companies are expected to deliver predictable earnings and quarterly performance. SpaceX’s business model does not naturally fit that framework.

Myth 3: SpaceX Will Go Public Soon

Speculation around a near-term IPO often resurfaces during periods of strong valuation growth or major announcements. However, there is little evidence to suggest that a full SpaceX listing is imminent.

The company continues to reinvest heavily into:

  • Starship development.
  • Launch capacity expansion.
  • Global satellite infrastructure.

These projects are long-cycle investments that may take years to generate consistent returns.

Musk has previously indicated that a public listing would only make sense once revenue streams become more stable and predictable. At present, SpaceX’s value is still closely tied to future potential rather than fully realised earnings.

That makes it less suited to the expectations of public equity markets in the near term.

What’s Actually Likely: A Starlink IPO First

If any part of SpaceX were to go public, the most likely candidate is Starlink.

Starlink differs from the rest of SpaceX in one key way: it generates recurring revenue. The satellite internet service has expanded rapidly, serving millions of users across multiple regions and building a more traditional subscription-based business model.

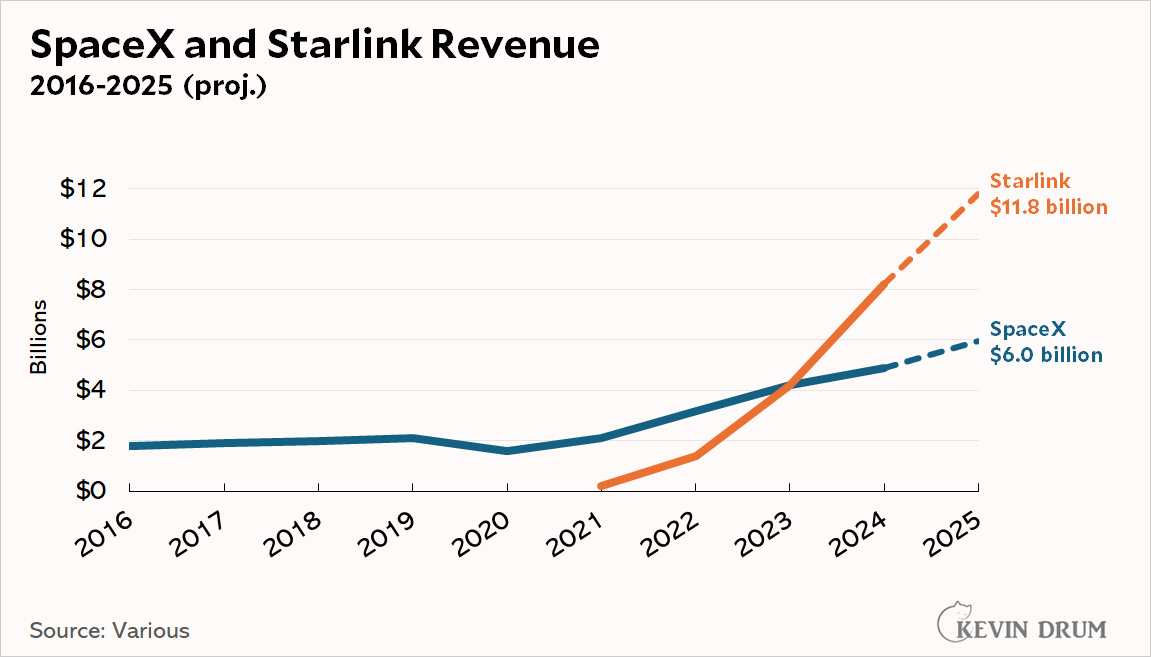
Source: Jabberwocking

This creates a clearer path toward IPO readiness.

Musk has suggested that Starlink could eventually be spun off as a separate entity once:

  • Cash flow becomes more predictable.
  • Operational scaling stabilises.
  • The business reaches a more mature stage.

From a market perspective, Starlink fits the profile of a typical IPO candidate far more closely than SpaceX’s launch operations.

This is why many analysts view a Starlink IPO as the more realistic scenario, rather than a full listing of SpaceX itself.

Why Starlink Still Matters

Even with the fresh SpaceX IPO headlines, Starlink remains the most useful part of the story for traders to understand.

Starlink is no longer just a futuristic side project. In its 2025 progress report, the company said it connected more than 4.6 million new active customers in that year alone and expanded service to 35 additional countries and territories. It also said Direct to Cell service is now commercially available in the United States and New Zealand, supported by a constellation of more than 400 satellites.

That matters because public markets understand recurring services better than they understand long-horizon engineering ambition. Rocket launches, reusable systems, and deep-space projects are powerful narratives, but recurring connectivity revenue, mobile partnerships, and scaling subscriber growth are easier for investors to price.

What Traders Can Actually Watch Instead

If SpaceX itself still sits out of reach for now, the better question becomes: where does the same theme show up in listed markets?

The first bucket is telecom adoption. T-Mobile has the clearest live commercial connection to Starlink through T-Satellite. When the Starlink story strengthens, this is one of the first listed names traders may want on the watchlist.

The second bucket is satellite communications peers and rivals. AST SpaceMobile says it is building direct-to-cell broadband to end dead zones. Iridium describes itself as a global mobile voice, data, and PNT satellite network and is pushing forward with NTN Direct.

These names do not give direct ownership of SpaceX or Starlink, but they do sit in the same commercial conversation around satellite connectivity, coverage, and next-generation network infrastructure.

The third bucket is space infrastructure. Rocket Lab describes itself as an end-to-end space company. That makes it a cleaner “space economy” read-through than stretching into unrelated tech stocks that only have a weak thematic link. CFD shares of companies like Virgin Galactic (SPCE) may also appeal to traders looking to dabble in the space sector.

The fourth bucket is thematic ETF exposure. Where available on the product list, space-focused ETFs can offer a broader basket approach. Roundhill’s MARS ETF says it invests in companies building the space economy, and its March 2026 factsheet lists Rocket Lab, AST SpaceMobile, EchoStar, Globalstar, and Viasat among its top holdings. Procure’s UFO ETF and VanEck’s JEDI ETF also explicitly frame themselves around space, satellite, and communications exposure.

SpaceX may still be private today, but the price action around satellite communications and the wider space economy is already visible in listed markets. Track relevant shares, ETFs, and market themes on the VT Markets app.

What a SpaceX IPO Could Mean for Markets

If SpaceX were to go public, it would likely be one of the most significant listings in modern market history.

At current valuation levels, an IPO could:

  • Rank among the largest technology listings ever.
  • Attract substantial institutional capital.
  • Influence index weightings and fund allocations.

Beyond size, it would also carry narrative weight. SpaceX sits at the intersection of several major themes:

  • Advanced technology.
  • Infrastructure expansion.
  • Long-term innovation.

A public listing would reinforce these themes and potentially draw further capital into adjacent sectors.

Bottom Line

SpaceX IPO rumours are driven more by investor interest than by confirmed plans.

The company remains private, with no official listing timeline. While a Starlink IPO is a realistic possibility in the future, a full SpaceX public offering appears unlikely in the near term.

For now, SpaceX continues to prioritise long-term growth and innovation over public market participation—making it one of the most closely watched private companies in the world.

Create a live VT Markets account today to access our platform features, including market insights and educational content.

FAQs

Is SpaceX publicly traded?
No, SpaceX is a private company and is not listed on any stock exchange.

Has SpaceX officially announced its IPO?
Reuters has reported that SpaceX is aiming to file soon and may reserve a large share of the offering for retail investors, but final details are still not confirmed publicly.

Why does Starlink matter so much to this story?
Because Starlink has real commercial scale. It added more than 4.6 million new active customers in 2025, expanded to 35 more countries, and now has Direct to Cell service live in the United States and New Zealand.

What public assets are closest to the Starlink theme?
T-Mobile is one of the clearest public links through its T-Satellite with Starlink service. Traders can also watch satellite communications names such as AST SpaceMobile and Iridium, plus space infrastructure companies and relevant ETFs where available.

Why has SpaceX not gone public?
SpaceX remains private to maintain long-term focus, avoid short-term market pressure, and retain operational flexibility.

Start trading now – Click here to create your real VT Markets account

The US 4-week bill auction yield edged up, rising from 3.615% to 3.62%

The United States 4-week Treasury bill auction yield rose to 3.62% from 3.615%. This change indicates a small increase in the yield set at the latest auction compared with the previous result.

Short Term Rates Stay Firm

We’re seeing this slight rise in the 4-week bill auction to 3.62% not as an isolated event, but as another sign that short-term rates are remaining firm. This small uptick confirms the market’s view that the Federal Reserve isn’t in a rush to lower borrowing costs. This reinforces a “higher for longer” sentiment for interest rates in the immediate future. The broader economic picture supports this view, with the latest February 2026 inflation report showing a stubborn 3.1% CPI, slightly above expectations. Combined with a robust February jobs report that added 215,000 positions, the Fed has ample reason to maintain its current policy stance. These figures suggest that any thoughts of an imminent rate cut are likely premature. This environment feels very similar to what we experienced for long stretches of 2025, where the market consistently priced in rate cuts that the Fed was hesitant to deliver. We learned last year that fighting a data-dependent Fed is a difficult trade. The current data continues to vindicate the central bank’s cautious approach. For derivatives traders, this points towards strategies that benefit from elevated or rising short-term interest rate volatility. The uncertainty around the timing of the next Fed move should keep the front end of the yield curve active. We believe buying options on SOFR futures or short-term bond ETFs could be a prudent way to position for price swings in the coming weeks. Given this, we are looking at opportunities to sell out-of-the-money call options on Treasury futures, as a significant rally in bond prices (and drop in yields) seems unlikely. This strategy capitalizes on the view that yields will remain range-bound or drift slightly higher. It allows us to collect premium while the market waits for a decisive signal from the economic data.

Positioning For The Next Fed Signal

Create your live VT Markets account and start trading now.

Start trading now – Click here to create your real VT Markets account

GBP/USD steadies near 1.3360, as Middle East tensions and firm US jobs bolster the dollar

GBP/USD held near 1.3360 on Thursday as tensions in the Middle East supported the US Dollar. The pair was little changed while markets focused on geopolitics rather than routine data. Risk sentiment weakened after President Donald Trump urged Iran to reach a deal, and Axios reported the US Pentagon is preparing for a “final blow” that could include ground forces. Oil climbed, with WTI up over 2.70% to $93.85 per barrel, and the Dollar Index rose 0.14% to 99.77.

Geopolitical Risk Drives Dollar Demand

US Initial Jobless Claims for the week ending March 21 were 210K, matching expectations and up from 205K. Markets also watched planned remarks from Fed officials Lisa Cook, Stephen Miran, Philip Jefferson, Michael Barr and Dallas Fed President Lorie Logan. In the UK, GfK Consumer Confidence for March was expected to worsen to -24 from -19. Markets also weighed the risk of higher fuel costs alongside slower activity and steady or higher interest rates. Technically, GBP/USD faced resistance near 1.3430 and around 1.3500. Support was near 1.3340, with further support near 1.3220 if the pair fell. We remember the situation well back in 2025, when GBP/USD was struggling around 1.3360 amid serious geopolitical tensions. Fast forward to today, March 26, 2026, the pair is trading lower near 1.2850, showing that the underlying strength in the US dollar has persisted. The acute Mideast crisis of last year has passed, but its effects on the market’s risk perception are still felt.

Oil Fed Policy And Gbpusd Trend

The intense oil spike to over $93 a barrel that we saw in 2025 was a key driver for the dollar’s safe-haven appeal. While WTI has since moderated to around $82 a barrel, the US Dollar Index remains elevated at 101.50, well above the 99.77 level seen during that period. This shows the market is still pricing in a premium for the dollar due to ongoing inflation concerns and a relatively hawkish Federal Reserve. Last year, the US labor market was very tight, with jobless claims around 210K, allowing the Fed to focus squarely on inflation. We’ve seen a slight softening since then, with recent weekly claims averaging closer to 235K, but this has not been enough to fully ease the Fed’s concerns. The stagflationary scenario that loomed in 2025 remains a credible threat, forcing the Fed to maintain a cautious stance. In the UK, the expected deterioration in consumer confidence we were watching in 2025 has materialized and worsened. The GfK index didn’t just fall to -24; recent readings for March 2026 show it hovering near -28, reflecting persistent cost-of-living pressures. This leaves the Bank of England in a difficult position, unable to support the economy without risking further inflation, which continues to weigh on the Pound. The technical picture has evolved significantly since last year’s analysis. The support level at 1.3340 has long been broken and now acts as a significant resistance area, illustrating the bearish trend that has taken hold. For traders, this suggests that selling into any rallies remains the favored strategy, with put options offering a clear way to position for further downside. Buying puts with a strike price around 1.2700 could provide protection against a break of the recent lows. Create your live VT Markets account and start trading now.

Start trading now – Click here to create your real VT Markets account

TD Securities expects February UK retail sales to fall 0.6% monthly, as weather hinders shoppers, momentum persists

TD Securities forecasts UK retail sales in February at -0.6% month-on-month, compared with the market view of -0.7% and January’s 1.8%. The firm expects this to reverse part of the gains seen in the previous two months. The report links the decline to earlier one-off supports fading. It also points to adverse weather reducing footfall in physical shops and lowering sales during the month.

Uk Consumer Momentum Still Positive

Despite the weaker monthly reading, TD Securities says broader UK consumer momentum remains positive. It also notes that uncertainty linked to the November Budget has eased. We anticipate UK retail sales for February will show a decline of about -0.6% from the previous month, which would be a slightly better result than the wider market expectation of -0.7%. This softening is expected after a very strong 1.8% gain in January. The main reasons for the pullback are likely a fade from post-holiday shopping and poor weather that reduced foot traffic to physical stores. This single data point should be viewed against a backdrop of resilient consumer spending and sticky inflation, which we saw came in at 2.4% for February just last week. The Bank of England has signaled it will remain data-dependent, so a slight beat on retail sales, coupled with stubborn inflation, reduces the probability of an interest rate cut in the second quarter. This environment favors a stronger British pound in currency option markets. Looking back, we remember the deep consumer uncertainty that plagued the markets through the middle of 2025. The current underlying strength is a notable shift from that period, especially now that the questions surrounding the November budget have faded. Therefore, a minor monthly dip in sales does not change our overall positive outlook on the UK consumer.

Trading Implications For Sterling And Uk Assets

The latest GfK consumer confidence survey for March also supports this view, ticking up to its highest level in over two years. For traders, this suggests that any weakness in sterling following the retail sales number could be short-lived. We see this as an opportunity to position for continued economic resilience, possibly through call options on the FTSE 100 or put options on the EUR/GBP pair. Because our forecast is so close to the market consensus, the actual data release may not create significant immediate volatility. Traders might consider strategies that sell short-term options premium, anticipating a muted reaction. The bigger picture for the coming weeks, however, points towards underlying strength that should support UK assets and the pound. Create your live VT Markets account and start trading now.

Start trading now – Click here to create your real VT Markets account

Apple confirms wedge breakdown, extending losses as follow-through selling supports completion and hints at a potential bounce retracement

Apple has moved out of a wedge pattern and kept falling, with further selling confirming the break. Price may retrace towards $260 to test the former wedge boundary, which can act as resistance after a break. If there is no retrace, price may bounce near $247.99, where a recent pivot low lines up with an unfilled technical level. That area marks a prior turning point where demand appeared and may do so again if the decline continues. The pivot low at $247.99 shows past buying activity at that price, making it a level to watch for stabilisation or reversal. The $260 area is the first level to monitor if price rallies back to test the broken pattern line. The wedge break shifts the chart from consolidation to a downtrend, with $260 and $247.99 as the main reference points. If selling continues, a move towards $247.99 could occur quickly. With Apple now clearly breaking its key wedge pattern, the immediate outlook has shifted to bearish for the coming weeks. The follow-through selling we saw this week validates this weakness, making protective put options with April and May expirations a primary consideration. Recent analyst downgrades from earlier this month, citing concerns over slowing growth in the services division, appear to be adding fundamental weight to this technical breakdown. We are watching the $260 level as the first major test, which was the former support of the broken pattern. For traders anticipating a short-term pop, selling call credit spreads with a short strike right at or above $260 could be an effective strategy to capitalize on this level acting as new resistance. Options data from yesterday already shows a notable increase in open interest for the weekly $260 calls, suggesting many are positioning for this ceiling to hold firm. If the stock forgoes a retrace and selling pressure continues, the $247.99 pivot low is our downside target. This price is where significant buying emerged in the fourth quarter of 2025, making it a logical area to take profits on bearish positions. The current momentum feels reminiscent of the sharp drop we saw back in 2024 after the initial impacts of new European regulations became clear. This breakdown from consolidation implies an expansion in volatility, which is a key factor for any options strategy. Apple’s 30-day implied volatility has already jumped from the low 20s to over 34% this week, making long options more expensive. This suggests that using spreads to define risk and reduce premium outlay might be more prudent than buying puts or calls outright.

Start trading now – Click here to create your real VT Markets account

Kansas Fed manufacturing activity in the United States rises to 11 for March, up from 10 previously

The Kansas City Federal Reserve’s manufacturing activity index for the United States rose to 11 in March. It was 10 in the previous reading. The Kansas Fed manufacturing reading came in at 11, a slight beat over the expected 10. This indicates manufacturing activity in the region is expanding a bit more than we thought. On its own this isn’t a major market mover, but it fits into a pattern of economic resilience.

Implications For Fed Policy

This data point lands at a tricky time, especially after the latest CPI report showed inflation still running sticky at 2.9%. It gives the Federal Reserve another reason to delay any potential rate cuts we had been anticipating for the summer. Therefore, we should be cautious about positions that rely on falling short-term interest rates in the next few weeks. We saw a similar pattern back in the second half of 2024, where steady economic data kept pushing back the timeline for rate cuts. That period saw the 2-year Treasury yield hold firm around 4.2%, creating headwinds for growth stocks. We could see traders begin to price out a mid-year rate cut, which would put upward pressure on front-end bond yields again. For equity index derivatives, this creates a mixed signal, potentially capping upside as interest rate fears linger. With no major economic shock suggested by this data, implied volatility may continue to drift lower. This environment could favor selling premium through strategies like iron condors on the SPX, capitalizing on range-bound trading.

Options Positioning Considerations

Create your live VT Markets account and start trading now.

Start trading now – Click here to create your real VT Markets account

Scotiabank says USD/CAD keeps rising as safe-haven US Dollar demand lifts it above 1.3543 fair value

USD/CAD has kept moving higher as demand for the US Dollar has supported the pair. It is trading well above an estimated fair value of 1.3543. The Canadian Dollar has weakened, with trading described as low volume and low conviction. The move has been linked to broad US Dollar demand.

Canadian Dollar Under Pressure

Some fundamentals have shifted against the Canadian Dollar, with front-end spreads widening in the US Dollar’s favour. Canadian terms of trade have also softened. USD/CAD has pushed through the low 1.38 area and moved above the 200-day moving average, which is at 1.3805. Short-term technical signals remain bullish after this break. Further gains are said to be possible towards the low 1.39s. Support levels are noted at 1.3790/00 and 1.3750/60. The report states the pair advanced through resistance in the mid-1.37s and then the low 1.38s. It also notes the article was produced with help from an artificial intelligence tool and reviewed by an editor.

Looking Back At The 2025 Setup

Looking back at the analysis from 2025, we recall the view that the US dollar’s haven status was the primary force driving USD/CAD higher. The pair was trading significantly above its estimated fair value, breaking cleanly above key technical levels like the 200-day moving average. This created a clear bullish signal for the market at the time. Given the strong upward momentum observed last year, the move towards the low 1.39s was a credible target. This environment favored strategies like buying USD call options or selling CAD put options to profit from the expected rise. The defined support levels around 1.3750/60 offered clear points to manage risk on these bullish positions. The fundamental justification for that trend became reality as interest rate differentials widened through late 2025. The U.S. Federal Reserve maintained a hawkish stance due to persistent core inflation, which averaged 3.1% in the final quarter of 2025, while the Bank of Canada signaled a more dovish tilt. This policy divergence was a powerful catalyst that fueled the USD’s outperformance against the CAD. Furthermore, we saw Canadian terms of trade weaken as WTI crude oil prices slid to nearly $70 per barrel in December 2025. This contrasted with a resilient US economy that continued to post stronger job numbers than anticipated. These factors provided little independent support for the Canadian dollar, forcing it to follow the broader, strong-USD trend. As of today, March 26, 2026, the situation has evolved, with USD/CAD consolidating around the 1.36 handle. With WTI crude recovering to over $82 a barrel and recent Canadian inflation data for February 2026 showing a surprising uptick, the intense bullish pressure from last year has eased. We must now question whether the peak of USD dominance from that period has passed. In the coming weeks, traders should watch for a potential shift in this dynamic. While the bullish trend of 2025 was profitable, the current consolidation suggests a more balanced market. It may be prudent to consider strategies that can profit from either a range-bound environment or a new directional break, such as selling out-of-the-money strangles. Create your live VT Markets account and start trading now.

Start trading now – Click here to create your real VT Markets account

US equities opened lower as investors weighed reduced Trump TACO odds and rising Iran war escalation fears

US shares opened lower on Thursday as risk increased that the Iran war will escalate rather than de-escalate. The conflict is in its fourth week, and markets reacted after Iran said no talks had taken place despite US claims. Iran also said it did not take an administration “15-point” ceasefire deal seriously. The earlier market view was that economic fallout might trigger a policy reversal linked to the “TACO” phrase.

Rising Energy And Rate Pressures

US oil rose nearly 4% and moved towards $94 after dipping below $90 earlier in the week. US Treasury yields rose across the curve from 12-month to 30-year maturities. Reports described the movement of thousands of airborne and ground troops to the region, with talk of a major action after markets close on Friday. Axios reported planning for a “final blow”, with more bombing and attempts to seize Kharg, Abu Musa and Lakan islands near the Strait of Hormuz. The S&P 500 traded down 0.4% to 0.9% on Thursday morning, but was still up about 1% for the week. Key levels cited were 6,550, with further supports at 6,360 and 6,200, while 7,000 was described as resistance. The index was said to be below its 200-day simple moving average. The Fed indicated last week that rates would remain unchanged for the foreseeable future.

Positioning For A Volatility Surge

With talk of a major offensive after markets close on Friday, we should anticipate a significant spike in market volatility. Trading the VIX through futures or options is a direct way to play this uncertainty. A long straddle on the SPY, which profits from a large move in either direction, could also be a prudent strategy ahead of the weekend. The most direct trade is a bullish one on oil, as any escalation threatens to close the Strait of Hormuz. We saw WTI crude futures surge over 35% in just a few months following the start of the Ukraine war in 2022, and a direct conflict involving Iranian oil infrastructure could trigger a similar or even sharper move. Buying call options on WTI futures or energy sector ETFs like XLE positions us for this likely outcome. For the broader market, a defensive stance is warranted as the S&P 500 is struggling below its 200-day moving average. With the Fed signaling no rate cuts due to oil-driven inflation, there is little support for stocks in the near term. We should consider buying put options on the SPX to hedge portfolios or to speculate on a break below the key 6,550 support level. Beyond the major indices, we can look at specific sectors that will react differently to the conflict. Defense contractors in ETFs like ITA are poised to benefit from increased military action, making call options attractive. Conversely, airlines and consumer discretionary stocks will suffer from higher fuel costs and waning consumer confidence, creating opportunities for bearish put strategies. Given the risk of a sharp downturn, hedging long-term equity portfolios is critical right now. Looking back at the market turmoil in early 2022, we remember how quickly geopolitical events can erase gains, underscoring the value of protective puts. Any surprise de-escalation remains a tail risk, but the prevailing evidence points toward preparing for further downside. Create your live VT Markets account and start trading now.

Start trading now – Click here to create your real VT Markets account

Geopolitical tensions buoy the US Dollar, keeping AUD/USD near monthly lows around 0.6920, down 0.35%

AUD/USD traded near 0.6920 on Thursday, down 0.35% on the day, and stayed close to monthly lows during a bearish consolidation. The pair struggled to rebound as the US Dollar remained supported. Risk appetite stayed weak after Iran rejected talks and dismissed a ceasefire proposal. Ongoing Middle East tensions and extra US troop deployments supported the US Dollar and weighed on the Australian Dollar.

Middle East Risks And Dollar Support

Energy supply worries added to inflation pressure, with the effective closure of the Strait of Hormuz lifting oil prices. Higher oil raised expectations that major central banks, including the Federal Reserve, will keep policy hawkish, pushing US Treasury yields up. In Australia, remarks from RBA Assistant Governor Christopher Kent did not lift the currency. He referred to inflation risks from higher energy prices and the need to keep policy restrictive, but the market response was limited. Commerzbank reported a stagflation backdrop, citing weaker growth, falling consumer confidence, and Services PMI slipping into contraction. Markets still priced about a 54% chance of a rate rise in May. Rabobank said Australia’s net energy exporter position could support trade conditions, projecting 0.71 in 3–6 months and 0.72 in 12 months. Near term, safe-haven demand, higher US yields, and few local supports kept pressure on the pair. This analysis from early 2020 captured a moment when safe-haven demand for the US dollar was high due to tensions in the Middle East. The Australian dollar was under pressure, trading near 0.6920, with markets focused on hawkish central banks. It reflected a world worried about geopolitical conflict and energy-driven inflation.

Shifting Macro Backdrop

Looking back on that period from the perspective of 2025, we saw how the global pandemic completely changed the narrative within weeks of this analysis being written. The massive coordinated central bank easing that followed dwarfed the geopolitical concerns of the day. This shift propelled the AUD/USD well above the 0.72 level later in 2020 as risk appetite returned. Now, in late March 2026, the environment is defined by slowing global growth rather than sharp geopolitical risk. Australian inflation has cooled to 3.2% in the latest quarterly data, allowing the RBA to maintain a neutral policy stance. Recent figures show the unemployment rate has ticked up to 4.3%, giving the central bank little reason to consider hikes. The US Federal Reserve is in a similar position, with recent data showing annual core PCE inflation at 2.8%, much closer to its target. Consequently, the AUD/USD is trading in a relatively tight range around 0.6650, a level it has struggled to break away from for months. This lack of clear direction calls for strategies that can profit from sideways movement. Given this low-volatility environment, traders should consider selling options to collect premium. Selling an AUD/USD iron condor with strikes set outside the recent 0.65 to 0.68 trading range could be an effective strategy for the coming weeks. This approach benefits from time decay and the pair remaining range-bound. Alternatively, for those with a slightly bearish bias, a bear call spread would offer a defined-risk way to bet against a significant rally. For example, one might sell the 0.6750 call and buy the 0.6850 call expiring in late April. This profits if the pair stays below the short strike price by expiration. Create your live VT Markets account and start trading now.

Start trading now – Click here to create your real VT Markets account

AUDUSD Hits Two-Month Low As Energy Shock Bites

Key Points

  • AUDUSD drops to around 0.687, marking a two-month low.
  • Inflation risks rise, with CPI seen nearing 4.5% and possibly 5% in Q2.
  • Markets price a 68% chance of a May hike, with rates seen at 4.75% by year-end.

The Australian dollar weakened to around $0.687, falling to its lowest level in two months as markets reassessed global growth risks.

The move reflects rising concern that a prolonged Middle East conflict could trigger a sustained energy shock, weighing heavily on commodity-linked currencies like the Aussie.

As a proxy for global growth and commodity demand, AUDUSD tends to weaken when risk sentiment deteriorates.

The Aussie may remain under pressure if growth concerns deepen and commodity demand softens.

Yield Advantage Narrows as Global Tightening Expands

One of the key supports for the Australian dollar, its relatively higher interest rates, is beginning to fade.

Markets now expect other major central banks to maintain or even increase tightening, narrowing Australia’s yield advantage.

This shift reduces the incentive for capital flows into the Aussie, particularly as global uncertainty rises.

Despite this, markets still price a 68% probability of a rate hike in May, with expectations for rates to reach 4.75% by year-end.

Rate support may offer limited upside unless the RBA turns more aggressive than global peers.

Inflation Pressures Rise as Energy Costs Surge

A sharp rise in petrol prices is feeding directly into Australia’s inflation outlook.

Economists expect headline CPI to rise toward 4.5%, with the potential to approach 5% in Q2 if energy prices remain elevated.

This creates a difficult environment for policymakers, as higher inflation may require tighter policy, even as growth slows.

The combination of rising costs and weaker consumption is beginning to weigh on household spending.

RBA Faces Growth Versus Inflation Trade-Off

The Reserve Bank of Australia is navigating a complex policy environment.

RBA Assistant Governor Christopher Kent has warned that a prolonged Gulf conflict could weigh on economic growth, even as the central bank remains focused on anchoring inflation expectations.

This reflects a broader global theme where central banks must balance inflation control with weakening economic conditions.

The RBA may remain data-dependent, with policy decisions increasingly shaped by energy prices and global developments.

Technical Analysis

The AUDUSD is trading around 0.6893, continuing a steady pullback after failing to hold above the 0.71–0.7180 resistance zone. The structure has shifted from a strong uptrend into a corrective phase, with bearish pressure building in the short term.

Trend Structure and Moving Averages

Price is now sitting below all key short-term moving averages:

  • MA5: 0.6946
  • MA10: 0.7003
  • MA20: 0.7033
  • MA30: 0.7049

This alignment shows a clear bearish stack, with all MAs sloping downward. The rejection from 0.7187 marked a local top, followed by consistent lower highs and lower lows.

The fact that price cannot reclaim even the MA5 suggests sellers remain in control.

Key Levels to Watch

  • Immediate Resistance: 0.6945 → 0.7000
  • Stronger Resistance: 0.7030 → 0.7050
  • Support: 0.6850 → 0.6800
  • Breakdown Level: Below 0.6800 opens 0.6700 region

The 0.6850 area is the first key support. A clean break below this level would confirm continuation of the downside move.

Price Behaviour Insight

The rally from 0.6421 into the 0.7187 high was strong and trend-driven. However, the recent structure shows:

  • Repeated rejection near highs
  • Tight consolidation turning into breakdown
  • Increasing downside follow-through

This is typical of a distribution phase transitioning into correction.

Volume has increased during the recent decline, suggesting more active selling interest compared to the earlier consolidation.

What to Watch Next

Focus on how price reacts around 0.6945 (MA5 zone):

  • Failure to reclaim: Keeps downside pressure intact
  • Break above 0.7000: Could trigger a short squeeze toward 0.7030–0.7050

Also monitor macro drivers:

  • USDX strength remains a headwind for AUD
  • Commodity prices, especially iron ore and oil, can influence AUD direction

Cautious Outlook

The short-term bias remains bearish while below 0.7000, with rallies likely to be sold. Momentum only stabilises if price can reclaim the 0.7030–0.7050 zone. Until then, the structure favours a drift lower toward 0.6850 and potentially 0.6800.

What Traders Should Watch Next

AUDUSD remains sensitive to both domestic and global drivers. Key factors include:

  • Oil price movements and energy supply conditions
  • Global growth outlook and risk sentiment
  • RBA policy expectations and inflation data
  • Central bank divergence across major economies

For now, the Aussie dollar is reacting more to global risks than domestic policy support, with energy-driven inflation and growth concerns shaping its near-term direction.

Learn more about trading Forex Pairs on VT Markets here.

FAQs

Why Did AUDUSD Fall to a Two-Month Low?

AUDUSD dropped to around 0.687 as energy-driven growth concerns reduced demand for risk-sensitive currencies like the Aussie.

How Do Rising Oil Prices Affect the Australian Dollar?

Higher oil prices increase inflation and reduce global growth, which weakens commodity demand and pressures the Aussie.

What Is Driving Australia’s Inflation Outlook Higher?

Petrol costs are rising sharply, with CPI expected to reach 4.5% and possibly 5% in Q2 if energy prices stay elevated.

Why Is The Aussie Losing Its Yield Advantage?

Other central banks are expected to tighten policy, narrowing the interest rate gap that previously supported AUDUSD.

What Are Markets Expecting From The RBA?

Markets price a 68% chance of a May rate hike, with rates seen reaching 4.75% by year-end.

Start trading now – Click here to create your real VT Markets account

Back To Top
server

Hello there 👋

How can I help you?

Chat with our team instantly

Live Chat

Start a live conversation through...

  • Telegram
    hold On hold
  • Coming Soon...

Hello there 👋

How can I help you?

telegram

Scan the QR code with your smartphone to start a chat with us, or click here.

Don’t have the Telegram App or Desktop installed? Use Web Telegram instead.

QR code