Gold prices in Pakistan rise today according to the latest market data
Gold prices in Pakistan went up on Wednesday, according to FXStreet data. The price per gram increased to 41,764.12 Pakistani Rupees (PKR), up from 41,381.18 PKR the day before. The price per tola also rose to PKR 487,126.90 from PKR 482,662.00.
FXStreet calculates gold prices using international rates (USD/PKR), updating the figures each day. The price per troy ounce was 1,299,022.00 PKR. FXStreet notes that local prices may vary slightly.
Gold prices rise in India today based on market data.
Gold as a Safe-Haven Asset
Gold is widely regarded as a safe-haven asset, helping to protect against inflation and currency devaluation. In 2022, central banks purchased a significant amount of gold—1,136 tonnes, valued at around $70 billion—to boost their reserves. The price of gold typically moves in the opposite direction of the US Dollar and US Treasuries, as well as riskier assets like stocks. Geopolitical events and changes in interest rates impact gold prices, which often rise when the US Dollar weakens. On January 14, 2026, gold prices are showing strength, reflecting a steady upward trend that is likely to continue. The international price hovers around $4,650, driven by expectations of rate cuts from the Federal Reserve and a generally weaker US Dollar. This creates a positive outlook for gold in the near term. The recent cooling of inflation also plays a key role. In December 2025, US CPI dropped to 2.5%. Markets now see a high chance—over 70%—that the Fed will cut rates by their March meeting. Lower interest rates make holding non-yielding assets like gold more appealing. This trend is evident in the bond market, where the 10-year US Treasury yield fell below 3.5% late last year, making gold more attractive. Upcoming US Retail Sales data will be important; a weak report could reinforce the case for an earlier rate cut, pushing gold prices higher. Traders should closely monitor this release for potential market volatility.Central Banks and Gold Demand
Central banks continue to drive demand for gold, a trend that gained momentum after record purchases in 2022. In 2025, global central banks added over 800 tonnes to their reserves, with the People’s Bank of China and the Reserve Bank of India leading the charge. This sustained demand creates a solid price floor for gold. For derivative traders, this suggests a favorable position for upcoming weeks. Buying call options on gold futures (GC) or gold-backed ETFs can be a smart way to profit from the anticipated price increase. Bullish call spreads are another option to define risk while aiming for gains. As economic data is released, implied volatility may rise, presenting additional opportunities. Traders expecting a sharp price move after the retail sales report—regardless of direction—might consider long straddles or strangles. This approach allows for profits from significant price swings as the market reacts to new information. Lastly, it’s essential to see gold as a hedge against riskier assets. With ongoing worries about a potential economic slowdown leading the Fed to consider rate cuts, the equity markets may face challenges. Using gold futures or options as a hedge against long equity portfolios could be a wise strategy in the coming weeks. Create your live VT Markets account and start trading now.Gold prices in Malaysia have increased today, according to market analysis data.
Gold prices in Malaysia increased on Wednesday, based on FXStreet data. The price for Gold per gram rose to 603.14 Malaysian Ringgits (MYR) from 597.90 MYR the day before.
The price for Gold per tola went up to 7,034.92 MYR, compared to 6,973.74 MYR previously. FXStreet calculates these prices by converting international rates (USD/MYR) into Malaysian currency and units.
Gold As A Stable Investment
Gold is often seen as a reliable investment because of its long history as a store of value. People consider it a safe asset against inflation and currency decline. Central banks hold the most Gold to diversify their reserves and support their economies. In 2022, central banks bought 1,136 tonnes of Gold, worth around $70 billion. Countries like China, India, and Turkey have been increasing their Gold reserves. Gold usually has an opposite relationship with the US Dollar and US Treasuries. When the Dollar weakens, Gold prices tend to rise. Other factors like geopolitical tensions and interest rates can also affect Gold prices. Since gold is priced in dollars, its value often changes with the Dollar’s strength. The increase in Gold prices to MYR 603.14 per gram reflects global market sentiments. This rising trend is expected to strengthen as we approach the first quarter of 2026, indicating underlying market concerns. Persistent inflation has been a major issue, ending 2025 at 3.2% in the United States despite the Federal Reserve cutting rates last year. In this context, Gold becomes more appealing due to its role as a hedge. The market is now expecting a slower rate of cuts, adding uncertainty that benefits safe-haven assets.Central Bank Demand and Market Dynamics
Demand from central banks continues to support Gold prices. The World Gold Council reported that net purchases in 2025 were close to previous record levels. This ongoing buying trend from institutions shows a long-term shift away from the US Dollar, highlighting a belief in Gold’s value during uncertain times. The US Dollar Index (DXY) has weakened, recently dropping below the important 102 support level. A weaker Dollar makes Gold cheaper for those using other currencies, which typically increases demand. This opposing relationship is essential to consider for our short-term predictions. Given these conditions, derivative traders may want to buy call options on Gold to benefit from potential price gains while limiting downside risk to the premium paid. There has been increased interest in contracts set to expire in the next two to three months. For those willing to take on more risk, setting up long positions in Gold futures during minor price dips could be a smart move. Market dips in the later part of 2025 showed these pullbacks were brief due to strong support. This pattern indicates that buying during price drops may lead to profits. Create your live VT Markets account and start trading now.Strength is seen in the Gold Miners ETF (GDX) as it moves through a five-wave Elliott Wave pattern.
The Gold Miners ETF (GDX) is showing strong growth in a clear Elliott Wave pattern that started from the low point on October 28, 2025. This movement consists of five waves. Wave 1 peaked at $91.67, while Wave 2 corrected down to $83.22.
Wave 2 has a double three corrective pattern. Wave ((w)) finished at $84.89, followed by a rise in wave ((x)) that concluded at $88.48, and wave ((y)) ended at $83.22, marking the close of Wave 2. Wave 3 began next, with wave ((i)) rising to $92.35 and wave ((ii)) correcting to $88.09.
Impulsive Wave Structure
The Index continued into wave ((iii)); wave (i) reached $91.23, and wave (ii) pulled back to $88.79. Wave (iii) is nearly finished, with a corrective wave (iv) expected to follow and then another rally in wave (v). In the short term, support at $83.22 is likely to attract buyers, while retracements will follow patterns of three, seven, or eleven swings. As the impulsive sequence moves forward, we expect further gains. Given the strong impulsive structure since the low on October 28, 2025, our outlook remains bullish. If you take long positions, use the wave 2 bottom at $83.22 as a crucial stop-loss level. If this price is breached, it would invalidate the current bullish outlook and require a reevaluation of the entire structure. This analysis indicates we are in a robust third wave, usually the most powerful and prolonged part of an impulse. We should be on the lookout for near-term dips, like the expected wave (iv) pullback, as chances to start or increase long positions. These pullbacks are ideal times to buy call options or sell put credit spreads with upcoming expirations.Macroeconomic Factors and Market Conditions
This technical strength is backed by the broader economic landscape. The latest Consumer Price Index data from December 2025 showed core inflation at a surprising 3.4%, defying expectations of a smoother drop. This ongoing inflation increases gold’s attractiveness as a traditional hedge, benefiting miners directly. Additionally, we’ve seen the US Dollar Index (DXY) decline from its peak last November, dropping from 106.50 to about 103.20 now. This dollar weakness is a positive factor for gold prices, which are priced in dollars. Data from the World Gold Council also revealed that central banks continued significant gold purchases in the last quarter of 2025, reducing supply and providing price support. The current conditions in GDX resemble market movements from early 2023 when concerns over a central bank policy mistake triggered a sharp rise in precious metals. Now that the market anticipates a higher chance of a Fed rate cut by mid-2026 to support a slowing economy, the stage is set for further price increases. Therefore, using options to build bullish positions allows for leveraged exposure while keeping risk defined. As wave (iii) of ((iii)) seems to be almost complete, traders should wait patiently before making new moves. The best strategy is to look for the expected dip in wave (iv). This will prepare us to take advantage of the following rally in wave (v), which will complete the larger wave ((iii)) structure. Create your live VT Markets account and start trading now.XAG/USD prices rise toward $90.00 amid geopolitical tensions and strong safe-haven demand
**Silver Market Dynamics**
Silver prices keep climbing for the fourth straight day, nearing $90.00 during the Asian session. This rise is driven by increasing demand for safe-haven assets amid geopolitical issues, like unrest in Iran and worries about the Federal Reserve’s independence.
Civil unrest in Iran has led to many casualties, with inflation rising and the Rial declining against the US Dollar. Additionally, volatility in the US Dollar has followed legal troubles for Fed Chairman Jerome Powell, although global central bank leaders continue to back him.
Silver is gaining traction, with the 14-day Relative Strength Index (RSI) at 74.77, suggesting it may be overbought. Even though the trend is upward, an overextension could lead to a period of stabilization.
Silver has historically been valued as a safe store of value and a medium of exchange. Investors often turn to silver during times of geopolitical instability and low interest rates. Prices in the silver market are influenced by the strength of the US Dollar, industrial demand, and trends in gold. Silver is commonly used in electronics and solar energy, with demand from the US, China, and India affecting prices. Silver typically follows gold’s price movements, and the Gold/Silver ratio shows relative valuation.
**Trading Opportunities and Risks**
With silver touching nearly $90.00, this is a time of great opportunity and risk. Geopolitical tensions in Iran and uncertainties around the US Federal Reserve are driving strong demand for safe-haven assets, creating a favorable environment for traders who thrive on volatility.
Market volatility is notable, with the VIX staying above 20, a sharp rise from calmer levels in the third quarter of 2025. For traders expecting larger price swings as the situation unfolds, options strategies that capitalize on volatility, like long straddles, could be beneficial. This strategy allows traders to profit from significant moves in silver, no matter the direction.
Given the bullish momentum indicated by the overbought RSI of 74.77, buying call options is a straightforward way to speculate on further increases. The psychological target of $100.00 per ounce is in sight, and calls with strike prices at $95 or $100 might provide leveraged returns if the rally continues. However, it’s important to note that high implied volatility has made these options pricier.
On the flip side, the overbought conditions suggest that the current rally is stretched and could face a sharp correction. Cautious traders might hedge long positions by buying puts or consider selling call spreads, betting that prices will stabilize or decrease from these highs. A sudden ease in geopolitical tensions could lead to a rapid sell-off.
We’re also monitoring the Gold/Silver ratio, which has fallen to around 45, its lowest level in years compared to an average of over 65 in the 21st century. This indicates that silver may be overvalued relative to gold, prompting some traders to consider paired trading options to take advantage of this potential reversal. Historically, such a low ratio has often been followed by silver underperforming against gold.
Supporting this entire movement is the strong fundamental background from industrial use, which remains significant. Reports from late 2025 indicated that industrial demand, particularly from the solar and electronics sectors, increased by 5% year-over-year. This provides a solid foundation that could cushion potential price corrections.
Create your live VT Markets account and start trading now.
Dividend Adjustment Notice – Jan 14 ,2026
Dear Client,
Please note that the dividends of the following products will be adjusted accordingly. Index dividends will be executed separately through a balance statement directly to your trading account, and the comment will be in the following format “Div & Product Name & Net Volume”.
Please refer to the table below for more details:
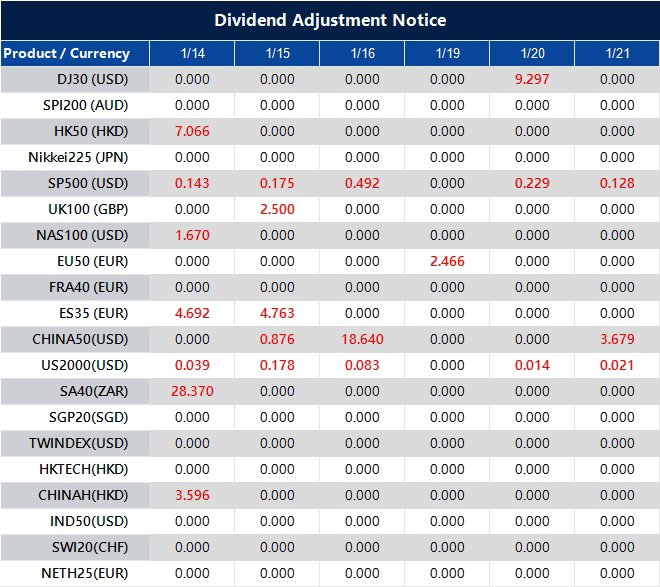
The above data is for reference only, please refer to the MT4/MT5 software for specific data.
If you’d like more information, please don’t hesitate to contact [email protected].
Venezuelan exports resume as WTI price drops to around $60.70 due to rising US stockpiles
West Texas Intermediate (WTI), the benchmark for US crude oil, is trading around $60.70 as of Wednesday’s Asian session. The price drop follows Venezuela’s return to oil exports and a reported rise in US crude inventories from the American Petroleum Institute (API).
Venezuela’s Oil Production Resumes
According to Reuters, Venezuela is boosting oil production after previously cutting it due to a US embargo. Recently, two supertankers, each carrying about 1.8 million barrels of crude oil, set sail. This may be part of a 50-million-barrel supply deal between Caracas and Washington to restart exports. On the US side, crude stockpiles have increased significantly. The API’s weekly report indicate an uptick of 5.27 million barrels for the week ending January 9, contrasting with a drop of 2.8 million barrels the week prior. Market expectations had anticipated a decrease of 2.0 million barrels. Adding to WTI price pressures, tensions are rising in Iran. President Trump has pulled out of meetings with Iranian officials and is supporting protesters, as reported clashes have resulted in casualties. With WTI crude oil priced at around $60.70, we see significant downward pressure. The unexpected increase of 5.27 million barrels in US stockpiles is a major bearish signal, especially since the market expected a decline. Traders are now looking forward to the official EIA report later today, which is likely to confirm the trend of rising inventories.Implications for Traders
The current supply surplus is compounded by new barrels entering the market from two sources. In the US, crude production is at record highs, with the latest EIA forecasts suggesting output may average over 13.5 million barrels per day this quarter. Additionally, the restart of Venezuelan exports adds an unexpected variable that the market hadn’t accounted for until this week. On the demand front, concerns about the global economy’s strength could impact oil consumption. December 2025’s manufacturing PMI data from China showed a slight contraction, indicating weaker demand from the world’s largest oil importer. This poor demand outlook, combined with climbing supply, points to lower prices in the near future. For traders in derivatives, this environment appears to favor bearish positions. There has been a noticeable rise in open interest for put options with strike prices at $58 and $55 for the February and March contracts. Strategies such as buying puts or creating bear put spreads could help capitalize on potential price drops toward the mid-$50s. Nevertheless, we must keep an eye on the ongoing geopolitical tensions in Iran. Any escalation or direct US intervention could lead to a sudden supply shock, causing prices to surge and hurting short positions. Holding some inexpensive, out-of-the-money call options could be a cost-effective way to hedge against this unpredictable risk. Create your live VT Markets account and start trading now.In December, China’s trade surplus increased to CNY 808.80 billion.
China’s trade balance in December rose to CNY 808.80 billion, up from CNY 792.57 billion. Exports increased by 5.2% year-on-year in December, while imports grew by 4.4% during the same time frame.
In US Dollars, China’s trade surplus for December was $114.10 billion. This exceeded expectations of $113.60 billion and the previous figure of $111.68 billion. Exports were up by 6.6%, and imports increased by 5.7%, surpassing prior predictions.
The Impact On Australian Dollar
The Australian Dollar (AUD) rose by 0.16% in response to the Chinese trade data, with notable gains against the Swiss Franc. China’s customs department will provide its official trade data at 03:00 GMT, with a previous forecast of a trade balance of $113.60 billion. Before the data release, AUD/USD shows a positive trend. Potential resistance levels are at 0.6722, 0.6742, and 0.6766, while support is found at 0.6663, 0.6614, and 0.6587 if the price declines. The value of the Australian Dollar is affected by several factors, including the Reserve Bank of Australia’s interest rate policies, iron ore prices, and China’s economic health. The RBA sets interest rates that influence inflation and credit conditions, directly affecting the AUD’s value. As China is Australia’s largest trading partner, its economic performance and iron ore prices also shape demand for the AUD. A positive trade balance boosts the AUD as well. In January 2025, strong Chinese trade figures gave the Australian dollar a notable lift, with both exports and imports surpassing expectations. This demonstrated the clear connection between China’s economy and the AUD, a relationship that still guides our strategy on January 14, 2026.Challenges In The Current Economic Landscape
Today’s environment is more complicated, requiring caution. Recent data reveals that China’s official manufacturing PMI for December 2025 stood at only 50.1, suggesting a weak recovery compared to last year. This indicates less potential for positive surprises in trade data, which were previously a strong catalyst for growth. Moreover, iron ore prices—a vital export for Australia—have fallen in early 2026 to around $125 per tonne, due to concerns over demand for Chinese steel. This is a shift from the stronger prices seen in late 2025, acting as a challenge for the AUD. The Reserve Bank of Australia has also paused its interest rate hikes, leaving the currency without clear domestic support. In this uncertain backdrop, strategies that capitalize on potential volatility may be more effective than those focused on a specific direction. Strategies such as buying straddles or strangles on AUD/USD ahead of upcoming Chinese GDP or trade data could be beneficial. This approach enables profit from significant price moves in either direction, which is likely if the data diverges from muted expectations. For those already holding long positions in AUD, purchasing out-of-the-money put options provides a cost-effective hedge. This strategy protects against a scenario where disappointing Chinese data may cause the AUD to drop. Such a defensive stance reflects the mixed signals from China’s economy, a stark contrast to the clearer picture from last year. Create your live VT Markets account and start trading now.The USD/CAD pair remains strong around 1.3900 after the Fed’s cautious outlook.
The USD/CAD pair remains strong around 1.3900, thanks to a stronger US Dollar and steady Federal Reserve policies. The US Consumer Price Index (CPI) rose by 0.3% in December 2025, matching expectations, with a yearly increase of 2.7%. Core CPI, which excludes food and energy, grew by 0.2%, falling short of predictions and keeping annual core inflation at a four-year low of 2.6%.
Despite past shutdown distortions, indicators show inflation is easing. Strong Nonfarm Payrolls, a lower Unemployment Rate, and stable ADP Employment Changes highlight a strong US job market. Meanwhile, the Canadian Dollar may benefit from rising Oil prices, with West Texas Intermediate set at about $60.70 per barrel amid geopolitical tensions related to Iran.
The Impact of Oil Prices
The value of the Canadian Dollar (CAD) is influenced by the Bank of Canada’s interest rates, Oil prices, economic health, inflation, and Trade Balance. Higher Oil prices typically support the CAD due to increased demand, while lower prices may diminish its value. Additionally, inflation and economic data impact the CAD by affecting foreign investments and interest rates, with stronger data generally favoring the currency. The USD/CAD pair is holding steady near the 1.3900 level, driven by trends noticed in late 2025. At that time, the market expected the US Federal Reserve to maintain interest rates. This view was supported by a strong US labor market and easing inflation that was not drastically falling. In December 2025, the annual US inflation rate was 2.7% with a core rate of 2.6%. Both figures were lower than those seen in much of 2023, where rates often exceeded 3%. This disinflation, along with strong job reports from late 2025, created a balanced situation for the US dollar. The economy was robust enough to avoid rate cuts, yet inflation was tame enough to prevent rate hikes.Geopolitical Tensions and Currency Dynamics
The Canadian dollar also benefits from rising oil prices, particularly due to geopolitical tensions in Iran in 2025, which pushed West Texas Intermediate crude prices to around $60.70 per barrel. Past supply concerns, such as shipping attacks in the Red Sea during late 2023, also stabilized oil prices and strengthened the loonie. This scenario creates a rivalry for the currency pair, as a strong US economic outlook contrasts with rising commodity prices that favor Canada. The Federal Reserve’s steady approach supports the US dollar, while energy market risks bolster the Canadian dollar. This fundamental tension indicates potential volatility for the pair. Traders should consider strategies that can thrive on sharp price movements in either direction, as the pair might break out depending on which factor becomes dominant. Options strategies such as straddles or strangles might be useful before key central bank meetings or significant energy news. These strategies can capitalize on increased volatility without needing to predict a specific direction. In the upcoming weeks, we will closely monitor communications from the Bank of Canada for any changes that differ from the Federal Reserve’s stance. The BoC maintained its policy rate at 5% into early 2024, suggesting it is not ready to declare victory over inflation. Any indication that Canadian policymakers are becoming more dovish than their American counterparts could push USD/CAD higher. Create your live VT Markets account and start trading now.China’s trade balance exceeds forecasts, reaching USD 114.1 billion in December
China’s trade balance for December reached $114.1 billion, surpassing the expected $113.6 billion. This comes during a time when various market movements and economic indicators are being closely observed worldwide.
Gold prices increased to just over $4,620 per troy ounce, approaching the record high of $4,634.64. This rise is driven by higher demand for safe-haven assets due to anticipated rate cuts by the Federal Reserve. At the same time, meme coins like Dogecoin, Shiba Inu, and Pepe saw increases between 7% and 14%, indicating a possible upward trend.


