GBP/JPY fell on Thursday, ending a four-day rise and moving below 213.00. The pair failed to extend gains beyond the March peak near 213.30, then lost momentum after reaching 213.30.
Risk-off trading supported the Japanese Yen and added pressure to the Pound. Reports on the US-Iran war were mixed, with Abbas Araghchi denying direct talks with the US while Donald Trump said Iranian leaders were seeking to negotiate.
Technical Picture And Immediate Levels
Iran and Israel continued exchanging attacks on Thursday. The Strait of Hormuz has been closed for the fourth consecutive week, pushing Brent Crude Oil to $99 per barrel.
On the 4-hour chart, GBP/JPY traded at 212.83 and stayed above a rising trendline from 210.59. The Relative Strength Index dropped to 53 from around 60, and the MACD turned marginally negative with the MACD line below the signal line.
Price tested trendline support at 212.70, with further levels at 212.26 and 211.60. Resistance stood at 213.30, with upside levels at 213.75 and 214.05.
We recall how this time last year, in March 2025, the GBP/JPY pair struggled to break past the 213.30 resistance level. This hesitation was fueled by significant global uncertainty, including a conflict between the US and Iran which led to the closure of the Strait of Hormuz. The resulting risk-averse sentiment provided strong support for the safe-haven Japanese Yen.
The environment today is markedly different, with the pair trading much lower. Geopolitical tensions have eased, and Brent crude oil is now trading near $85 per barrel, a stark contrast to the $99 highs we saw during the 2025 supply disruption. Current UK inflation data shows a rate of 2.1%, giving the Bank of England less urgency to hike rates aggressively compared to the concerns of last year.
Strategy Considerations In A Lower Volatility Regime
Given this backdrop of lower volatility, derivative traders might find value in options strategies that benefit from a potential price swing. Last year’s volatile market made options contracts expensive, but current conditions make strategies like long straddles more affordable. This approach allows traders to position for a significant move without betting on a specific direction, hedging against unexpected policy shifts from either the Bank of England or the Bank of Japan.
The carry trade, which was unattractive in the risk-off climate of March 2025, has also regained its appeal. With the Bank of England’s official rate holding at 5.25% and the Bank of Japan having only just ended its negative interest rate policy, the yield differential remains significant. Traders using futures contracts can capture this differential, provided that market stability continues.
While the 213.30 level was the key resistance to watch last year, traders should now focus on the 206.00 area as a potential ceiling. A failure to break this level could see a repeat of the bearish correction we saw in 2025. Similarly, a decisive break below the current support around 204.50 would be a bearish signal, reminiscent of when the trendline at 212.70 gave way a year ago.
Create your live VT Markets account and start trading now.
Start trading now – Click here to create your real VT Markets account
US initial claims for unemployment insurance rose to 210K in the week ending 21 March, according to a US Department of Labour report released on Thursday. The figure matched estimates and was up from 205K the prior week, which was unrevised.
The four-week moving average slipped by 0.25K to 210.5K from 210.75K, with the earlier reading unrevised. Continuing jobless claims fell by 32K to 1.819M for the week ending 14 March.
Dollar Strength Amid Geopolitical Tensions
On Thursday, the US Dollar Index (DXY) climbed to three-day highs near 100.00 as the US dollar extended a weekly recovery. The move took place as geopolitical tensions continued.
The report was corrected on 26 March at 13:04 GMT to state that continuing claims data covered the week ending 14 March, not 7 March.
Looking back at this time in 2025, we saw a labor market that was stable, with initial jobless claims holding steady around 210K. The data did little to change the narrative, but it supported a strengthening dollar amid geopolitical stress. This period set a baseline for what a resilient, but not overheating, US economy looked like.
Today, the situation has evolved, as initial claims for last week came in slightly higher at 218K, with the four-week average now sitting near 215K. This slow upward creep over the past year suggests the labor market is beginning to soften at the edges. Continuing claims have also risen to 1.905 million, reflecting a longer search for new employment for those laid off.
Trading Implications And Market Positioning
The US Dollar Index, which was testing the 100 mark a year ago, has shown persistent strength and currently trades around 104. This sustained strength, driven by ongoing global uncertainty, continues to tighten financial conditions globally. This is a critical factor that was just a budding trend back in early 2025.
Given this context, traders should consider positioning for increased volatility in the equity markets. Buying VIX call options or establishing put spread collars on major indices like the S&P 500 could offer a cost-effective hedge. This protects against a potential market downturn if the labor data continues to deteriorate more quickly than anticipated.
In the interest rate markets, the focus should be on the timing of Federal Reserve policy changes. The current data points to a less robust economy than a year ago, making future rate cuts more probable. Traders could look at SOFR futures, specifically for the end of the year, to position for a more dovish pivot from the central bank.
Create your live VT Markets account and start trading now.
Start trading now – Click here to create your real VT Markets account
US continuing jobless claims for the week ending 13 March came in at 1.819 million. This was below the forecast of 1.86 million.
The result indicates fewer people remained on unemployment benefits than expected. The gap between the forecast and the actual figure was 0.041 million (41,000).
Labor Market Strength
The latest continuing jobless claims data, coming in at 1.819 million, shows the labor market is running hotter than we expected. This resilience suggests that the underlying economy remains strong, challenging the narrative of an imminent slowdown. This surprise strength means we must re-evaluate assumptions about the Federal Reserve’s path forward.
A tight labor market fuels concerns about wage inflation, which could force the Federal Reserve to delay any planned interest rate cuts. We’re seeing the probability of a June rate cut, as tracked by CME futures, fall from over 70% to just around 55% following this data release. This shift in expectations is the most critical factor for derivative pricing in the coming weeks.
We need to be cautious as this situation feels similar to the market sentiment back in the spring of 2025. Then, a series of robust economic reports also pushed back the timeline for rate cuts, leading to a spike in bond yields and a notable sell-off in growth-oriented equities. History suggests we should prepare for increased choppiness as the market digests this new reality.
This uncertainty means we should anticipate higher volatility, especially around the next inflation data release and Fed meeting. The VIX, which had been trending below 14, is likely to find support and could test the 17-18 range as traders buy protection. Consider buying straddles or strangles on major indices to play this expected rise in price swings.
For specific positions, the outlook for rate-sensitive sectors like technology and real estate becomes more challenging. We might look at buying puts or establishing bear call spreads on tech-heavy ETFs. Conversely, a strong consumer base is good for consumer discretionary stocks, making bull put spreads on retail and travel names more attractive.
Focus On CPI
The upcoming Consumer Price Index (CPI) report is now even more important for setting market direction. Another high inflation reading would confirm the Fed’s need to stay hawkish, likely pressuring markets further. We should position for this binary event, as it will either validate the market’s new fears or provide significant relief.
Create your live VT Markets account and start trading now.
Start trading now – Click here to create your real VT Markets account
The United States four-week moving average for initial jobless claims was 210.5K as of 20 March. The previous four-week average was 210.75K.
This is a decrease of 0.25K compared with the prior figure. The latest data point reflects a small change in the recent trend.
Labor Market Resilience
The steady jobless claims data reinforces our view of a resilient labor market. This consistent strength suggests the Federal Reserve will feel no pressure to cut interest rates in the immediate future. We should therefore adjust expectations for a dovish pivot, pushing the timeline for any potential rate cuts further out.
With the Fed likely on hold, we anticipate continued pressure on short-term interest rate derivatives that have priced in aggressive cuts for the summer. Recent inflation data, which showed core PCE for February 2026 holding at 2.8%, supports this patient stance from policymakers. This environment suggests fading the rallies in futures contracts tied to the SOFR rate.
This stability is keeping market volatility low, with the VIX index currently trading near 13.5. This makes selling options premium an attractive strategy, as the strong economy provides a buffer for equity markets. We see opportunities in writing covered calls on well-performing tech stocks or selling cash-secured puts on broad market ETFs like SPY.
Looking back, this stable environment is a stark contrast to the market jitters we saw in the fall of 2025 when recession fears were more widespread. However, the current low volatility should not lead to complacency. It remains prudent to hold some cheap, long-dated protective puts on major indices as a hedge against any unforeseen geopolitical or economic shocks.
Positioning Across Rates And Equities
The strong employment figures signal continued consumer spending power, which benefits cyclical sectors. We should consider bullish options strategies on consumer discretionary ETFs like XLY. This can be paired with bearish positions on interest-rate-sensitive sectors like utilities, which tend to underperform when the prospect of rate cuts diminishes.
Create your live VT Markets account and start trading now.
Start trading now – Click here to create your real VT Markets account
US initial jobless claims totalled 210,000 for the week ending 20 March, matching forecasts.
The data showed no deviation from expectations for the period covered.
Stable Labor Market Backdrop
Looking back, the initial jobless claims of 210,000 from March 20, 2025, reflected a stable and predictable labor market. That stability kept market volatility in check, rewarding simple directional bets. The environment we face today is substantially different.
We are now seeing signs of a cooling job market, with weekly claims recently trending higher towards 230,000. This contrasts with the strength we saw last year and introduces uncertainty about the economy’s direction. The Federal Reserve’s next move is now less obvious than it was a year ago.
This uncertainty is compounded by inflation data, which has remained stubbornly above the central bank’s target, with the last Consumer Price Index reading at 3.1%. This puts the Fed in a difficult position of balancing a softening labor market against persistent inflation. This conflict is a direct source of market volatility.
As a result, implied volatility in the options market has increased, with the VIX now hovering around 18, well above the calmer levels of early 2025. This means option premiums are more expensive, pricing in the potential for larger market swings. Strategies that simply bet on direction are now riskier.
Positioning For Higher Volatility
Therefore, traders should consider strategies that benefit from this heightened volatility. Buying straddles or strangles on indices ahead of the next FOMC meeting or key inflation data could be effective, as they profit from a significant move in either direction. This approach allows us to capitalize on the uncertainty itself, rather than guessing the outcome.
In the coming weeks, we will be closely watching for any deviation in employment and inflation figures. Using options to hedge existing equity portfolios with protective puts is also a prudent move. The predictable environment we remember from this time last year is no longer the reality.
Create your live VT Markets account and start trading now.
Start trading now – Click here to create your real VT Markets account
USD/CHF rose to around 0.7930 on Thursday, up 0.15% on the day. The move followed steady demand for the US Dollar amid geopolitical uncertainty and reduced hopes of a ceasefire between the US and Iran.
The US Dollar Index (DXY) held near recent highs around 99.90. Tensions increased after Iran rejected US President Donald Trump’s 15-point ceasefire proposal, calling it “extremely maximalist and unreasonable”.
Ceasefire Talks Stall
The Wall Street Journal reported that Iran is seeking guarantees against renewed hostilities, an end to Israeli strikes on Hezbollah, and more control over the Strait of Hormuz, including the right to collect transit fees. US officials said these terms are unrealistic, lowering the chance of a near-term deal.
Market caution supported demand for safe-haven assets such as the US Dollar, while US equity futures stayed under pressure. Trump said Iranian negotiators are “begging” for a deal and told them to “get serious”.
A Reuters poll showed most economists expect the Federal Reserve to keep rates in the 3.50%–3.75% range at least until September. Rate cuts are still expected later this year amid persistent inflation.
The Swiss Franc was broadly steady. The Swiss National Bank repeated it is ready to intervene to curb excessive Franc strength, with Chair Martin Schlegel saying willingness to act has increased.
Shifting Drivers Since Early 2025
Looking back at early 2025, we saw the market fixated on US-Iran tensions, which pushed USD/CHF toward 0.7930 on safe-haven demand for the dollar. That upside bias proved correct, as the pair now trades significantly higher around 0.8950. The primary drivers have since shifted from geopolitics to clear monetary policy divergence.
The Federal Reserve outlook we saw in 2025, which anticipated rate cuts later that year from a 3.75% peak, was too dovish. Instead, persistent inflation forced the Fed to hold rates higher for longer, and they currently sit in the 4.75%-5.00% range even after a recent cautious cut. With the latest US CPI data from February 2026 showing inflation still sticky at 2.8%, we believe the Fed will be slow to cut further.
On the other side, the Swiss National Bank has moved decisively in the opposite direction, fulfilling the cautious stance we noted in 2025. The SNB became the first major central bank to cut rates, surprising markets and bringing its policy rate down to 1.25% just last week. This aggressive move to weaken the franc creates a strong interest rate differential that favors holding US dollars over Swiss francs.
Given this widening policy gap, traders should consider using options to position for further USD/CHF strength. Implied volatility has fallen since the geopolitical fears of early 2025 subsided, making long call options or bull call spreads more affordable now. These strategies offer a defined-risk way to profit if the interest rate differential continues to push the pair higher.
We should specifically look at 3-month and 6-month options contracts to capture the expected period of continued policy divergence. The main risk to this view would be a sudden bout of global risk aversion that renews the franc’s safe-haven appeal, or if US economic data weakens unexpectedly, forcing the Fed to signal faster rate cuts.
Create your live VT Markets account and start trading now.
Start trading now – Click here to create your real VT Markets account
S&P 500 fell 1.74%, with futures now attempting a rebound.
Trump delays action by 10 days, easing immediate risk sentiment.
Rising yields and energy prices continue to drive stagflation concerns.
U.S. equity futures edged higher on Friday, with the S&P 500 attempting to stabilise after a 1.74% drop in the previous session.
The rebound follows a heavy selloff across major indices, with the Dow falling 1.01% and the Nasdaq dropping 2.38%, led by weakness in technology stocks.
US stocks sank on Thursday amid uncertainty over the Middle East conflict, with oil hovering above $100. pic.twitter.com/2fzKNYsZv8
A senior officer onboard a tanker said his ship was given permission to pass through the Strait of Hormuz by Iran, and guided by the navy, following negotiations between Tehran and New Delhi https://t.co/nlSPyDVkdi
However, Iran has rejected the U.S.’s 15-point proposal and presented its own conditions, including control over the Strait, keeping tensions unresolved.
Relief rallies may be short-lived unless there is clear progress toward de-escalation.
Rising Yields and Energy Prices Drive Stagflation Fears
The broader market reaction reflects growing concern over stagflation.
A sharp rise in energy prices is feeding into inflation expectations, while higher Treasury yields tighten financial conditions.
Interest-rate strategists at Morgan Stanley say this month’s Treasury market slump has hallmarks of forced selling of two-year notes, whose yields soared as traders abandoned wagers on Federal Reserve interest-rate cuts and began to price in a hike https://t.co/rGSdCV7Tjw
This combination is particularly challenging for equities, as it raises discount rates while also threatening economic growth.
Technology stocks, which are sensitive to interest rate changes, led the decline in the previous session.
Continued pressure from yields may limit upside in equities, especially in rate-sensitive sectors.
Technical Outlook Shows Downtrend Pressure
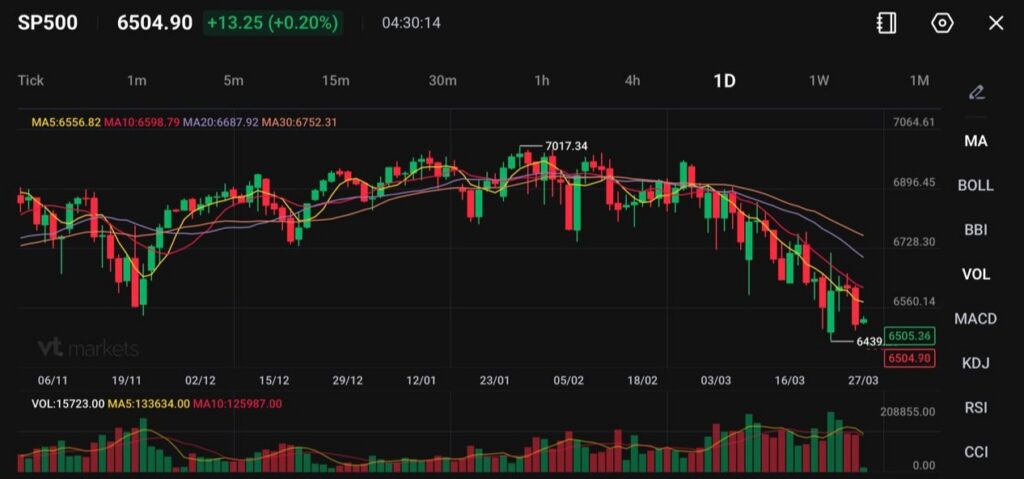
The S&P 500 (SP500) is trading around 6505, attempting a mild rebound after a sharp sell-off that drove price down to the ~6439 low. The broader structure has shifted from a prior range into a clear short-term downtrend, and this bounce looks corrective rather than impulsive so far.
Trend Structure and Momentum
Price has broken below all key moving averages, with:
MA5: 6556
MA10: 6598
MA20: 6687
MA30: 6752
All moving averages are now sloping downward and stacked bearishly, confirming sustained downside pressure. The recent candles show lower highs and lower lows, which is classic trend continuation behaviour.
The current bounce is testing the underside of the short-term averages, particularly the MA5 and MA10 zone (6550–6600), which now acts as dynamic resistance.
Volume increased during the sell-off phase and has eased slightly during the bounce. That tells you buyers are not fully committed yet.
Key Levels to Watch
Immediate Resistance: 6550 → 6600
Stronger Resistance: 6685 → 6750
Support: 6439 → 6400
Breakdown Level: Below 6400 opens 6300 region
The 6439 low is the key near-term floor. A clean break below that level would likely accelerate downside momentum.
On the upside, price needs to reclaim 6600 first, then 6685 (MA20 zone) to shift sentiment back toward neutral.
Price Behaviour Insight
The rejection from the 7017 high earlier has led to a full structure shift. What used to be a sideways market has now transitioned into a distribution phase, followed by a breakdown.
The recent bounce shows:
Smaller candles
Less aggressive buying
Resistance holding quickly
This is typical of a bearish pullback, not a reversal.
What to Watch Next
Watch how price reacts around 6550–6600:
Rejection here: Likely continuation lower toward 6439 and potentially 6400
Break and hold above 6600: Opens a squeeze toward 6685
Also keep an eye on:
US yields (higher yields pressure equities)
USDX strength (strong dollar often weighs on risk assets)
Cautious Outlook
The short-term bias remains bearish while below 6600, with rallies likely to be sold into. Momentum only shifts if price can reclaim and hold above the 20-day average (~6685). Until then, the structure favours lower highs and continued pressure on support zones.
What Traders Should Watch Next
Markets remain driven by a mix of geopolitical and macro forces. Key areas to monitor include:
Progress in U.S.–Iran negotiations
Movement in Treasury yields
Oil price stability and supply flows through Hormuz
Performance of technology stocks
For now, the S&P 500 is attempting to find footing, but the balance between easing geopolitical risk and tightening financial conditions remains finely poised.
ING’s Francesco Pesole tracks Bank of England messaging from MPC members Sarah Breeden, Alan Taylor and Megan Greene. He describes comments from Greene and Breeden as mixed but leaning towards a hawkish stance, while Taylor keeps a dovish view.
Greene reiterated concerns about inflation. Breeden said she would have voted for a rate cut at last week’s meeting if energy price spikes had not occurred, yet her broader tone stayed hawkish.
BoE Messaging Signals Mixed Bias
Taylor was presented as the only MPC member to remain dovish last week. He said temporary energy shocks have limited implications for medium-term inflation and that the threshold for rate rises is high.
Pesole says a de-escalation scenario could allow more scope for dovish repricing in UK rate expectations, affecting the Pound curve. He keeps a baseline view that EUR/GBP can move above 0.8700 in the coming weeks as UK rate expectations adjust lower.
The article notes it was produced with the help of an AI tool and reviewed by an editor. It also describes the FXStreet Insights Team as selecting market observations from experts and adding internal and external analyst input.
Back in 2025, we were watching for a dovish turn from Bank of England members like Greene and Breeden, who had been quite hawkish. That anticipated shift is now getting closer as UK inflation has fallen considerably to 2.5% as of last month’s data, a sharp drop from the levels seen last year. This environment creates an opportunity as the market may be under-pricing the probability of rate cuts beginning this summer.
Implications For Eur Gbp Positioning
The main reason for the market’s hesitation is that UK wage growth remains sticky, still holding around 4.5%, which is a key concern for the central bank. However, the Bank of England’s vote split at the March 2026 meeting widened to 7-2 in favour of holding rates, with two members now actively voting for a cut. Historically, once two members dissent in favour of a cut, a full policy pivot tends to follow within the next two meetings.
For derivative traders, this suggests positioning for a weaker pound against the euro as UK rate expectations adjust lower. Buying EUR/GBP call options with a strike price around 0.8700 and an expiry in June 2026 would be a direct way to play this view. This strategy provides a defined risk for a potentially sharp move higher in the currency pair if the BoE signals a rate cut is imminent.
We still see room for EUR/GBP to move past 0.8700 in the coming weeks. The European Central Bank is also on a path to cut rates, but with Eurozone growth being more sluggish, their actions are largely expected by the market. The bigger potential for a surprise rests with the Bank of England, meaning the pound has more room to weaken as this dovish repricing unfolds.
Create your live VT Markets account and start trading now.
Start trading now – Click here to create your real VT Markets account
The South African rand (ZAR) is facing increased pressure as it leads outflows among high-yield emerging-market currencies ahead of the South African Reserve Bank (SARB) decision. Over the past week, ZAR has been the worst-performing high-yield EM currency, despite remaining among the best-held.
Recent trading has seen faster selling in ZAR, with some outright currency positions being reversed. Market expectations for SARB policy have shifted from a near-autopilot path towards a lower inflation target to the pricing-in of aggressive tightening.
The report links this repricing to rising concerns about South Africa’s balance of payments and the rand’s stability. It indicates that the SARB is expected to take a strongly hawkish stance to reduce further deterioration, particularly if balance-of-payments stress escalates.
The SARB decision is framed as a further test for high-yielding currencies, especially in EMEA. The report adds that a hawkish response is needed in the current environment.
We recall the intense pressure on the South African rand back in 2025 when market expectations suddenly shifted to price in aggressive rate hikes. At the time, the SARB was forced into a very hawkish position to defend the currency against large capital outflows and balance-of-payments stress. That period provides a clear precedent for how the currency reacts when tested.
Now, in late March 2026, we are seeing similar dynamics as the rand weakens past 19.50 against the U.S. dollar. With the latest inflation figure for February ticking up to 5.8% and South Africa’s current account deficit widening to 2.1% of GDP in the last reported quarter, the rand is again looking vulnerable. This economic backdrop makes the currency extremely sensitive to any negative global risk sentiment, especially with the US Federal Reserve holding interest rates high.
For derivative traders, this points toward rising rand volatility in the weeks ahead. Buying call options on USD/ZAR offers a way to position for further rand weakness, as this strategy provides upside exposure with a defined downside risk. Implied volatility on one-month ZAR options has already climbed from 15% to over 18% in the past few weeks, signaling that the market is bracing for larger price swings.
The market is already pricing in a high probability of a 25 basis point hike from the SARB at its next meeting, much like the situation we saw in 2025. Traders should be cautious, as any sign of hesitation from the central bank could trigger a sharp sell-off, similar to the 4% plunge the rand experienced in a single week after the unexpectedly dovish SARB statement in late 2024. Therefore, watching short-term forward rate agreements will be critical for gauging shifts in monetary policy expectations.
Start trading now – Click here to create your real VT Markets account
NZD/USD fell for a third day, dropping below 0.5800 after reversing from last week’s highs near 0.5900. It reached 0.5781 during Thursday’s European session.
Market mood weakened after Iran rejected a US 15-point plan aimed at ending the Middle East war. Iran’s Foreign Minister, Abbas Araghchi, said there would be no negotiations with the US while bombing continues.
Middle East Escalation Drives Risk Off
Donald Trump called on Iran to “get serious” about talks in a Truth Social post and warned the US could respond by “hitting harder” if conditions are not met. Israeli aircraft bombed eastern Iran, while Iran launched new missile and drone attacks on Israel.
Iran also put forward its own peace proposal, seeking guarantees against future military action, compensation for war damage, and formal control of the Strait of Hormuz. The plan also includes a request for a ceasefire in Lebanon.
New Zealand’s calendar was largely empty, with the Roy Morgan Consumer Confidence Survey due later on Thursday. In the US, weekly Jobless Claims and remarks from Federal Reserve speakers were due.
With hopes for a US-Iran peace deal fading, we should anticipate continued risk-off sentiment in the coming weeks. This environment favors the safe-haven US Dollar over risk-sensitive currencies like the Kiwi. The breakdown below the 0.5800 level in NZD/USD signals that a deeper move lower is becoming more likely.
Positioning For Volatility And Dollar Strength
The CBOE Volatility Index (VIX) has already reflected this uncertainty, jumping over 15% this week to 25.4, a level we have not consistently seen since the market jitters of late 2025. This sustained fear has also pushed WTI crude futures toward $105 a barrel, as traders price in potential disruptions to the Strait of Hormuz. Derivative plays should therefore focus on hedging against, or profiting from, this rising volatility.
Buying put options on the NZD/USD is a direct way to position for further downside while defining risk. Looking back at the Q4 2025 global growth scare, the pair found a floor near 0.5750, which now serves as the next logical target. Strike prices below that level could offer value as the conflict shows no signs of de-escalating.
This geopolitical tension is not isolated to the currency market, and we should consider its impact on broader equity markets. Protective puts on indices like the S&P 500 are a prudent hedging strategy, as military escalation often triggers sharp, albeit sometimes brief, sell-offs. Historically, the initial reaction to conflicts, such as the one in Ukraine in 2022, involves a flight to safety that punishes stock indexes.
Conversely, positioning for continued US Dollar strength is a key theme. The U.S. Dollar Index (DXY) is already pushing towards the 107.00 handle, its highest level this year. Buying call options on the DXY provides exposure to this safe-haven flow against a basket of currencies, diversifying the trade away from being solely dependent on the Kiwi.
Create your live VT Markets account and start trading now.
Start trading now – Click here to create your real VT Markets account