Back

Rate Of Inflation: causes, effects, and how to manage it

Understanding the Basics of Rate of Inflation 

Rate of inflation refers to the percentage change in the general price level of goods and services in an economy over a specific period, usually a year. It is a key economic indicator that measures the rate at which prices are increasing, and it affects consumers, businesses, and the overall economy. A higher rate of inflation means that the same amount of money buys fewer goods and services, reducing purchasing power and potentially leading to economic instability.

Different Types of Inflation 

There are several types of inflation, and understanding each type is important to determine the appropriate course of action. 

One of the types of inflation is cost-push inflation, which occurs when the cost of production rises, leading to higher prices for consumers.  

Another type is demand-pull inflation, which occurs when the demand for goods and services exceeds the supply, resulting in higher prices.  

Deflation occurs when the rate of inflation goes negative, leading to a decrease in prices. 

Disinflation refers to the decrease in the rate of inflation over time.  

Reflation is the opposite of deflation, and it occurs when there is an increase in the rate of inflation after a period of deflation.  

Creeping inflation refers to a slow increase in the rate of inflation, while walking inflation refers to a moderate increase in inflation.  

Running inflation refers to a sudden and rapid increase in the rate of inflation.  

Finally, hyperinflation occurs when the rate of inflation becomes extremely high, leading to a loss of value of the country’s currency. 

The Effects of Rate of Inflation on the Economy 

The rate of inflation has a significant impact on the economy. When inflation is high, the cost of goods and services increases, which reduces purchasing power. This, in turn, leads to a reduction in demand for goods and services, leading to a decrease in production and eventually leading to unemployment. The increase in prices of goods and services also results in a decrease in the value of money. 

Inflation can also lead to higher interest rates, as central banks try to control the rate of inflation. This, in turn, leads to an increase in the cost of borrowing, making it more difficult for businesses to obtain loans to finance their operations. Additionally, inflation can also lead to an increase in the cost of living, leading to a decrease in the standard of living. 

Measuring Rate of Inflation 

The rate of inflation is typically measured by calculating the percentage change in the price level of a basket of goods and services over a period of time. There are different ways to measure the rate of inflation, but the most common methods are the Consumer Price Index (CPI) and the Producer Price Index (PPI).

The CPI measures the average price change of a basket of goods and services typically consumed by households. The goods and services included in the CPI are weighted according to their relative importance in the average household’s expenditure. The CPI is usually calculated on a monthly basis and is used to measure changes in the cost of living over time.

The PPI, on the other hand, measures the average price change of goods and services at the producer level before they reach the consumer. The PPI includes goods and services used in the production process, as well as intermediate goods and services. The PPI is often used as a leading indicator of future changes in the CPI.

To calculate the rate of inflation, you would compare the CPI or PPI from one period to another, usually a month or a year, and calculate the percentage change. For example, if the CPI was 100 in January and 105 in February, the rate of inflation would be (105-100)/100 = 5%.

Protecting Against the Rate of Inflation 

There are different ways of protecting against the rate of inflation. One way is to invest in assets that increase in value with inflation, such as real estate, stocks, and commodities. Another way is to invest in bonds, which can provide a steady stream of income and help offset the effects of inflation. 

Additionally, it is important to diversify investments across different asset classes to spread the risk. Another way to protect against inflation is to save in high-yield savings accounts or certificates of deposit (CDs) that offer interest rates that keep up with inflation. 
Purchasing Managers Index: Why is PMI important for the economy

What is the Purchasing Managers’ Index (PMI) 

The Purchasing Managers’ Index (PMI) is an economic indicator that measures the health of a country’s manufacturing sector. It is based on a survey of purchasing managers in the manufacturing industry and provides valuable insight into the state of the economy. The PMI is considered a leading indicator, as it can signal changes in economic activity before they become apparent in official economic data. 

How the Purchasing Managers’ Index Works 

The PMI is based on a survey of purchasing managers in the manufacturing industry. The survey asks purchasing managers to rate various aspects of their business, such as new orders, production levels, employment, and prices. The answers are then compiled into a single index number that represents the health of the manufacturing sector. 

The PMI is calculated on a scale of 0 to 100, with a score above 50 indicating expansion in the manufacturing sector, and a score below 50 indicating contraction. The PMI is broken down into sub-indices for new orders, production, employment, supplier deliveries, and inventories. 

How the PMI Affects Economic Decisions 

The PMI is closely watched by economists, investors, and policymakers, as it provides valuable information on the state of the economy. A high PMI reading suggests that the manufacturing sector is expanding, which can lead to increased employment, higher wages, and a stronger economy. A low PMI reading, on the other hand, suggests that the manufacturing sector is contracting, which can lead to job losses, lower wages, and a weaker economy. 

Policymakers use the PMI to guide economic policy decisions. For example, if the PMI indicates that the economy is weakening, policymakers may consider lowering interest rates or implementing fiscal stimulus to stimulate economic growth. 

Why is PMI important

The PMI is an important economic indicator because it provides real-time information on the health of the manufacturing sector. The manufacturing sector is a critical component of most economies, as it provides jobs and drives economic growth.

A strong PMI reading suggests that the manufacturing sector is expanding, which can have positive spillover effects on other sectors of the economy. A weak PMI reading, on the other hand, suggests that the manufacturing sector is contracting, which can lead to job losses and lower economic growth. 

The PMI is also important for investors, as it provides information on the performance of individual companies and sectors. For example, a high PMI reading for the technology sector may signal that technology stocks are likely to perform well in the coming months. 

When is PMI released

The PMI is released on a monthly basis by a number of different organizations, including Markit and the Institute for Supply Management (ISM).

The PMI is typically released on the first business day of the month and covers the previous month. For example, the PMI for January would be released on the first business day of February. Investors and economists closely watch the PMI release date, as it can have a significant impact on financial markets. 

Industrial Production Index (IPI): How to calculate the IPI 

What Is the Industrial Production Index (IPI)? 

The Industrial Production Index (IPI) is an economic indicator that measures the production output of the industrial sector of a country. It includes the manufacturing, mining, and electric and gas utilities sectors. The IPI provides insight into the health of the economy and is used by policymakers, investors, and analysts to make informed decisions. The IPI is an important tool for predicting future economic growth or contraction. 

How Does the Industrial Production Index (IPI) Work? 

The IPI is calculated by the Federal Reserve Board in the United States and other central banks around the world. It is based on a survey of businesses and covers approximately 100 products across various industries. The survey tracks the quantity of goods produced, as well as the changes in production levels over time. The IPI is reported monthly and is seasonally adjusted to account for variations in production levels throughout the year. 

How to Calculate the IPI 

The IPI is calculated using a base year that is set at 100. The current production levels are compared to the base year, and the percentage change is reported as the IPI for that month. For example, if the production levels in the current month are 10% higher than the base year, the IPI for that month would be 110. This allows for easy comparison of production levels over time, as well as between different industries. 

Benefits of the Industrial Production Index (IPI) 

The IPI provides valuable information for businesses, investors, and policymakers. Businesses can use the IPI to monitor production levels in their industry and adjust their operations accordingly. Investors can use the IPI to make informed decisions about which companies to invest in based on their production levels. Policymakers can use the IPI to make decisions about monetary policy and to anticipate changes in economic growth. 

The IPI can also be used in conjunction with other economic indicators, such as the Gross Domestic Product (GDP), to provide a more comprehensive picture of the economy. The IPI is particularly useful for predicting changes in GDP, as it provides an early indication of changes in production levels. 

When is Industrial Production released? 

The Federal Reserve Board releases the IPI monthly, typically around the middle of the month. The data is available on the Federal Reserve website and is widely reported in the media. Investors and analysts typically pay close attention to the IPI release, as it can have a significant impact on the stock market and other financial markets. 

S&P 500 Rises as Corporate Earnings Offer Mixed Signals

The S&P 500 rose by 0.33% on Monday as investors turned their attention to the latest batch of corporate earnings results. The Dow Jones Industrial Average also gained by 0.3%, while the Nasdaq Composite added 0.28%. As earnings season continues, investors are closely monitoring the results to gauge the health of corporate America.

State Street and Charles Schwab reported their earnings results before the bell, with Schwab’s shares rising by 3.9% despite a decline in deposits. However, State Street fell by 9.2% after missing estimates on the top and bottom lines. The financial sector is under particular scrutiny this earnings season following Silicon Valley Bank’s collapse last month, which led to a liquidity crisis and affected the broader sector.

The S&P’s communication services sector slumped by 1.3%, with declines from tech giants Alphabet, Netflix, and Meta Platforms leading the downside. Google’s parent company, Alphabet, fell by more than 2% as reports surfaced that Samsung is considering making Bing its default search engine.

Corporate earnings got off to a positive start last week as banking giants Wells Fargo and JPMorgan Chase beat expectations. Bank of America data shows that companies are hanging on despite inflation and higher rates, with 90% of the names that reported during week one topping EPS estimates. However, Stovall advises against drawing overall conclusions as reports from health care and communication services, which are expected to see double-digit year-over-year declines, are still pending.

The reporting period for financial companies continues this week with results from Bank of America, Goldman Sachs, and Morgan Stanley. Outside of financials, reports from electric vehicle heavyweight Tesla, IBM, and Netflix are also due out. Investors are waiting with bated breath to see how these reports will shape the market’s direction moving forward.

Data by Bloomberg

On Monday, the overall market saw a positive price change of 0.33%. The Real Estate sector had the highest increase in price with 2.23%, followed by Financials at 1.13%, and Industrials at 0.79%. Consumer Discretionary, Consumer Staples, and Materials all had moderate increases in price, with gains ranging from 0.59% to 0.68%. The Utilities sector had a slightly lower increase of 0.57%, while the Information Technology sector had the smallest increase at 0.39%. The Health Care sector experienced a slight decrease in the price of 0.10%, while both the Communication Services and Energy sectors saw a decrease in the price of 1.27%.

Overall, the market had a positive day with most sectors seeing an increase in price. Real Estate, Financials, and Industrials had the highest gains, while Communication Services and Energy saw the largest declines. The Health Care sector experienced a slight decrease in price, while the Information Technology sector had a small increase.

Major Pair Movement

Data by VT Markets MT4

On Monday, sterling fell 0.23%, breaching support at 1.2370. If this week’s key UK data are underwhelming and there is a close below that level, it could result in half of the March-February risk-off rise at 1.2175 being tested.

Following an unexpected increase in the New York Fed’s Empire State manufacturing gauge, the dollar index continued to rebound from its low on Friday, leading to an increase in Treasury yields against bunds, gilts, and JGBs. While the U.S. economic data has been mixed, the rise in core CPI to 5.6% in March and the low jobless rate have given strength to Fed hawks. It is anticipated that there will be another 25bp Fed hike in May or June, with current pricing of rates in Q3 being projected to remain high.

As a result of the slide in 2-year bund-Treasury yields spread by 7bp, EUR/USD fell 0.56%, with the next support being the rising 21-day moving average at 1.0880. USD/JPY rose 0.51% and is close to 61.8% of its March slide at 134.75, with possible hurdles at 136. The yen is becoming increasingly vulnerable to Treasury yield increases as 10-year JGB yields have risen back up to the BoJ’s 0.5% yield curve control cap, and Governor Ueda says that any policy shifts will take time.

Technical Analysis

EUR/USD (4 Hours)

The EUR/USD experienced its worst day in a month on Monday, losing over 50 pips and hitting a low of 1.0908 before rebounding to 1.0930. The Euro was the weakest among major currencies due to a stronger US Dollar, which was boosted by positive economic data from the US. The Empire Manufacturing Index rose unexpectedly from -24.6 in March to 10.8 in April, well above the market consensus of -18. The data strengthened expectations for a Federal Reserve (Fed) rate hike at the May 2-3 meeting, with the odds at 88%, according to the CME FedWatch Tool.

Despite higher Euro Zone bond yields, the Euro lost ground against its G10 rivals, including the US Dollar. European Central Bank (ECB) policymaker Martins Kazaks, who is considered a hawk, suggested the ECB could make a 25 or 50-basis point move in May. On Tuesday, the German ZEW Survey is expected, with the Current Situation Index predicted to have improved to -40 from -46.5 and the Economic Sentiment to 15.1 from 13. ECB’s Frank Elderson is also scheduled to deliver a speech.

Looking at the technical analysis, on Monday the EUR/USD experienced a significant decline, breaking below our support level at 1.0962 and causing the lower band of the Bollinger band to be pushed even lower. The next support level is now at 1.0921, and we expect the market to consolidate with the possibility of an upward move. The RSI is currently at a level of 40.

Resistance: 1.0974, 1.1026

Support: 1.0921, 1.0866

XAU/USD (4 Hours)

Gold prices started the week on a negative note, with XAU/USD hovering around $1,990 per troy ounce, after dropping to $1,981.16 at the beginning of the American session. The US Dollar gained strength, extending its Friday rally amid increasing risk-aversion. Although the Greenback’s advance pared during European trading hours, it bounced back due to persistent negative sentiment that kept US stock indexes in the red.

Market concerns focused on economic growth and the likelihood that the United States Federal Reserve (Fed) may decide to extend the tightening cycle beyond May. Last week’s US economic data came in weaker than expected, raising concerns about a possible recession before the end of the year. Additionally, a couple of Fed officials expressed hawkish views that suggest the central bank may not be finished tightening yet.

Rising US Treasury yields also provided further support to the US Dollar, with the 10-year Treasury note yields standing at 3.59%, up 7 basis points (bps) on the day, while the 2-year note offers 4.20%, up 10 bps.

Looking at the technical analysis, the XAU/USD is currently in a consolidation phase between our established support and resistance levels. The Bollinger band is expanding, suggesting that there may be potential for further movement. Our key support level remains at $1,990 while our resistance level is set at $2,005. The RSI is hovering around the 40 levels, indicating the potential for additional downward pressure.

Resistance: $2,005, $2,017

Support: $1,990, $1,984

Economic Data

CurrencyDataTime (GMT + 8)Forecast
GBPClaimant Count Change14:00-2.5K
CADConsumer Price Index20:300.60%
CADBOC Gov Macklem Speaks23:00

US Stock Futures Up Ahead of Earnings Reports, Yellen Sees Bank Lending Restrictions as Alternative to Fed Hikes

US stock market futures for the S&P 500, Nasdaq-100, and Dow Jones Industrial Average have all seen gains, with attention turning to a week of quarterly earnings reports, particularly in the financial sector, where there is increased focus on the health of the sector after the collapse of Silicon Valley Bank. Notable names reporting this week include Charles Schwab, Bank of America, Morgan Stanley, Tesla, and Procter & Gamble. Corporate earnings got off to a positive start, with Wells Fargo and JPMorgan Chase beating expectations, but retail sales data showing a slowdown in consumer spending pulled markets lower on Friday.

US Treasury Secretary, Janet Yellen, believes that banks may become more restrictive with lending, which could allow the Federal Reserve to stop hiking interest rates. Yellen also stated that this tightening of lending could act as a substitute for further interest rate hikes. This follows the collapse of Silicon Valley Bank and the potential fallout from the episode. Despite Friday’s losses, the major averages posted solid weekly gains, in yet another sign of resiliency for this market.

Data by Bloomberg

On Friday, the overall stock market fell by 0.21%. The financial sector saw an increase of 1.05%, while the communication services and energy sectors saw small gains of 0.31% and 0.19%, respectively. The utilities and real estate sectors saw the largest drops of 1.11% and 1.68%, while the healthcare and materials sectors saw declines of 0.79% and 0.67%, respectively. The consumer staples and information technology sectors also saw losses of 0.58% and 0.51%, respectively, while the consumer discretionary and industrial sectors saw slight gains of 0.13% and -0.12%, respectively.

Major Pair Movement

Data taken from MT4 VT Markets

On Friday, the dollar index increased by 0.6% due to above-forecast April Michigan consumer sentiment and 1-year inflation expectations, despite a 1% U.S. retail sales fall being dismissed by the Fed. This was accompanied by a rise in Treasury yields and increased rate-hike potential, indicating the market’s preparedness for a lower-than-expected retail sales result.

EUR/USD fell by 0.46% after reaching a new 1-year high at 1.10755 on EBS, as a result of the diminished Fed rate cut bets and the rise in 2-year Treasury yields, while USD/JPY surged by 0.88% breaching the mid-point of the March banking crisis slide at 133.77.

GBP/USD also experienced a decline in value by 0.84%. This was due to falling gilt-Treasury yield spreads and a delayed risk-off response to higher Treasury yields. As a result, prices fell from a minor new 10-month high to an uptrend line from late March, which caught last week’s lows.

Technical Analysis

EUR/USD (4 Hours)

The EUR/USD pair is facing difficulties in extending its recovery above the psychological resistance level of 1.1000, as investors remain cautious about the possibility of one more rate hike by the Federal Reserve (Fed). The monthly Retail Sales data released on Friday showed a contraction of 1.0%, higher than the expectations of a 0.4% decline. This, along with the hawkish commentary from Fed Governor Christopher Waller, has increased the odds of further policy tightening by the Fed, which led to a recovery in the US Dollar Index (DXY). Mixed views from ECB policymakers have also shifted investors to the sidelines, with Pierre Wunsch suggesting a rate hike of between 25 and 50 basis points in May, while Mario Centeno advocated a pause or a slowing in the interest rate hike spell.

Looking at the technical analysis, the EUR/USD price fell lower on Friday due to the positive impact of good retail sales data in the US. The price is currently pushing below the middle Bollinger band, targeting the lower band with a narrower band. Our support level now stands at 1.0962, and we anticipate the market to be in consolidation with the potential for a move higher. The RSI has moved back lower to the middle around the 50 levels, indicating that the market is taking a breather for the day.

Resistance: 1.1026, 1.1052

Support: 1.0962, 1.0921

XAU/USD (4 Hours)

The price of gold has reached a one-year high and is currently around $2,040. This is due in part to the weakening of the US dollar, as investors anticipate that the Federal Reserve will pause its rate-hiking cycle. Recent data, including the US Producer Price Index and Jobless Claims, suggest that inflation is easing and labor market conditions are loosening up, which further supports the view that the Fed will pause after hiking interest rates one last time in May. The IMF has also trimmed its global growth outlook for 2023, citing the impact of higher interest rates, which fuels recession fears and leads investors to favor safe-haven assets such as gold. However, traders are waiting for the release of US macro data, including monthly Retail Sales figures and the Preliminary Michigan Consumer Sentiment Index, before making any major moves.

Looking at the technical analysis, the XAU/USD price fell below the $2,000 level but has since rebounded. The price is now approaching the lower Bollinger band, and the bands are moving sideways. We have revised our key support level to $1,990 and our resistance level to $2,005. The RSI is hovering around the 42 levels, indicating the possibility of further downward pressure.

Resistance: $2,005, $2,017

Support: $1,990, $1,982

Economic Data

CurrencyDataTime (GMT + 8)Forecast
USDNY Empire State Manufacturing Index20:30-17.7

Week ahead: Markets to focus on Canada and UK CPI, US and UK PMI

This week, market participants are eagerly awaiting some highly anticipated economic reports. The focus will be on key indicators such as CPI in Canada, the UK, and New Zealand, as well as Flash Manufacturing and Services PMI in the UK and the US. These much-awaited reports are crucial in helping traders and investors stay ahead of the curve and make informed decisions.

Here are the key events to watch out for:

New York Empire State Manufacturing Index | US (April 17)

The NY Empire State Manufacturing Index sank to -24.6 in March 2023 from February’s -5.8.

 Analysts anticipate a reading of -15 in April.

Claimant Count Change | UK (April 18)       

The number of people claiming for unemployment benefits in the UK fell by 11,200 in February 2023.

For March, analysts expect this trend to persist, with a projected decrease of 9,500.  

Consumer Price Index | Canada (April 18)

CPI in Canada rose 0.4% in February 2023, easing from 0.5% in January.

For March, analysts expect the index to increase by 0.3%. 

Consumer Price Index | UK (April 19)

UK inflation rose unexpectedly in February, with CPI up 10.4% annually from 10.1% in January. This was the first increase in four months. 

For March, analysts expect a lower reading of 10.2%.

Consumer Price Index | New Zealand (April 20)

New Zealand’s CPI jumped 1.4% in the fourth quarter of 2022 from the previous quarter.

For the first quarter of 2023, analysts forecast the index to increase by 1.6%.

Flash Manufacturing PMI and Flash Services PMI | Germany (April 21)      

In March 2023, the German Flash Manufacturing PMI was revised slightly higher to 44.7, while the Flash Services PMI was revised slightly lower to 53.7. 

For April, analysts expect the Flash Manufacturing PMI to be released at 45.5, while Flash Services PMI at 53.5.

Flash Manufacturing PMI | UK (April 21)

UK Flash Manufacturing PMI came in at 47.9 in March 2023, down from February’s seven-month high of 49.3.

Analysts expect a reading of 48.5. in April. 

Flash Manufacturing PMI and Flash Services PMI | US (April 21)  

The US Flash Manufacturing PMI came in at 49.2 in March 2023, up from 47.3 in February. Meanwhile, Services PMI was revised lower to 52.6.

For April 2023, analysts expect the US Flash Manufacturing PMI to be released at 48, while Flash Services PMI at 51.8.

Stock Futures Slightly Lower as Investors Eye Earnings Season and Inflation Data

On Thursday, Stock futures are trading slightly lower as investors keep an eye on the start of corporate earnings season and the latest inflation data. The focus is on what the inflation numbers suggest about the economy and how they may impact interest rates. Dow Industrial Average futures have lost 42 points, while S&P 500 futures are slightly below the flatline, and Nasdaq-100 futures have shed 0.1%.

The March producer price index, which measures the prices paid by companies, declined by 0.5% from the previous month, even though economists had expected prices to remain the same. This decline has supported a trend of easing inflation seen in the March consumer price index report. Investors will also pay close attention to data on retail sales, import prices, and the industrial sector, which will provide more insights into the state of the economy.

Investors will keep a close eye on today’s big-bank earnings, with JPMorgan, Wells Fargo, and Citi set to report before the bell. In addition, they will monitor data on retail sales, import prices, and the industrial sector, which will provide additional insight into how the economy is doing.

Data by Bloomberg

On Thursday, all sectors experienced gains in the stock market, with the Communication Services and Consumer Discretionary sectors leading the way with a 2.33% and 2.31% increase respectively. The Real Estate sector was the only one that saw a decline with a decrease of 0.41%. The utility sector had the smallest increase of 0.02%.

This data shows that the overall stock market experienced positive growth on this particular day, with the majority of sectors seeing increases in stock prices. The strong performance of the Communication Services and Consumer Discretionary sectors could suggest positive news for companies in those areas, while the decrease in the Real Estate sector may indicate some struggles for companies in that industry.

Major Pair Movement

Data taken from MT4 VT Markets

The EUR/USD currency pair reached a 1-year high as investors believe the US Federal Reserve may only raise interest rates by 25 basis points once more before beginning a series of rate cuts later in the year. This follows a fall in US PPI in March, which was greater than anticipated. While the data points to a cooling economy, it does not suggest enough weakness for the Federal Reserve to abandon its focus on inflation just yet.

Markets forecasted that a series of aggressive rate hikes and tighter bank credit, combined with a shrinking pool of savings due to the pandemic, may lead to economic weakness later in 2023 and 2024. Despite reports suggesting a 25bp hike in May by ECB policymakers, markets still project a 41% chance of a 50bp increase and a total of 78bp of tightening by October. Sterling rose 0.3% after hitting new 10-month highs, and the Aussie surged 1.4% amid risk-on flows, strong jobs data, and positive China growth prospects.

Technical Analysis

EUR/USD (4 Hours)

The EUR/USD currency pair is rising due to support from both currencies after a period of consolidation below 1.1050 in the Asian session. The US Dollar is facing pressure as the market expects the Federal Reserve (Fed) to act on inflation sooner than anticipated after the softening of the US Producer Price Index (PPI). The S&P500 futures indicate cautious market sentiment despite bullish activity on Thursday. The Euro is gaining strength as investors debate the scale of a potential interest rate hike by the European Central Bank (ECB), with options of 25 and 50 basis points being considered for the May policy meeting. ECB Governing Council member Bostjan Vasle noted concerns over core inflation continuing to move in the wrong direction.

Looking at the technical analysis, the EUR/USD price has been increasing but there are indications of easing, as seen from the Bollinger band where the lower band is becoming narrower. Our support level has been adjusted to 1.1031, as the market is expected to consolidate for today, despite the release of US retail sales. The RSI has entered the overbought level, which suggests there may be limited higher movement potential.

Resistance: 1.1076, 1.1136

Support: 1.1031, 1.0977

XAU/USD (4 Hours)

Gold prices rose to their highest level since March 2022, reaching $2,048.67 per troy ounce on Thursday, despite an optimistic market outlook. This was due to speculation that the US economy would avoid a severe contraction if the Federal Reserve (Fed) ends its tightening cycle. The Producer Price Index (PPI) in the US declined 0.5% month-on-month in March, which was lower than expected, and annual readings also fell. This news caused the US dollar to fall and stock indexes to rise. The weekly unemployment claims also rose, indicating a weaker labor market. The Nasdaq Composite was up 1.57%, while the Dow Jones Industrial Average and S&P500 also saw gains. The 10-year Treasury note yields remained unchanged at 3.42%, while the 2-year note yields decreased by 3 basis points.

Looking at the technical analysis, the XAU/USD price is still increasing and attempting to surpass the upper band of the Bollinger band. There is currently a high demand for gold in the market due to the release of some weak US data. We have adjusted our key support level to $2,039, which was previously a resistance level. The RSI is entering the overbought level, which suggests a potential correction lower today, particularly since it is the end of the week.

Resistance: $2,053, $2,068

Support: $2,039, $2,020

Economic Data

CurrencyDataTime (GMT + 8)Forecast
USDCore Retail Sales (Mar)20:30-0.40%
USDRetail Sales (Mar)20:30-0.40%
USDPrelim UoM Consumer Sentiment22:0062.0

Notification of Server Upgrade – April 13, 2023

Dear Client,

As part of our commitment to improving our client’s user experiences, there will be an upgrade this weekend.

Maintenance Hours: April 15, 2023, 02:00 to 13:00 (GMT+3)

Reminders:

1. During the upgrade, the login to the client portal and VT Markets App will be unavailable. In addition, all their functions will be limited.

2. Please trade via MT4/5 if there’s any need during the upgrade.

3. Kindly keep an eye on the open positions and ensure sufficient funds in your trading accounts at an early date.

Thank you for your patience and understanding about this important initiative.

If you’d like more information, please don’t hesitate to contact [email protected].

Weekly Dividend Adjustment Notice – April 13, 2023

Dear Client,

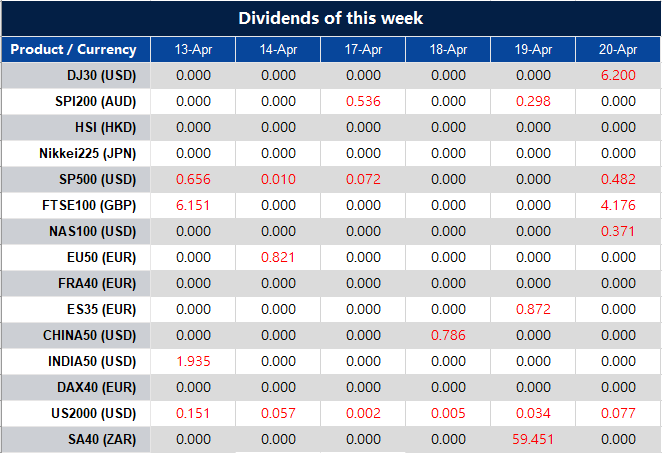
Please note that the dividends of the following products will be adjusted accordingly. Index dividends will be executed separately through a balance statement directly to your trading account, and the comment will be in the following format “Div & Product Name & Net Volume”.

Please refer to the table below for more details:

The above data is for reference only, please refer to the MT4/MT5 software for specific data.

If you’d like more information, please don’t hesitate to contact [email protected]

Wall Street Falls Amid Recession Concerns Despite Cooler-Than-Expected Inflation Data

Stocks on Wall Street declined on Wednesday, despite the release of cooler-than-expected inflation data, due to concerns about a potential recession. The Dow Jones Industrial Average fell by 0.11%, while the S&P 500 and Nasdaq Composite dropped 0.41% and 0.85%, respectively. This came after the Federal Reserve’s March policy meeting minutes showed officials feared a mild recession later this year after the U.S. banking crisis.

Meanwhile, the March consumer price index rose by only 0.1%, compared to the expected 0.2%, suggesting that inflation is beginning to slow. However, the core CPI, which excludes food and energy, rose as anticipated. As companies such as JPMorgan Chase, Wells Fargo, Citigroup, and UnitedHealth begin reporting first-quarter earnings later in the week, the health of the U.S. economy and consumers will be further tested.

data by Bloomberg

On Wednesday, all sectors in the stock market declined by 0.41%, except for Industrials which increased by 0.33%, Energy which increased by 0.11%, and Materials which increased by 0.07%. Health Care increased by only 0.02%, while Utilities decreased by 0.12%, Financials by 0.20%, Real Estate by 0.30%, Consumer Staples by 0.45%, Information Technology by 0.61%, and Communication Services by 0.89%. Consumer Discretionary saw the largest decline, falling by 1.54%.

Major Pair Movement

Data taken from MT4 VT Markets

On Wednesday, the dollar index fell by around 0.6% after the March U.S. CPI came in slightly lower than expected. However, the losses were somewhat contained after Fed speakers reminded the markets that they could still tighten further if core inflation does not proceed sustainably toward their target. The minutes from the Fed’s March meeting showed concern regarding the banking crisis, but inflation remained a top priority.

The EUR/USD rose by 0.74%, nearing February’s one-year highs at 1.1034, as the ECB is expected to hike rates by at least 75bp into year-end, compared to the Fed, which is not fully priced to hike 25bp in May before roughly 50bp of cuts by December. Sterling also rose by 0.5%, nearing April’s 10-month highs at 1.2525, and could continue to climb if upcoming U.S. data favor a more cautious Fed. The USD/JPY fell by 0.42%, but it now needs hawkish U.S. data to get a bullish close above the pivotal 133.77 level.

Technical Analysis

EUR/USD (4 Hours)

The EUR/USD pair reached a psychological resistance level of 1.1000, its highest in more than two months. The US Dollar Index (DXY) dropped to around 101.53 due to market expectations that the Federal Reserve (Fed) will pause its policy tightening. The rise in the major currency pair is due to the US inflation slowing as expected, with headline inflation only increasing by 0.1% and annual inflation easing from 6% to 5%. Core inflation, however, increased from 5.5% to 5.6% due to persistent rent prices.

The Fed believes that US inflation will continue to soften and reach the middle of 3% this year before reaching desired levels in 2024. The market is keenly watching Friday’s US Retail Sales data, which is expected to contract by 0.4%. More rate hikes from the European Central Bank are anticipated due to stubborn inflation caused by a labor shortage and higher oil prices.

From a technical perspective, the EUR/USD price is continuing to rise and create a strong push to the upper band in the Bollinger band. We have adjusted our support level to 1.0962 as the market is expected to break higher today with the release of PPI data which is also an indicator for the US inflation data. The RSI has risen above 50 (at 69), indicating a potential for further upward movement.

Resistance: 1.1026, 1.1052

Support: 1.0962, 1.0921

XAU/USD (4 Hours)

Gold prices initially surged to a high of $2,028.31 per troy ounce after the release of the US Consumer Price Index, which indicated that price pressures continued to recede in March, easing concerns about inflation. However, prices retraced gains and are now hovering around $2,007. The weaker US dollar across the FX market and positive stock market sentiment fueled by modest inflation figures are increasing expectations that the Federal Reserve will hike rates one more time before pausing.

The central bank has adopted a more dovish stance amid a banking crisis that ended up with the collapse of two local banks and dragged alongside Swiss giant Credit Suisse. The inflation figures have somehow let the Fed stay comfortable with a more conservative stance, diminishing the risk of a recession. Investors are not expecting any surprises from the upcoming release of the Federal Open Market Committee Meeting Minutes, which should repeat the dovish tone from Chair Jerome Powell and, if anything, trigger another round of dollar sell-off.

From a technical perspective, the price of XAU/USD continues to rise and reach the upper band of the Bollinger band. The market is currently waiting for the release of the PPI which is also an indicator of the US inflation data. We adjusted our key support level to $2,010. As long as this level is maintained, the XAU/USD uptrend will remain intact. The RSI keeps moving above the 50 levels, indicating that there is potential for gold to continue to rise.

Resistance: $2,026, $2,039

Support: $2,010, $1,997

Economic Data

CurrencyDataTime (GMT + 8)Forecast
AUDEmployment Change09:3020.8K
AUDUnemployment Rate09:303.60%
GBPGross Domestic Product (Mar)14:000.10%
USDCore Producer Price Index (Mar)20:300.20%
USDProducer Price Index (Mar)20:300.00%
USDUnemployment Claims20:30233K
CADBOC Gov Macklem Speaks21:00
Back To Top
server

Hello there 👋

How can I help you?

Chat with our team instantly

Live Chat

Start a live conversation through...

  • Telegram
    hold On hold
  • Coming Soon...

Hello there 👋

How can I help you?

telegram

Scan the QR code with your smartphone to start a chat with us, or click here.

Don’t have the Telegram App or Desktop installed? Use Web Telegram instead.

QR code