EUR/GBP pair faces selling pressure near 0.8745 ahead of UK GDP announcement in early European trading
EUR/USD rises to 1.1720, breaking a four-day downturn as bullish momentum builds
EUR/USD stays above 1.1700 as strong buying momentum builds, trading around 1.1720 during Asian hours on Monday. Technical analysis suggests a positive outlook with the pair slightly above an upward channel. The 14-day Relative Strength Index (RSI) is at 61.63, indicating solid momentum and upward pressure.
The nine-day Exponential Moving Average (EMA) is above the 50-day EMA, confirming a bullish stance. EUR/USD may aim for 1.1800, close to the two-month high of 1.1804. If it breaks above this level, the next target could be 1.1860, and then towards 1.1918, a level not seen since June 2021.
Recent Price Movements
Immediate support is at the nine-day EMA of 1.1713, which aligns with the lower boundary of the ascending channel at 1.1710. If the price falls below this level, it could weaken short-term momentum, testing the 50-day EMA at 1.1648 and the recent low of 1.1589 from December 1. Today, the Euro rose by 0.08% against the US Dollar. It also gained against other major currencies: 0.18% against GBP, 0.22% against JPY, and 0.23% against AUD. The following table shows the Euro’s percentage change against these currencies. This analysis includes insights from an AI tool. We recall the significant bullish momentum when the pair crossed 1.1700 years ago, eventually pushing it above 1.1900 in early 2024. Now, on December 22, 2025, the pair trades around 1.2250, but momentum has slowed as the new year approaches. This pause signals a need for a new catalyst to set the next major direction.Options Strategy Considerations
In light of recent lower US inflation, with November’s Consumer Price Index (CPI) at 2.8%, a dovish shift from the Federal Reserve seems more likely. Traders might think about buying call options with strike prices over 1.2350 to take advantage of a possible breakout. This strategy offers a defined-risk way to prepare for a potential year-end rally if the dollar weakens further. Conversely, the European Central Bank has suggested its rate hike cycle is completed, with Eurozone inflation now at 2.5%. This places a limit on the Euro’s strength, indicating a range-bound market or a pullback might occur in the upcoming quiet holiday weeks. Buying put options with a strike near 1.2100 could be a helpful way to safeguard against a failure to rise further. Currently, we see much lower implied volatility compared to the sharp central bank tightening phases experienced in 2022 and 2023. During that time, EUR/USD fell below parity due to the energy crisis and aggressive Fed actions, leading to significant price swings. The current calmer environment results in relatively cheaper option premiums, providing an opportunity to position for the next major move in early 2026. Create your live VT Markets account and start trading now.Dividend Adjustment Notice – Dec 22 ,2025
Dear Client,
Please note that the dividends of the following products will be adjusted accordingly. Index dividends will be executed separately through a balance statement directly to your trading account, and the comment will be in the following format “Div & Product Name & Net Volume”.
Please refer to the table below for more details:
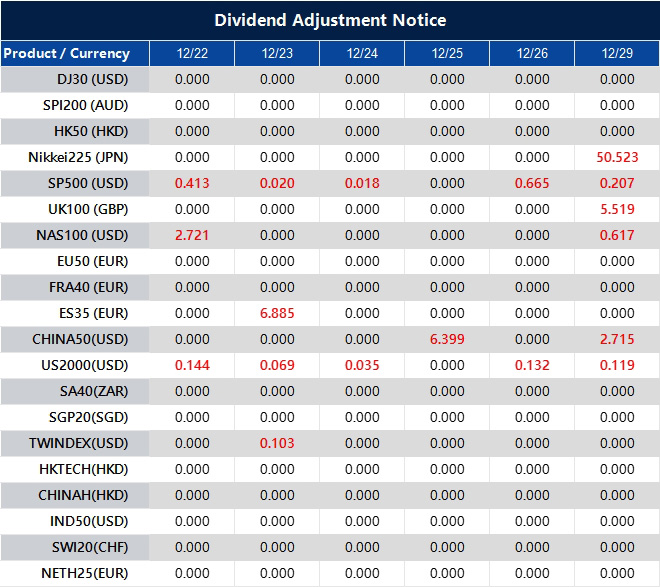
The above data is for reference only, please refer to the MT4/MT5 software for specific data.
If you’d like more information, please don’t hesitate to contact [email protected].
The GBP/JPY pair starts the week weaker, reversing Friday’s gains from a multi-year high.
The Bank of England’s Influence
The Bank of England’s tough stance is helping strengthen the Pound, which offsets gains made by the Yen. Recently, the Monetary Policy Committee voted 5-4 to reduce interest rates by 25 basis points to 3.75%. This close call came after an unexpected inflation report, leading to lower expectations for major rate cuts next year. Investors are waiting for the UK’s final Q3 GDP results, but trading volumes are low because of the holiday season. Caution is advised before confirming that GBP/JPY has peaked around 211.00. The Yen is gaining strength against major currencies, especially the US Dollar. As GBP/JPY trades just below its multi-year high of 211.00, we are observing some profit-taking. The slight drop is supported by a modest demand for the safe-haven Japanese Yen due to ongoing geopolitical concerns. However, this downward trend is weak and lacks strong momentum. The main risk for investors holding long positions is potential intervention by Japanese authorities, a concern that rises as the currency weakens. Last week, we saw increased verbal warnings from the Ministry of Finance after USD/JPY exceeded 168, making direct market intervention a real possibility. This explains the Yen’s strength against major currencies today.Possible Risk Factors
On the flip side, the British Pound remains strong thanks to the Bank of England’s tough stance. The close 5-4 vote to cut rates to 3.75% shows deep divisions within the committee and a hesitation to ease policies, especially after November’s CPI data revealed inflation unexpectedly remained at 3.1%. This indicates that the BoE may be slow to cut rates again in early 2026. For derivative traders, this creates a risky situation where the upward trend could change suddenly. Buying GBP/JPY put options with a strike price around 208.00 or 207.00 may be a smart way to protect against a sudden drop caused by intervention. This strategy allows traders to benefit from further gains while limiting potential losses from a rapid Yen rise. Create your live VT Markets account and start trading now.GBP/USD rebounds to around 1.3390 as UK GDP data nears
GBP/USD has climbed to around 1.3390 during the Asian trading session on Monday after three days of declines. This increase happens as the UK prepares to release its third-quarter GDP numbers, which are important for the Pound Sterling.
Market analysts predict that the Bank of England might cut interest rates for the first time in June 2026, with a 40% chance of a cut as early as March 2026, according to Capital Edge data. This could present challenges for the British Pound.
Challenges For The GBP/USD Pair
The GBP/USD pair is expected to face difficulties due to the UK’s economic conditions and geopolitical issues in 2026. Differences in monetary policy between the Federal Reserve and the Bank of England could also affect this currency pair. In 2025, the Pound Sterling rebounded after reaching a low of 1.2100 against the US Dollar in January. Later, the GBP/USD pair hit a nearly four-year high of 1.3789 on July 1. This indicates that volatility may be on the horizon for the coming year. With GBP/USD currently near 1.3390, it’s important to reflect on a successful year that saw the pair rise from 1.2100 to a peak of 1.3789 in July. However, attention now turns to the future monetary policy of the Bank of England, especially regarding the timing of the anticipated interest rate cut. The market has fully accounted for a rate cut in June 2026, but there’s still a significant 40% chance of a move as early as March. This expectation is fueled by inflation, which has finally moved closer to its target; the latest data from November 2025 shows a CPI of just 2.1%. This gives the Bank of England the flexibility to act sooner if economic indicators continue to decline.Preparing For Market Changes
With a bleak outlook for the UK economy, traders might consider purchasing GBP/USD put options that expire in March 2026. This approach offers a safety net against an early rate cut, which could weaken the pound. The UK economy has struggled for growth all year, with the Office for Budget Responsibility reporting a mere 0.5% GDP growth in 2025. For those unsure about the market direction but anticipating a significant movement, long straddles focused on the Bank of England meetings in February and March 2026 could be a wise strategy. Historically, implied volatility tends to spike around these events, providing chances for profit. This is particularly relevant as the Federal Reserve seems to be on a different trajectory, having kept rates steady for the last two quarters of 2025. Traders using forward contracts must also adjust their strategies for this expected policy shift. The shrinking interest rate gap between the UK and the US makes holding long GBP positions less appealing from a yield standpoint. This trend is already reflected in the forward points for the first quarter of 2026. Create your live VT Markets account and start trading now.Gold prices in Saudi Arabia have increased, according to recent data sources.
Gold prices in Saudi Arabia have increased, according to FXStreet data. On Monday, the price was 530.38 Saudi Riyals (SAR) per gram, up from 523.35 SAR on Friday. The price per tola also rose from 6,104.23 SAR to 6,186.30 SAR.
FXStreet calculates gold prices by converting international USD/SAR rates into local currency and measurement standards. These prices are updated regularly based on current market conditions, but local prices may differ slightly.
Significance of Gold as a Financial Asset
Gold is a key financial asset. It serves as a store of value and protects against inflation. Central banks, especially in emerging economies like China and India, are major buyers, adding 1,136 tonnes in 2022. Gold often moves in the opposite direction of the US Dollar and riskier assets. It tends to rise when the Dollar weakens and during stock market declines. Several factors impact gold prices, including geopolitical issues and economic conditions. Since gold does not earn interest, it tends to do better when interest rates are lower. The strength of the US Dollar also affects gold prices; a weaker Dollar usually leads to higher prices. With gold prices now over 530 SAR per gram, its status as a safe-haven asset is confirmed. This rise, especially during a typically quiet holiday period, indicates market concerns. Traders might want to consider options that benefit from this upward trend as we approach the new year.Actions of Major Market Players
We should pay attention to what major market players are doing, as central banks remain significant buyers. In 2022, they purchased a record 1,136 tonnes, and recent data from the World Gold Council shows they have added over 800 tonnes so far this year. This continuous demand provides strong support for prices, making steep declines less likely. The relationship between gold and the US Dollar is crucial right now. The US Federal Reserve’s cautious approach during its November 2025 meeting has kept the dollar weak, thereby boosting gold prices. If the market thinks that interest rates will stay stable or even drop in 2026, gold prices are likely to keep rising. Geopolitical uncertainty is another major reason for the current rush to safety. Ongoing tensions in important regions, combined with low holiday trading volumes, may lead to larger price fluctuations in the coming weeks. This scenario suggests that holding options profiting from increased volatility is a wise move. Finally, there’s a noticeable shift away from riskier assets. The S&P 500 has fallen nearly 5% this month, leading investors to seek refuge in assets that don’t move with stocks. This trend strengthens the case for using gold options as a hedge against further losses in the stock market as we close out 2025. Create your live VT Markets account and start trading now.Gold prices in the Philippines rise today according to market data analysis
Gold prices in the Philippines increased on Monday, according to FXStreet data. The price rose to PHP 8,305.64 per gram, up from PHP 8,194.50 last Friday.
The price for a tola went up to PHP 96,875.30, compared to PHP 95,579.03 from the previous week. For other measurements, 10 grams are priced at PHP 83,056.34, and a troy ounce costs PHP 258,333.70.
Gold Price Calculation
FXStreet calculates these prices by converting international prices to PHP and updates them daily. Local rates may vary slightly. Gold is valued for its long history as a reliable store of value and medium of exchange. It is often seen as a safe investment during uncertain times and a defense against inflation. Central banks own the most gold and buy it to support their currencies. In 2022, they purchased 1,136 tonnes of gold, the highest annual amount recorded. Gold prices and the US Dollar usually move in opposite directions; when the Dollar weakens, gold prices often rise. Other factors like geopolitical instability and interest rates also impact gold prices.Impact of Economic Uncertainty
Gold prices may rise during times of economic uncertainty, benefiting from falling interest rates, while a strong US Dollar can keep prices steady. The recent rise in gold prices could indicate a shift we should pay attention to. This change is part of a bigger trend, as the US Dollar dropped 1.5% against a group of currencies over the past month. Because gold is priced in dollars, its value often rises when the Dollar weakens. This price movement is supported by growing worries about a global economic slowdown as we approach 2026. Recent manufacturing PMI data from November 2025 for both the Eurozone and the US fell short of expectations, suggesting that central banks might need to adopt more accommodating policies sooner than expected. This situation makes gold a more attractive safe-haven asset. Central bank activities continue to support gold prices, a trend we’ve seen since record purchases in 2022 and 2023. Early December 2025 data showed that emerging market central banks added another 800 tonnes to their reserves this year, indicating a continuing strategy of reducing reliance on the US dollar. Additionally, gold-backed ETFs have seen renewed investments, with a net inflow of $1.2 billion this month, contrasting with outflows in the third quarter. In the upcoming weeks, it may be wise to position for further price increases, especially since trading volumes often decrease during the holidays, which can amplify price movements. Buying call options on February 2026 gold futures could be a cost-effective way to take advantage of this potential rally. Given the growing uncertainty, employing bull call spreads might also be a smart approach to manage some of the costs. Looking back, the current situation is similar to late 2018 when fears of a policy error by the Federal Reserve caused a significant gold rally in 2019. Likewise, the Fed’s recent dovish signals, along with ongoing inflation slightly above 3%, create a favorable setting for non-yielding assets. We should be ready for increased volatility and view gold as an important hedge in our portfolios. Create your live VT Markets account and start trading now.Week Ahead: Japan Changes Course Without Rattling Markets

The economic calendar looks relatively light in the days ahead, yet price action may tell a different story. As year-end approaches and liquidity continues to thin, even small data surprises could be enough to knock the US dollar, gold, or cryptocurrencies out of their recent trading ranges.
On 19 December, the Bank of Japan lifted its policy rate to 0.75%, the highest level seen in more than 30 years, signalling a cautious but deliberate move away from ultra-accommodative policy settings.
While some investors had braced for a disorderly reversal of the yen carry trade, market reactions remained controlled.
US equity futures edged higher and Bitcoin advanced following the announcement, suggesting the rate hike had already been largely discounted. Governor Kazuo Ueda further calmed markets by emphasising that policy rates are still below the estimated neutral level.
Japan’s real yields remain in negative territory, keeping overall financial conditions supportive.
For traders, this is significant. Without a meaningful yield advantage, the yen still lacks the pull needed to trigger widespread forced deleveraging across global markets. Any unwinding of carry trades is therefore more likely to play out gradually over months rather than abruptly.
US Growth Signals Move Into Focus
Attention now shifts to the preliminary US GDP reading for the third quarter, expected at 3.2%, down from the previous 3.8%. A softer outcome would reinforce the view that US economic momentum peaked earlier this year.
The dollar index bounced from the 97.40 area last week, but the rebound appears tentative. Should GDP data confirm slowing growth, renewed USD weakness could emerge, offering support to commodities and risk assets as the year draws to a close.
Liquidity is also set to decline sharply over the coming sessions, a seasonal pattern that often amplifies technical moves around key price levels.
Risk Assets Stay Resilient
Equities and cryptocurrencies continue to adjust to the idea that global monetary tightening has become more predictable. The absence of a policy shock has helped maintain risk appetite, although further gains may depend on whether incoming growth data continues to soften.
Bitcoin remains locked in a range, reflecting equilibrium rather than strong directional conviction. Gold, meanwhile, continues to attract buyers on pullbacks as expectations for real yields remain capped.
Market Movements Of The Week
US Dollar Index (USDX)
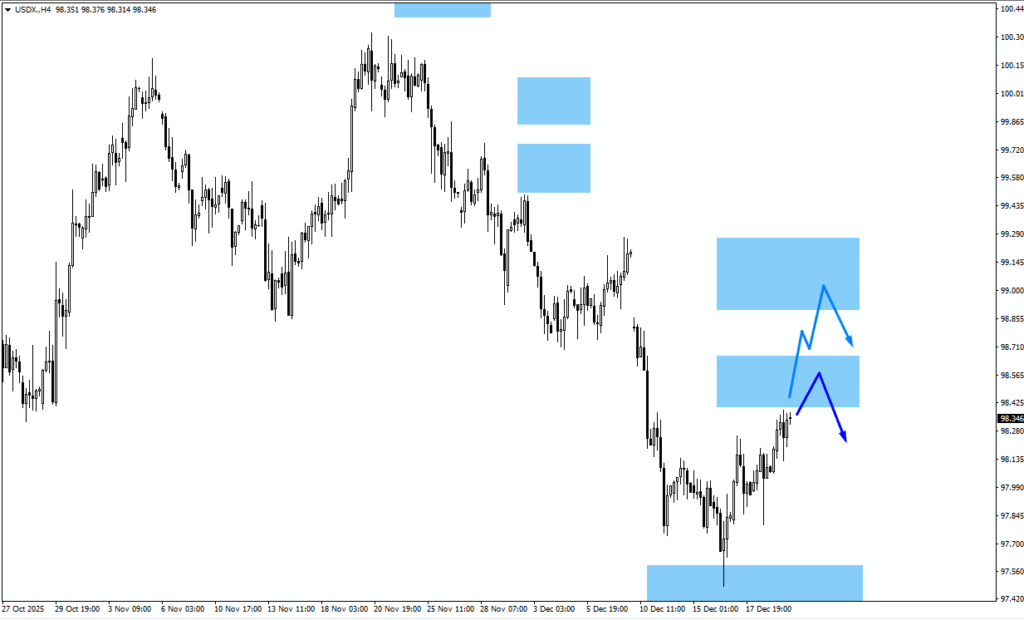
– USDX rebounded from the 97.40 monitored zone last week.
– Resistance sits near 98.55, with scope toward 99.10 if momentum holds.
– A weak GDP print could reverse gains back into range.
USDJPY
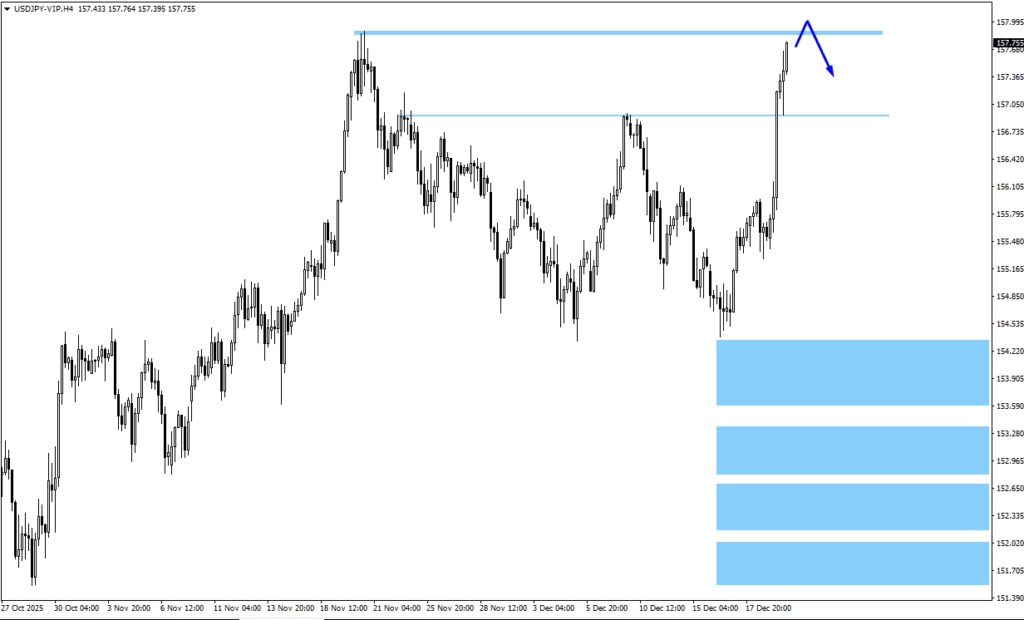
– USDJPY pushed higher following the BOJ decision.
– Price may test above 157.88 before encountering selling pressure.
– Failure to hold above recent highs may signal consolidation rather than trend.
Gold (XAUUSD)
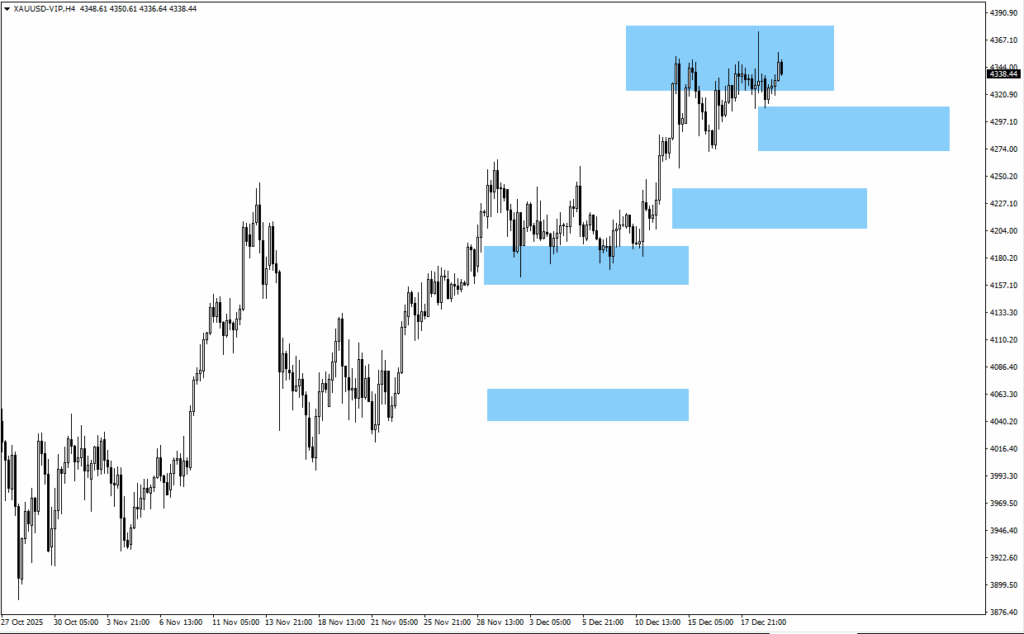
– Gold bounced from the 4290 zone but lacks strong continuation.
– Pullbacks toward 4290 or 4215 may attract dip buyers.
– Direction depends on US data and USD reaction.
Bitcoin (BTCUSD)
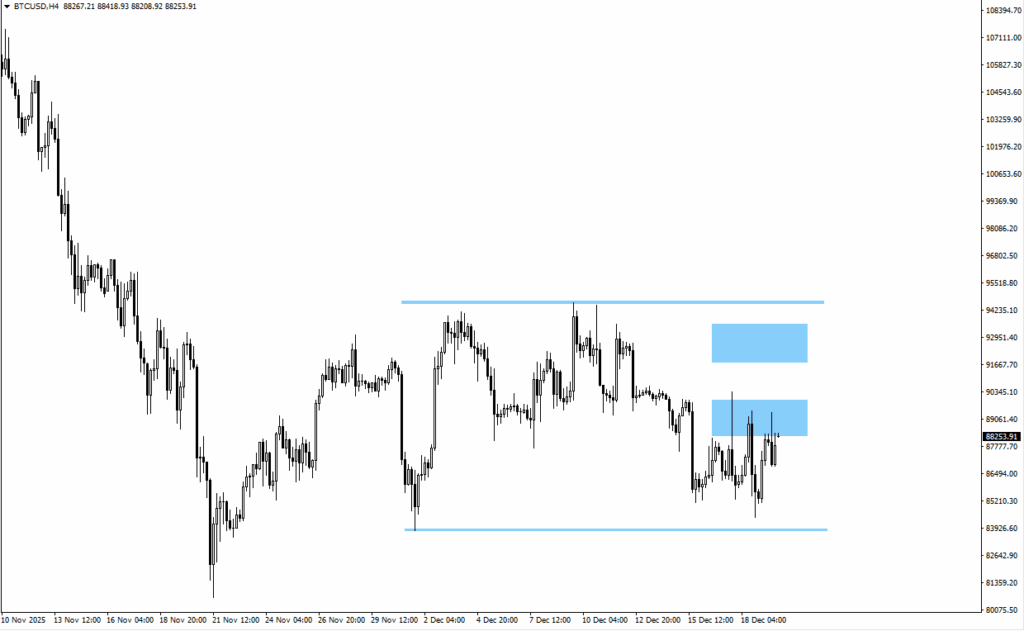
– Bitcoin remains range-bound near 89,250.
– A close below 83,814 opens downside toward 75,850.
– A break higher places focus on 91,780 resistance.
S&P 500 (SP500)
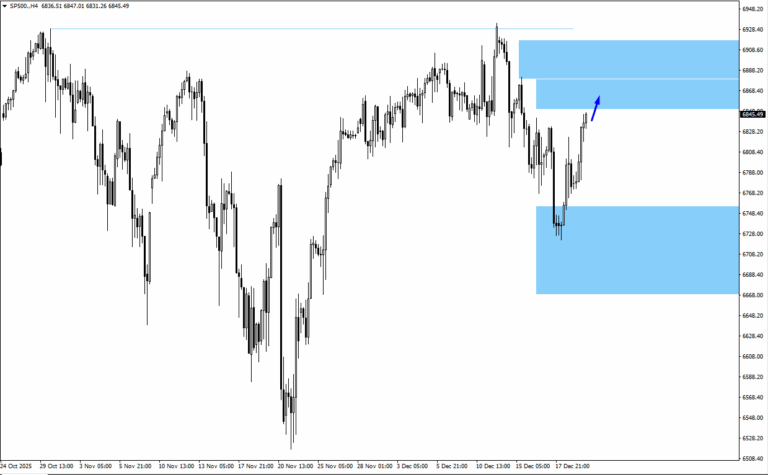
– Index rebounded strongly from recent lows.
– Upside levels to monitor sit near 6,870 and 6,905.
– Holiday liquidity may exaggerate intraday moves.
Key Event This Week
23 December
1. US Prelim GDP q/q, Forecast: 3.20%, Previous: 3.80%
Softer growth may cap USD upside.
Bottom Line
Markets enter the week in a period of transition, shifting away from policy-driven volatility towards a more technically driven environment. Japan’s gradual move away from ultra-loose policy has so far avoided market disruption, allowing risk sentiment to remain relatively stable as investors reassess their positioning.
The spotlight now falls on US growth data and the dollar’s response. A weaker GDP print could limit further USD upside and lend support to commodities and risk assets, while thin holiday liquidity raises the risk of outsized moves around key technical zones.
Gold prices rise in the United Arab Emirates based on today’s collected data.
Gold prices in the United Arab Emirates went up on Monday. According to the latest data from FXStreet, the cost per gram is now 519.48 AED, up from 512.44 AED on Friday.
The price per tola also increased, rising to 6,059.11 AED from 5,976.98 AED. FXStreet updates these rates daily to match local prices with international ones.
Gold As A Reliable Asset
Gold has always been a reliable asset, acting as a safe place to store value. Central banks are major buyers of gold, adding 1,136 tonnes in 2022 to help stabilize their economies. Gold prices often rise when the US Dollar weakens. Various factors influence these prices, including political tensions and interest rates. Typically, during times of political uncertainty or economic slowdowns, gold prices increase. Lower interest rates tend to boost gold, while a stronger US Dollar can limit its price rises. The recent rise in gold prices signals a move toward safety as the year ends. This increase, occurring during a typically low-volume holiday trading period, indicates strong demand for safe-haven assets. Traders should be aware that price shifts can be more pronounced in thin markets.Reasons For Gold’s Strength
We believe that anticipation of US interest rate cuts in early 2026 is a key reason for gold’s rising value. The steady decrease in CPI inflation throughout 2025, with core inflation dipping below 2.5% for the first time in years, has led many to bet that the Federal Reserve will adopt a gentler approach. Lower interest rates make holding non-yielding assets like gold more attractive. Political instability is also boosting gold’s appeal, putting pressure on the US Dollar. Ongoing tensions in various global regions are pushing investors to shift away from risky assets and the dollar, which has struggled to stay above the 104 level on the DXY index. A weaker dollar makes gold cheaper for those holding other currencies. We must also consider the strong demand from central banks, which creates a solid price floor for gold. Following record purchases in 2022 and 2023, the World Gold Council reports that central bank buying remained very strong in 2024 and 2025. This trend shows a strategic move towards de-dollarisation, supporting the value of gold. For traders dealing in derivatives, this situation favors taking bullish positions in the coming weeks. Buying call options with expirations in February or March 2026 could capitalize on expected price increases from potential rate cuts. Long futures contracts also offer direct upside exposure, but they come with higher risks. It’s essential to manage potential losses, as an unexpectedly hawkish statement from the Fed could reverse gains quickly. Hedging long positions by purchasing out-of-the-money put options can protect against rapid declines. Bull call spreads are another smart strategy to limit risk and lower entry costs while maintaining a positive outlook. Create your live VT Markets account and start trading now.The Australian dollar rises against the US dollar as China’s central bank keeps loan prime rates steady
The Australian Dollar (AUD) rose against the US Dollar (USD) after China’s central bank decided to keep its Loan Prime Rates unchanged. The one-year LPR remains at 3.00%, and the five-year LPR stays at 3.50%. Investors are closely watching the Reserve Bank of Australia (RBA) as it prepares to release its Meeting Minutes. According to the ASX 30-Day Interbank Cash Rate Futures for February 2026, there is a 27% chance of a rate increase to 3.85% in the next RBA Board meeting.
The US Dollar Index (DXY) has dropped and is around 98.60. Markets are looking forward to the upcoming US GDP data for the third quarter. Discussions at the Fed focus on keeping rates steady versus potential future cuts. The CME FedWatch tool indicates a 79.0% chance of maintaining current rates at the January meeting, while the likelihood of a 25-basis-point cut has decreased to 21.0%. The US Consumer Price Index (CPI) eased to 2.7% in November, which is lower than what analysts expected, while core CPI increased to 2.6%.


