New Zealand’s NZIER business confidence fell by 52 percentage points quarter-on-quarter. It recorded -4% in Q1, compared with 48% in the previous quarter.
This sharp reversal in business confidence, from a strong 48% to a negative 4%, is a significant warning sign for the New Zealand economy. Such a dramatic drop signals that businesses are now bracing for a slowdown, directly contradicting the optimism we saw at the end of 2025. We should prepare for increased market volatility as this new reality is priced in.
New Zealand Dollar Outlook
Given this outlook, we should anticipate sustained weakness in the New Zealand dollar. The most direct response is to consider short positions against the kiwi, particularly through options to limit risk. This view is strengthened by recent data showing Australia’s terms of trade improved by 2% in the last quarter, creating a clear policy and economic divergence that favors the AUD/NZD cross.
The Reserve Bank of New Zealand will now be in a difficult position, as this data makes further rate hikes almost impossible. We believe derivatives tied to the Official Cash Rate are now mispriced, and traders should look at positions that will profit if the central bank pivots to a more neutral or dovish stance sooner than expected. The market was pricing a 40% chance of a hike by August; that should now move towards zero.
For equity markets, this is a clear signal to hedge long positions or initiate bearish strategies on the NZX 50 index. When business confidence falls this steeply, future corporate earnings and investment plans are put at risk. Buying put options on the index or on major cyclical stocks offers a way to capitalize on a potential downturn.
Looking back, we saw a similar, though less severe, confidence dip in mid-2025 before the RBNZ paused its hiking cycle. That event led to a 150-pip drop in the NZD/USD over the following two weeks. The current drop is far more pronounced, suggesting the market reaction could be quicker and more severe.
This report also follows last week’s data showing that New Zealand’s net migration figures, a key driver of growth in 2025, have slowed considerably in early 2026. The combination of falling confidence and slowing population growth creates a powerful headwind for the domestic economy. Therefore, positions that bet on a stronger New Zealand economy now carry significantly more risk.
Commerzbank analyst Dr Henry Hao says China is better placed than many Asian economies to handle energy disruption linked to Middle East tensions and risks around the Strait of Hormuz. The note points to diversified crude imports, large strategic reserves, and lower fossil fuel use per unit of GDP.
Across Asia, countries are using strategic petroleum reserves with mixed results. Japan, South Korea, and Taiwan have strong state stockpiles, while India, Thailand, and the Philippines have limited inventories and are more exposed to extended supply disruption.
China Policy Buffer
China is described as using reserves and policy measures to soften short-term price and supply shocks. Ongoing geopolitical volatility is said to keep pressure on this near-term cushioning.
China has reduced reliance on Middle East crude through diversification, and this share is described as the lowest among major Asian economies. The report says the Middle East portion of China’s crude sourcing has been declining since 2022.
The report adds that China’s broader energy mix is shifting, with more renewables and less fossil fuel consumption per unit of GDP. It also notes that impacts can vary by sector, with transport and chemicals more likely to face strain if volatility persists.
Given the tensions around the Strait of Hormuz, we should consider trades that favor Chinese assets over those of its more vulnerable Asian neighbors. One strategy is to structure a pairs trade, going long the Chinese Yuan against a basket shorting the Japanese Yen and South Korean Won. This position is supported by the latest March 2026 data showing Japan still imports 88% of its crude via the strait, while China’s Q1 2026 figures show its Middle East dependency has fallen to just 42%.
Direct Oil Hedge
An outright long position on Brent crude oil futures or call options is also a direct hedge against a supply shock emanating from the strait. We saw how quickly prices reacted to regional flare-ups back in 2024 and 2025, and any disruption to the nearly 21 million barrels passing through Hormuz daily would have an immediate global impact. This remains the most straightforward way to position for escalating conflict in the region.
China’s structural resilience provides a buffer that its neighbors lack, making its markets a relative safe haven. Last week, China’s National Food and Strategic Reserves Administration confirmed reserves now exceed 90 days of net imports, providing significant short-term insulation from price shocks. This, combined with a reported 25% year-on-year increase in renewable energy generation through February 2026, strengthens the case for China’s relative economic stability.
However, we must also recognize the uneven impact within China’s economy. The analysis points to weakness in the transport and chemical sectors, which are highly sensitive to energy input costs. We can express this view by shorting ETFs focused on Chinese industrial chemicals or by buying put options on major airline and shipping companies listed in Shanghai or Hong Kong.
Finally, the certainty of increased market turbulence means we should be buying volatility. Implied volatility on options for the FTSE China A50 and Hang Seng indices is still relatively low compared to the potential risk. Establishing long vega positions through straddles or strangles would allow us to profit from the price swings that would inevitably follow any disruption, regardless of the ultimate direction.
USD/JPY moved sideways on Monday after dropping on Friday from near 159.50 to an intraday low close to 157.60. It edged down by under 0.1% and traded around 158.80, staying in a 150-pip range between 158.50 and 159.20.
On Sunday, the US seized an Iranian-flagged cargo ship, the Touska, in the Gulf of Oman. The two-week ceasefire announced on 8 April is due to expire on Wednesday, and President Trump said it will end that evening.
Geopolitical Risk Versus Price Action
Iran denied that a second round of Islamabad talks has been firmly scheduled. Iran re-closed the Strait of Hormuz on 18 April, while WTI crude rose above $89 per barrel.
Key US data this week are Retail Sales on Tuesday and flash PMI figures on Thursday. Japan releases national CPI on Friday, alongside the University of Michigan consumer sentiment survey.
On the 15-minute chart, USD/JPY was 158.83 and below the day’s open at 159.18, with the Stochastic RSI near 67. Resistance is near 159.18.
On the daily chart, it held above the 50-day EMA at 158.15 and the 200-day EMA at 154.60, with Stochastic RSI at 21.19. The story’s technical section used an AI tool.
Options Positioning
Given the market’s indecision around the 158.80 level, we see a clear mismatch between the calm currency price and the escalating geopolitical tension with Iran. The ceasefire deadline on Wednesday is a major binary event that the market seems to be underpricing. This complacency suggests that options, particularly those that protect against a sudden downturn, are attractively valued.
We should be positioning for a potential risk-off shock where the Japanese Yen regains its safe-haven status. Buying USD/JPY put options with expirations in the next few weeks offers a defined-risk way to profit from a breakdown in US-Iran talks. Such a strategy allows us to capitalize on a sharp move lower without being exposed to unlimited risk if the situation de-escalates and the pair resumes its uptrend.
A failure of the ceasefire could easily push WTI crude prices back toward the $100 mark, considering that roughly 21% of global petroleum liquids consumption passes through the Strait of Hormuz. We saw in early 2022 how the invasion of Ukraine sent oil prices soaring over 30% in just a couple of weeks, creating massive market volatility. While USD/JPY rose then due to interest rate policy, a direct conflict in the Gulf could trigger a far more aggressive flight to safety into the yen.
The key indicator to watch is implied volatility, which remains subdued despite the clear and present danger. We expect measures of currency volatility to spike significantly if Wednesday’s deadline passes without a peaceful resolution. Therefore, entering these protective positions now, before volatility gets expensive, is the prudent move.
From a technical standpoint, the 50-day moving average around 158.15 is the critical line of defense for the current uptrend. A break below this level on negative headlines would signal that the bullish structure is failing and could accelerate a move towards the 154.60 area. Our put options would gain significant value in such a scenario.
Financial markets focused on Middle East tensions, including the closure of the Strait of Hormuz and the US seizure of an Iran-flagged vessel. Traders awaited a second round of Iran–US talks, while Wall Street closed lower and the US Dollar ended with moderate losses.
The US Dollar Index (DXY) touched a five-day high of 98.35 before turning, set to finish near 98.00. With little data due, markets tracked US President Donald Trump’s social media posts, a US delegation trip to Pakistan, upcoming Retail Sales, the ADP Employment Change 4-week average, and the Senate hearing for Fed Chair nominee Kevin Warsh.
Currency Markets And Key Catalysts
EUR/USD initially gapped lower but moved up to around 1.1800, up 0.20% on the day. Attention turned to speeches by ECB officials and the EU and German ZEW Survey of Economic Sentiment for April.
GBP/USD moved back above 1.3500, supported by broad US Dollar weakness, and UK jobs data awaited ILO unemployment for February (three-month period), expected to hold at 5.2%.
USD/JPY rose as the yen was the weakest G10 currency; the Bank of Japan indicated unchanged rates despite markets pricing 47 basis points of tightening, with trade and export/import data due.
AUD/USD closed above 0.7150 on expectations of RBA rate rises, while WTI gained over 2.4% to $85.89 and gold held above $4,800 under pressure from higher Treasury yields.
Looking Back And Positioning Ahead
We remember how the US-Iran flare-up in 2025 sent oil prices soaring. Last year’s closure of the Strait of Hormuz pushed WTI crude past $85, creating extreme volatility in energy derivatives. Today, with OPEC+ holding production steady after its latest meeting and global inventories sitting 5% below the five-year average, options markets are implying much lower volatility.
The US Dollar was whippy in 2025, with the DXY swinging around the 98.00 level based on geopolitical headlines. Now, the index is trading in a tight range near 104.50 after the Federal Reserve signaled a pause in its hiking cycle last month. With the latest CPI data showing core inflation easing to 3.1%, derivative traders should consider strategies that profit from a sideways-moving dollar.
A year ago, we saw EUR/USD climb towards 1.1800 despite a cautious European Central Bank, mostly due to broad dollar weakness. That situation has now shifted, as the ECB remains hesitant to cut rates while the Bank of England is still battling persistent wage growth that remains above 5%. This policy divergence makes long EUR/GBP futures an attractive hedge against further weakness in the pound.
The yen’s weakness was a defining trend in 2025, as the Bank of Japan firmly resisted the global trend of raising interest rates. However, the BoJ’s recent decision in March to finally exit its negative interest rate policy has fundamentally altered the landscape. Traders should look at buying JPY call options against the dollar to position for a potential unwinding of the massive carry trade.
We saw gold struggle for direction back in 2025, as the market was more focused on pricing in aggressive Fed rate hikes which pushed up Treasury yields. Today, the environment for the non-yielding metal has improved significantly, with the 10-year Treasury yield having fallen below 3.8%. Buying long-dated call options on gold could provide upside exposure as central banks globally continue to add to their reserves.
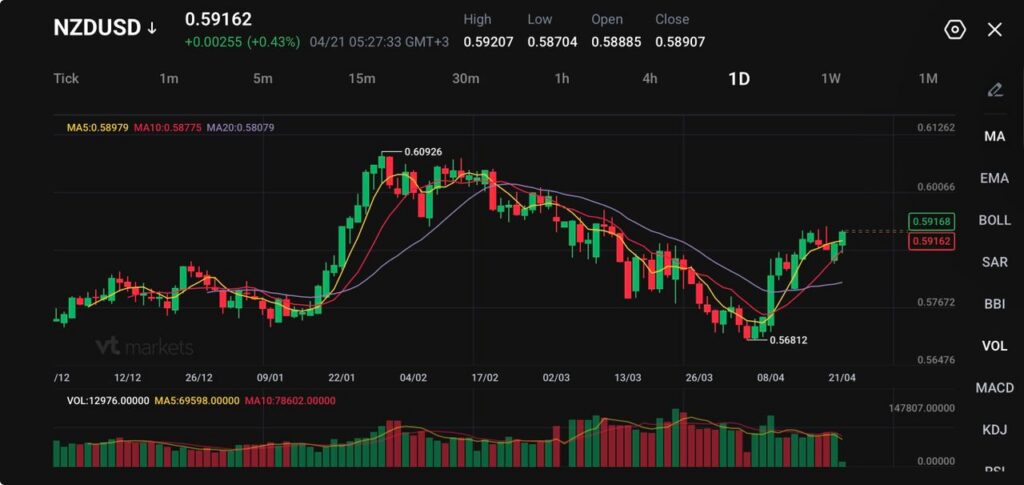
NZDUSD trades at 0.59162, up 0.00255 (+0.43%), after touching 0.59207 and moving close to the recent five-week high zone.
New Zealand CPI rose 0.9% in Q1, while annual inflation held at 3.1%, above the RBNZ’s 1% to 3% target band for a second straight quarter.
Markets lifted the implied chance of a 25 basis-point RBNZ hike next month to about 45%, up from 27% a day earlier, while 2-year government yields jumped 9 basis points to 3.555%.
The kiwi moved higher because the inflation report was firm enough to push the market back toward a more hawkish view of rates. Quarterly CPI rose 0.9%, ahead of the softer disinflation profile many traders had hoped for, while annual inflation held at 3.1%.
That left price growth above the Reserve Bank of New Zealand’s target band for a second consecutive quarter and pushed rate-hike expectations higher.
New Zealand inflation unexpectedly stayed above the Reserve Bank’s 1-3% target in the first quarter, even before the expected Iran-war driven surge in consumer prices from higher fuel and other costs https://t.co/tFqKjzFhi2
A hotter inflation print gives the currency clearer domestic support via rates. The market no longer has the luxury of assuming inflation will drift back into line without another policy response.
A cautious near-term view still favours support for NZDUSD while inflation stays sticky enough to keep hike risk alive.
Yields Turn Supportive
The bond market reacted quickly. The implied probability of a quarter-point hike next month rose to about 45%, from 27% the previous day. Markets now price about 82 basis points of total tightening, up from 70 basis points a day earlier. New Zealand’s 2-year government yield rose 9 basis points to 3.555%, ending a five-day run of declines.
New Zealand’s central bank will soon announce steps to increase the transparency of its monetary policy decisions, Governor Anna Breman said https://t.co/F7qyGgfqZl
That gives NZDUSD more of a rate cushion than it had a week ago. In a market still highly sensitive to central-bank repricing, even a moderate shift in rate expectations can move the currency sharply, especially when the US dollar is not trending decisively higher.
The kiwi is now being supported less by broad risk appetite alone and more by a specific domestic inflation problem that the central bank may have to address.
Recovery Remains Uneven
The complication is that inflation is not the whole story. Business confidence has deteriorated sharply. A private survey showed a net 4% of firms expect business conditions to worsen, compared with 48% optimism in the prior quarter.
That is a brutal swing and a reminder that the domestic recovery remains fragile even before the full effect of the Middle East energy shock comes through.
That leaves the RBNZ with a familiar problem. Inflation is too high, but the growth backdrop is not clean enough to make tightening comfortable.
Governor Anna Breman said last week that she still expects the economy to grow in 2026, especially if the ceasefire in the Middle East holds, but the central bank has already warned it may have to act if inflation becomes entrenched.
New Zealand’s central bank will respond with interest-rate increases to any acceleration in core inflation, Governor Anna Breman said Thursday, as fuel prices surge in response to the conflict in the Middle East https://t.co/A4aWGqiMnS
A cautious forecast still sees the kiwi supported by rate repricing in the short term, but the rally likely becomes harder to extend if growth data continues to soften.
Iran Shock Remains Inflation Driver
The inflation report only captured the first phase of the energy shock, which is why markets reacted so aggressively. Oil and logistics stress from the Iran conflict have already pushed up costs across Australia and New Zealand, and the second-quarter numbers may show that more clearly.
Recent reporting has already flagged the pressure on airlines, exporters, logistics firms, and building-material costs across the region.
Oil prices could rise to $110 per barrel if traffic in the Strait of Hormuz remains disrupted for another month, according to Citigroup https://t.co/PE0AZVxlpC
The current CPI result is particularly important, as it holds more weight than a standard quarterly report. It suggests that inflation was already entrenched before the full impact of war-related costs had a chance to materialise. This raises the likelihood that the RBNZ may need to maintain a restrictive policy, even if economic growth remains lacklustre.
NZDUSD Technical Outlook
NZDUSD is trading near 0.5916, extending its recovery from the recent swing low around 0.5681, with price now stabilising just below short-term resistance. The pair has shifted from a clear downtrend into a corrective rebound phase, supported by improving short-term momentum.
From a technical standpoint, the bias is turning cautiously bullish in the near term. Price has reclaimed the 5-day (0.5897) and 10-day (0.5877) moving averages, both of which are now sloping upward and acting as immediate support. The 20-day (0.5807) remains below and is beginning to flatten, suggesting that downside pressure is fading while a base forms.
Key levels to watch:
Support: 0.5900 → 0.5875 → 0.5800
Resistance: 0.5930 → 0.6000 → 0.6090
The pair is currently consolidating just under the 0.5930 resistance zone, which aligns with recent highs in this recovery leg. A clean break above this level could open the path toward the 0.6000 psychological level, with further upside potential toward 0.6090 if momentum builds.
On the downside, 0.5900 acts as immediate support. A break below this level may see a pullback toward 0.5875, though such a move would likely remain corrective unless price slips back below the 0.5800 region.
Overall, NZDUSD is showing early signs of a trend shift, with buyers stepping in after the March decline. The near-term focus remains on whether price can clear 0.5930 to confirm continuation, or if it stalls and returns to range-bound behaviour.
What Traders Should Watch Next
The next move depends on whether the inflation story keeps dominating the weaker growth story. Another round of firm domestic inflation or labour data would support the case for tighter policy and keep NZDUSD supported near the highs.
A softer activity backdrop or a renewed global risk scare could slow that move quickly. The cross with the Aussie carries weight, because part of the kiwi’s strength has come from rate expectations shifting faster in New Zealand than in Australia.
NZDUSD moved higher because the first-quarter CPI reading came in hot enough to revive the chance of another RBNZ hike. Quarterly inflation rose 0.9%, while annual inflation held at 3.1%, leaving it above the 1% to 3% target band for a second straight quarter.
Why Does A 3.1% Annual CPI Reading Matter So Much For The Kiwi?
Because it keeps inflation above the RBNZ’s target range and makes it harder for the central bank to sound relaxed. That usually supports the currency by lifting rate expectations.
How Much Did Rate-Hike Expectations Change?
Markets lifted the implied chance of a 25 basis-point RBNZ hike next month to about 45%, up from 27% a day earlier. Total expected tightening also rose to about 82 basis points, from 70 basis points.
Why Did New Zealand Bond Yields Jump?
The inflation surprise pushed traders to price a more hawkish RBNZ path. That sent the 2-year government bond yield up 9 basis points to 3.555%, ending a five-day decline.
Why Has The Kiwi Not Broken Higher More Aggressively?
Because the growth backdrop is still shaky. A private business survey showed a net 4% of firms expect conditions to worsen, compared with 48% optimism in the previous quarter. That weak confidence reading limits how far traders want to push the tightening story.
Start trading now – Click here to create your real VT Markets account
USD/SGD fell to 1.2667 last Friday after reports of a conditional reopening of the Strait of Hormuz. It then rebounded sharply in early trade after Iran reclosed the strait over the weekend.
Market attention is on whether a deal is reached or whether there is further military escalation in the next 24–48 hours. The daily chart still shows bearish momentum, but there are early signs it may be easing.
Key Technical Levels
RSI is turning up from near oversold levels. Support is seen at 1.2700 and 1.2670, with 1.2670 marked as the 76.4% Fibonacci level.
Resistance is located at 1.2750/60, linked to the 50-day moving average and the 50% Fibonacci level. Further resistance levels are 1.2800, tied to the 21- and 100-day moving averages and the 38.2% Fibonacci retracement of the 2026 low to high, and 1.2850, aligned with the 200-day moving average and the 23.6% Fibonacci level.
The recent reclosure of the Strait of Hormuz has caused a sharp rebound in USD/SGD, reversing last week’s dip and highlighting the market’s sensitivity to geopolitical risk. This sudden flight to safety underscores the US dollar’s role as a haven, creating immediate opportunities in the options market. We should anticipate heightened volatility in the coming days as the situation develops.
This event is significant because the Strait is a critical artery for global energy; data from last year showed that over 20% of the world’s daily oil consumption transits through this narrow passageway. A sustained closure could easily push Brent crude past the $100 per barrel mark, feeding into the global inflation concerns we have been monitoring. This makes the Singapore dollar, the currency of a trade-reliant and energy-importing nation, particularly vulnerable.
Derivatives Strategy Considerations
The broader market sentiment has already shifted, with the VIX, a key measure of fear, jumping above 25 in recent trading sessions. This risk-off environment generally benefits the US dollar as investors seek liquidity and safety. For Singapore, this external shock complicates the outlook for inflation and economic growth that the Monetary Authority of Singapore has been trying to balance.
From a technical standpoint, the rebound from near oversold conditions suggests the previous downward trend in USD/SGD may be exhausted. This shift makes buying call options an interesting strategy for those who believe tensions will escalate further, as implied volatility is likely to rise, increasing option premiums. The key resistance levels to watch are 1.2760 and the more significant 1.2800 zone.
Derivative traders face a clear binary event over the next 48 hours. A diplomatic breakthrough could send the pair tumbling back toward the 1.2670 support level, rewarding put option holders. However, any sign of military action would almost certainly propel the pair through near-term resistance, targeting the 1.2850 mark.
We can look at the market’s reaction during similar tensions in 2019, when fears of a disruption caused a sharp, albeit temporary, spike in oil and a rush into the US dollar. That historical precedent from several years ago suggests these initial moves can be powerful and fast. Therefore, hedging existing Singapore dollar exposures with derivatives should be a primary consideration for any portfolio with exposure to the region.
Devon Energy Corporation explores for oil and natural gas, mainly in the Permian Basin and other US onshore fields.
From March 2023, DVN moved lower inside a declining parallel channel. In February 2026 it broke above that channel, ending a multi-year downtrend.
Breakout Retest And Momentum
On Friday, the price pulled back to test the breakout. It retraced to the bottom of the post-breakout consolidation zone at $41.92, then pushed higher today.
If momentum fades, the top of the broken channel at $40.36 is a key level to watch. Another support level sits near $38.00, marked by an upward-sloping trendline.
On the upside, resistance is at $48.59. A daily close above $48.59 would bring the April 2024 high pivot at $51.99 into view, with further resistance at $58.81.
Given the confirmed bounce, we see this as a signal to position for further upward movement in the coming weeks. The successful test of the $41.92 support level strengthens the case for buying near-term call options. The immediate goal is to see the stock clear the significant resistance at $48.59.
Energy Market Tailwind
This technical setup is supported by the broader energy market, as WTI crude futures have recently climbed back above $85 per barrel following last week’s EIA report showing a surprise crude inventory draw of 2.7 million barrels. This fundamental tailwind reinforces the bullish outlook for domestic producers. The price action reflects a market that is looking past the supply concerns that weighed on the sector through much of 2025.
For a specific trade, we are looking at call options with strike prices just above the key resistance, such as the $50 strike expiring in June or July 2026. This provides enough time for the stock to challenge its April 2024 high of $51.99. A bull call spread, such as buying the $47.50 call and selling the $52.50 call, could also be used to define risk and lower the upfront cost.
We must also define our risk on this trade by watching the technical structure closely. A daily close below the top of the old channel at $40.36 would signal that the breakout has failed. At that point, we would consider closing bullish positions or purchasing puts to hedge against a move down to the next support level at $38.00.
Looking back, the stock’s grind downwards from its March 2023 levels created a long period of consolidation, which has kept implied volatility in check. A confirmed breakout past $48.59 would likely cause volatility to expand, making current option premiums appear relatively inexpensive. This suggests that now is an advantageous time to own options before a potential major move gets fully priced in.
Malaysia’s export growth eased in March, but exports continued to exceed imports. The trade surplus rose to a one-year high of MYR24.6bn in March, from MYR16.7bn in February.
In 1Q26, the trade surplus totalled MYR63.2bn, compared with MYR48.6bn in 4Q25. This was the largest quarterly surplus since 1Q23.
The stronger trade balance is expected to lift the current account surplus to MYR15.0bn in 1Q26, from MYR2.0bn in 4Q25. The 1Q26 current account data will be released on 15 May, alongside the 1Q26 final GDP figure.
Electrical and Electronics shipments and re-exports supported exports, while imports were led by capital goods. Trade prospects were also linked to the ongoing AI upcycle.
Risks included Middle East tensions and the possibility of a prolonged closure of the Strait of Hormuz. Higher input, crude oil, and shipping costs, plus supply chain disruption, could raise the import bill and weigh on exports.
The 2026 export growth forecast was kept at 2.5%, compared with the BNM estimate of +8.6% and 2025 growth of +6.4%.
We see the widening trade surplus as supportive for the Malaysian Ringgit in the short term. However, the cautious outlook on future export growth introduces significant uncertainty for the currency’s direction. This situation might be ideal for options strategies like straddles on the USD/MYR, which profit from large price moves regardless of direction.
The continued strength in Electrical and Electronics shipments, driven by the global AI upcycle, presents a clear opportunity in the technology sector. Looking back at the semiconductor boom we saw in 2025, a similar pattern could emerge. Traders might consider call options on specific E&E stocks, while simultaneously using put options on the broader FBMKLCI index to hedge against the downside risks from geopolitical tensions.
The heavy reliance on the E&E sector, which accounted for over 40% of our total exports last year in 2025, makes it a focal point. Recent data shows the Bursa Malaysia Technology Index has already climbed 8% this year, outpacing the broader market due to AI optimism. However, with Brent crude prices recently surging past USD 90 a barrel on Middle East news, any escalation could quickly erase those gains by increasing operating costs for manufacturers.
The upcoming release of Q1 GDP and current account data on May 15th is a key event to watch. We anticipate a rise in implied volatility for options expiring around that date as the market positions itself. A current account surplus coming in significantly different from the expected MYR 15.0 billion could trigger sharp movements in both the currency and equity markets.
Written on April 21, 2026 at 2:53 am, by josephine
Silver (XAG/USD) fell more than 1% on Monday after a weekend gap lower. It traded at $79.78 after a daily high of $80.68, following the closure of the Strait of Hormuz and increased US–Iran tensions after a vessel seizure.
A doji formed near $80, which points to indecision between buyers and sellers. The broader trend stayed upward, with support near the 50-day SMA at $78.98, though pressure rose alongside higher US Treasury yields.
Key Technical Breakdown Levels
A break under the trendline near $78.00 would target the 100-day SMA at $77.53 and then the 20-day SMA at $74.34. The upward view would change if Silver makes a fresh low below $77.78.
If price moves above $80, the next levels are $83.05, $85.46, $87.43, and $89.42, with $90.00 also in view. Silver prices are influenced by geopolitics, recession fears, interest rates, the US Dollar, demand, mining supply, recycling, industrial use, and Gold’s moves.
We are seeing a familiar pattern of indecision now in late April 2026, much like we observed around this time last year. Silver is currently finding it difficult to push past the $85 resistance level, which reminds us of how it stalled near $80 in 2025 following the geopolitical flare-up in the Strait of Hormuz. The market appears to be taking a breath after a strong run, weighing new tensions in the South China Sea against a robust economic outlook.
For derivative traders, the immediate focus should be on key technical levels, as a doji pattern is now forming on the daily chart, signaling uncertainty. We must watch the upward trendline support, currently near $83.50, with extreme caution. A break below this level could mirror the situation in 2025 and open the door for a deeper correction toward the 50-day moving average.
The broader market environment is also creating headwinds, with high US Treasury yields continuing to be a major factor. The 10-year note is holding steady around 4.5%, making non-yielding assets like silver less attractive for some capital. This, combined with a relatively firm US Dollar, could cap any immediate attempts to rally higher.
Industrial Demand Outlook
On the other hand, the fundamental picture for industrial demand is much stronger now than it was in 2025. The Silver Institute confirmed that global industrial offtake hit a new record last year, driven by massive investment in solar panel production and the electric vehicle market. This strong underlying demand provides a solid floor and may limit the extent of any potential sell-off.
We should also consider that the Gold/Silver ratio is currently sitting at 88:1, which is historically high and suggests silver may be undervalued relative to gold. Looking back, similar high ratios in the past, such as in early 2020, preceded strong upward moves in the silver price. This could present an opportunity for those positioning for a longer-term rebalancing between the two precious metals.
BNP Paribas reported China’s GDP growth at 5.0% year-on-year in Q1 2026, up from 4.5% in Q4 2025. It also put full-year 2025 growth at 5.0%, with a moderate slowdown expected in 2026.
The bank described a K-shaped pattern, with strong exports alongside weak domestic demand. It also pointed to an ongoing property crisis.
Policy Outlook And Market Backdrop
BNP Paribas said authorities are expected to keep fiscal and monetary policy supportive, but with modest measures. This is expected to continue even if the global environment becomes less supportive.
Deflationary pressures are expected to decline in 2026. BNP Paribas linked this to higher global energy prices and anti-involution measures introduced by the authorities.
The article said it was created with the help of an Artificial Intelligence tool and reviewed by an editor.
We see the confirmed 5.0% Q1 growth as evidence of a two-speed economy, creating clear opportunities for derivative traders in the coming weeks. This K-shaped recovery suggests pairing long positions on export-oriented industrial stocks with short positions on domestically-focused consumer discretionary sectors. This pattern is reminiscent of the divergence we saw in early 2025, when strong export data masked underlying weakness at home.
Trading Implications For Derivatives
The persistent property crisis continues to be the primary drag on the domestic economy, making put options on major real estate developers an attractive hedge. New home prices in China’s 70 largest cities fell by 0.5% month-on-month in March 2026, extending a decline that has been largely uninterrupted since mid-2024. Since authorities are only providing modest support, we do not expect a sharp reversal of this trend.
With deflationary pressures easing, we should consider call options on companies in the energy and materials sectors. The Producer Price Index (PPI) just posted its first positive year-over-year reading in February 2026, a significant change after being in deflationary territory for all of 2025. This shift suggests firms with pricing power, particularly those linked to global commodity prices, are set to benefit.
The conflicting economic signals will likely keep the yuan in a stable range against the US dollar. Strong exports provide support, but the weak domestic picture and cautious policy stance cap any significant appreciation. This environment is ideal for selling volatility, making a short strangle on USD/CNH options a viable strategy to generate income.