Japan’s industrial production surpasses forecasts with 1.6% growth, exceeding the expected 1.4%
Japan’s industrial production rose by 1.6% in October, surpassing the prediction of 1.4%. This increase suggests a growth trend in manufacturing, often viewed as a sign of economic improvement.
Traders and analysts will likely monitor how this data affects market sentiment and trading strategies. They will also watch other economic factors, such as central bank policies and global conditions.
Gold Steadies As Fed Signals A Second Rate Cut
Gold prices eased slightly on Friday but continued to hover near a seven-week high, buoyed by rising expectations that the Federal Reserve will maintain its easing cycle into next year.
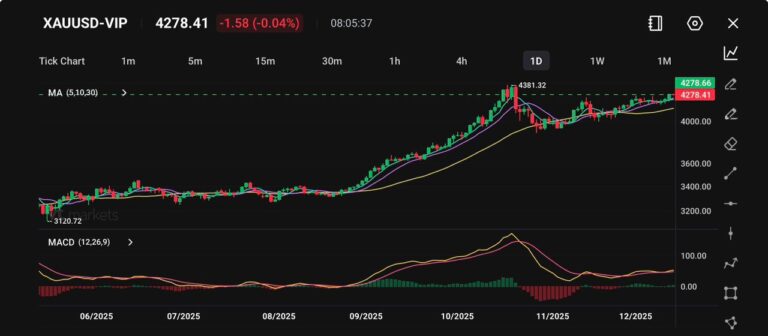
Spot gold slipped 0.3% to $4,278.41, pulling back modestly after reaching $4,381.32 on Thursday, its strongest level since late October. US gold futures mirrored the move, declining 0.3% to $4,302.10. Even so, bullion remains on course for an impressive weekly gain of around 1.8%.
The Fed’s 25-basis-point cut on Wednesday was accompanied by dovish remarks from Chair Jerome Powell, who reiterated a data-dependent approach while acknowledging that inflation is still somewhat elevated.
Although the dot plot indicates only one additional cut in 2026, markets continue to price in two.
Technical Analysis
Gold is holding firm just below record territory, trading at $4,278.41 with a very slight intraday decline of 0.04%. The setup remains constructive, with prices consolidating within a narrow band under the $4,381.32 high recorded in November.
Short-term moving averages (5-, 10-, and 30-day) continue to trend upwards in a bullish formation, and the recent daily closes above $4,270 suggest that buying interest is still strong.
The MACD histogram has turned green again, with the signal lines beginning to converge — hinting at a possible resurgence in bullish momentum.
Support is located around $4,200, with stronger support near $4,050, while resistance remains capped at the all-time high.
A clean break above $4,300 could open the door to a move towards the $4,450–$4,500 region. For now, the overall trend remains positive, with gold appearing to coil for another potential advance.
Cautious Outlook
With gold remaining resilient despite bouts of profit-taking, the near-term bias stays tilted to the upside. Should the Fed maintain its dovish tone and broader data continue to point towards a softening labour market, gold could attempt to retest the $4,380–$4,400 zone. However, a stronger-than-expected payrolls figure may postpone such a move.
A bullish trend in Dow Futures is expected to reach 49,900, based on wave developments.
Dow Futures (YM) is on an upward trend, aiming for the 49,900 level. The cycle from the low in April 2025 is developing nicely with a clear structure. Wave (4) ended at 45,810, as shown on the one-hour chart. After that, wave (5) kicked off a new sequence of five smaller waves.
Wave (i) climbed to 46,656, followed by a small pullback in wave (ii) to 46,165. The Index then rose in wave (iii) to 47,796, with a retracement in wave (iv) to 47,270. Finally, wave (v) pushed prices up to 48,184, marking the completion of wave ((i)) at a higher degree.
Elliott Wave Zigzag Decline
According to Elliott Wave theory, wave ((ii)) experienced a zigzag decline. After the peak of wave ((i)), wave (a) fell to 47,663, then wave (b) bounced back to 48,004. Wave (c) fell to 47,504, completing wave ((ii)). The Index then continued its upward movement in wave ((iii)). Starting from the low of wave ((ii)), wave (i) rose to 48,245, with a corrective pullback in wave (ii) ending at 47,859. The bullish cycle is expected to keep going as long as the low at 45,810 holds. The path for Dow Futures looks promising as it continues towards the 49,900 level, carrying on the impulse wave that began from the April 2025 low. The market structure appears bullish, and the recent drop to 47,504 likely marks the end of a minor correction. This indicates that the primary trend remains strongly upward as we approach the year’s end. Traders in derivatives should view this as a chance to buy on dips. Recent pullbacks, like the one to 47,859, are seen as entry points rather than signs of a reversal. Taking bullish positions, like buying call options or selling put spreads, during these corrective moments aligns with the ongoing upward trend.Economic Data and Market Outlook
This technical strength is backed by recent economic data. The jobs report for November 2025, released last week, showed unemployment steady at a healthy 3.8%, surpassing expectations and indicating a strong economy. This fundamental support boosts our confidence in the market’s ability to rise. Additionally, the latest Consumer Price Index report for November 2025 showed an annual inflation rate of 2.5%, confirming that inflation is moderating. This solidified market expectations that the Federal Reserve will keep interest rates steady through the first quarter of 2026. A stable rate environment is beneficial for stocks. The key level to watch is 45,810, the low of the larger wave (4) structure. As long as we stay above this point, the bullish outlook remains valid, and traders should stay optimistic. A drop below this level would prompt an immediate reevaluation of our entire bullish perspective. We can draw parallels between today’s market actions and the strong year-end rally we saw in late 2023. During that time, hints of a dovish Fed pivot also sparked a significant rise in stock prices. Given this historical context, we could see buying interest increase as we approach the holiday season. Create your live VT Markets account and start trading now.US Dollar Index hovers above 98, indicating weakness as investors expect more rate cuts
The US Dollar Index is struggling to stay above 98 as traders expect the Federal Reserve (Fed) to cut interest rates in 2026. Many believe the Fed will lower rates twice by October 2026, while the Fed itself projects only one cut by the end of that year. President Trump is calling for further rate reductions after a recent 25-basis point cut.
Right now, the US Dollar has dropped to a new low of 98.13, showing its weakness. This week, the Dollar fell against several major currencies, including a 1.15% decline against the Swiss Franc. Below is the heat map showing these changes, with the base currency listed in the left column and the quote currency at the top.
Focus on Nonfarm Payrolls Data
The US market is turning its attention to the upcoming Nonfarm Payrolls data for November. Important economic figures also on the horizon include Retail Sales and preliminary S&P Global PMI data for December. These reports will give key insights into the economy and can influence the US Dollar’s direction. The Federal Reserve meets eight times a year to decide on interest rates, which impacts the US Dollar. Tools like Quantitative Easing and Tightening can either weaken or strengthen the Dollar, depending on economic needs. With the US Dollar Index sitting close to a seven-week low around 98.13, we should brace for ongoing dollar weakness. The market is forecasting at least two rate cuts by the Federal Reserve in 2026, which is more aggressive than the single cut indicated by the Fed’s own projections. This difference, along with political pressure for lower rates from the White House, creates a negative outlook for the dollar. Recent data supports this view of a slowing economy, backing the market’s expectation of more rate cuts. The latest Consumer Price Index (CPI) for October 2025 dropped to 1.9%, below the Fed’s 2% target, suggesting that inflation is easing. Weekly jobless claims have also been rising, hitting a five-month high last week, indicating a softening job market ahead of next Tuesday’s key jobs report.Positioning Through Derivatives
In light of this outlook, using derivatives to prepare for a further decline in the dollar seems smart, especially with the November Nonfarm Payrolls data approaching. Buying put options on the US Dollar Index or related ETFs could be a good move to take advantage of a possible downturn. If the jobs numbers fall short of expectations, it could speed up the dollar’s decline and increase the value of these bearish positions. Focusing on specific currency pairs, the dollar’s weakness is most apparent against the Swiss Franc, which gained 1.15% this week. Traders might consider buying call options on pairs like EUR/USD and AUD/USD, or purchasing puts on USD/CHF to target this overarching dollar weakness. These strategies align well with the current trends shown in the currency heatmap. We’ve seen this disconnect between the market and the Fed before, particularly in late 2018 when traders correctly forecasted rate cuts for 2019 while the Fed continued to signal hikes. This historical pattern indicates that we should trust the market’s current pricing more than the Fed’s official projections. Therefore, positioning for a falling dollar in the weeks ahead seems to be the wisest approach. Create your live VT Markets account and start trading now.Rising demand and a weaker dollar boost silver prices, nearing record highs
Silver prices have risen to about $63.75 during the Asian trading session. This increase is fueled by a growing industrial demand and silver’s inclusion on the US critical minerals list. The price is also lifted by a weaker US Dollar and the possibility of future tariffs.
Demand for silver is climbing from sectors such as solar energy, electric vehicles, and artificial intelligence, with expectations for significant growth by 2030. Silver’s listing as a critical mineral in the US hints at potential tariffs that could limit its global availability, further enhancing long-term demand.
Recently, the US Federal Reserve cut interest rates by 25 basis points. This action weakened the Dollar, making silver more attractive to non-US investors. There is a 78% chance the Fed will maintain current interest rates next month, which could also increase silver’s appeal.
Investors often choose silver for its intrinsic value and as a safeguard during inflation. They typically trade it in physical forms or via Exchange Traded Funds (ETFs). Many factors affect silver prices, including geopolitical tensions, interest rates, and the performance of the US Dollar. Its industrial demand, especially in electronics and solar energy, can sway prices as it closely follows gold trends due to their shared safe-haven status.
With silver trading around $63.75, we could see a retest of the all-time high of $65.50 reached in May 2025. Current market activity looks strong, indicating that bullish positions could be favorable in the upcoming weeks. Traders should consider any small price dips as potential buying opportunities, thanks to the supportive economic factors.
The long-term demand for silver is becoming more robust, positioning it as more than just a precious metal investment. The US listing silver as a critical mineral is a key development that tightens global supply, as American warehouses fill up with inventory. Additionally, a reported 15% growth in demand from the solar panel industry in 2025 provides strong price support.
Monetary policy also benefits silver. The Federal Reserve’s recent rate cut to a 3.50-3.75% range is the second reduction in this easing cycle started in October 2025. A weaker dollar makes silver more affordable for investors holding other currencies, further enhancing its attractiveness.
In this environment, buying call options with strike prices above the $65.50 high could be an effective strategy to capitalize on a breakout. However, keep in mind that rising implied volatility makes options pricier. Using bull call spreads can be a cost-effective approach to express a bullish outlook while managing risk.
Silver is also outperforming gold, as the Gold/Silver ratio has decreased from over 85:1 early in 2025 to around 70:1 now. This trend indicates that pairs trading—going long on silver futures while shorting gold futures—could be a profitable strategy. This position would benefit from silver’s continued strength, driven by its unique demand in industrial applications.
West Texas Intermediate crude oil trades around $57.85 following the US capture of a Venezuelan tanker.
WTI Crude Oil prices rose above $57.50 during early trading in Asia, hitting around $57.85. This increase follows the US interception and seizure of a sanctioned oil tanker near Venezuela, heightening tensions and influencing WTI prices.
Impact of US Seizure
The US seizure may disrupt Venezuela’s oil exports as foreign shippers might approach with caution. While geopolitical unrest could temporarily support WTI prices, ongoing peace talks concerning Ukraine might limit further price increases. Efforts to resolve the Russia-Ukraine conflict aim to reduce energy uncertainties and improve supply stability. The Federal Reserve cut its benchmark interest rate by a quarter percentage point, targeting a range between 3.50% and 3.75%. This reduction could stimulate economic growth and increase oil demand, which would benefit WTI prices. The Fed plans just one more rate cut next year, affecting consumer borrowing costs. WTI Oil, which comes from the US, is known as “light” and “sweet” because it has low density and low sulfur content. Key factors that drive WTI prices include global supply and demand trends, political instability, OPEC’s decisions, and the value of the US Dollar. Inventory reports from API and EIA also affect prices by showing shifts in supply and demand. With WTI crude climbing above $57.50, attention is now on the geopolitical tensions arising from the US seizure of a Venezuelan tanker. This incident introduces a new risk to supply, putting upward pressure on prices in the short term. For those trading derivatives, this means increased short-term volatility, making short-dated call options a strategy to consider for capturing potential gains. However, we must also consider the overall supply situation. While Venezuelan oil production is significant, it has struggled for years and is currently around 850,000 barrels per day, a small part of the global total. The Energy Information Administration (EIA) recently confirmed that US-led non-OPEC supply is strong, which should soften the long-term effects of this disruption.Potential Impact of Ukraine Peace Deal
The chance of a Ukraine peace deal could significantly influence the market, possibly limiting this rally. Prices soared above $130 a barrel when the conflict began in 2022, and an end to the war would eliminate a large risk premium from oil prices. Any real progress on the 20-point framework might lead to selling pressure, making protective put options or bear put spreads wise hedging choices for long positions. The Federal Reserve’s recent rate cut supports oil demand, but their cautious outlook of just one anticipated cut in 2026 limits any bullish economic sentiment. This policy helps maintain a price floor by avoiding severe economic slowdown fears, but it is not strong enough to indicate a major increase in future oil consumption. This suggests that oil demand will remain steady rather than spectacular in the coming months. Additionally, we should note that US crude production is at record levels, near 13.3 million barrels per day, creating a natural cap on prices. Coupled with OPEC+ continuing its production cuts from its November 2025 meeting, this results in a delicate balance. Such dynamics suggest a range-bound market is more likely than a new trend, favoring strategies that benefit from defined price ranges, such as selling iron condors. Create your live VT Markets account and start trading now.The People’s Bank of China sets the USD/CNY rate at 7.0638, down from 7.0686
On Friday, the People’s Bank of China (PBoC) set the USD/CNY central rate at 7.0638, down from 7.0686 the day before. This change shows the PBoC’s commitment to keeping the exchange rate stable and supporting economic growth.
The PBoC’s key goals are to maintain stable prices and carry out financial reforms to strengthen the financial market. It is a state-owned bank influenced by the Chinese Communist Party Committee Secretary.
Policy Tools Used by PBoC
The PBoC employs several policy tools, including the seven-day Reverse Repo Rate, Medium-term Lending Facility, foreign exchange interventions, and the Reserve Requirement Ratio. The Loan Prime Rate is China’s key interest rate, impacting loans, mortgages, and savings. In China’s financial system, there are 19 private banks, a small number compared to state-owned banks. Notable examples include WeBank and MYbank, digital banks linked to Tencent and Ant Group. Since 2014, China has allowed fully private banks to operate in its state-dominated financial sector. The People’s Bank of China strengthened the yuan today, setting the reference rate at 7.0638 against the dollar. This indicates that the central bank either supports or encourages yuan appreciation. For traders, this stronger rate signals a limit on any short-term dollar strength against the yuan. Supporting data backs this move, with China’s exports in November 2025 showing a 1.7% year-over-year increase, the first rise in six months. This follows a third-quarter GDP growth of 4.9%, which slightly exceeded expectations, indicating that the domestic economy is stabilizing. These positive figures give the central bank more flexibility to support the currency’s strength without risking economic recovery.Market Implications and Trading Strategies
These policies fit into the global context, as markets now foresee a 75% chance of a US Federal Reserve rate cut by March 2026. A weaker dollar worldwide helps create a favorable environment for a stronger yuan. The dollar’s decline makes yuan-denominated assets more appealing. Looking back, this marks a significant change from the consistent yuan weakness seen through much of 2023 and 2024, when the rate was often above 7.25. The current drop below the 7.10 level suggests that the previous downward trend might be over. Traders should note that the policy landscape has shifted from a defensive stance to one of managed strength. In the coming weeks, selling out-of-the-money USD call options against the CNH could be a smart strategy to earn premium income. This central bank action is likely to lower implied volatility, indicating a clear intention to manage the exchange rate within a defined range. Betting on a sudden spike in USD/CNY contradicts this policy guidance. Traders holding long USD/CNY positions should consider hedging their risk. Opening new short positions in USD/CNY futures might also be advisable, following the clear direction from the PBoC. It’s usually unwise to oppose a central bank that is actively steering its currency in a specific direction, especially with improving economic data supporting its actions. Create your live VT Markets account and start trading now.The USD/CAD pair hovers around 1.3770, close to its lowest point since mid-September.
### Recent Declines in Oil Prices
The Canadian Dollar (CAD) is affected by several factors, including Bank of Canada interest rates, oil prices, the country’s economic health, inflation, trade balance, and the state of the U.S. economy. Changes in interest rates set by the Bank of Canada directly influence the CAD; when rates rise, the currency typically strengthens. Oil prices play a vital role because Canada exports a lot of oil. High inflation often leads to rate hikes, making CAD more attractive. Economic indicators like GDP and employment also greatly impact the CAD’s value.
The outlook for the USD/CAD exchange rate is likely to continue its downward path into early 2026, as it hovers around the 1.3770 mark. The main reason for this is the differing policy approaches between a weakening U.S. Federal Reserve and a more determined Bank of Canada. This situation suggests that strategies favoring a stronger Canadian dollar, like purchasing put options on the USD/CAD pair, may be wise in the next few weeks.
The Fed’s cautious position has been backed by recent data. The U.S. Consumer Price Index for November 2025 was lower than anticipated, coming in at 2.8% year-over-year. This has increased market expectations, with federal funds futures indicating a greater than 70% chance of a rate cut by the end of the first quarter of 2026. This trend continues to pressure the value of the U.S. dollar.
### Canada’s Economy Shows Persistence
On the other hand, Canada’s economy is showing resilience. The latest Labour Force Survey revealed that the country added an impressive 45,000 jobs last month. This strong employment number gives the Bank of Canada less reason to indicate upcoming rate cuts, making the Canadian dollar relatively more appealing. We believe the policy difference between the two central banks will be the key theme for the currency pair.
A significant risk to this outlook comes from recent drops in crude oil prices, which could hurt the commodity-linked loonie. WTI crude oil has struggled to stay above $75 per barrel, a significant decrease from earlier highs in 2025. This could limit the Canadian dollar’s rise and introduce volatility, making risk-defined options strategies, like put spreads, a better choice than directly shorting futures.
Looking back at the 2014-2016 period, we see how a sharp drop in oil prices can severely pressure the Canadian dollar, often outweighing other influences. This history indicates that while the differing policies of central banks are influential, a sustained downturn in energy markets can still restrict the loonie’s strength. Therefore, traders should closely monitor upcoming oil inventory data and OPEC+ announcements.
Create your live VT Markets account and start trading now.
NZD/USD pair exceeds 0.5800 in early Asian session following US employment data
NZD/USD reached about 0.5815 in early Friday’s Asian session. This rise followed weaker-than-expected US jobless claims, which increased to 236,000, while Business NZ’s PMI for November was reported at 51.4.
The US Dollar (USD) showed weakness against the New Zealand Dollar (NZD) largely due to the rise in jobless claims. Additionally, the Federal Reserve lowered its benchmark interest rate to a target range of 3.50% to 3.75%.
Central Bank Policies
In New Zealand, the Reserve Bank of New Zealand (RBNZ) recently cut the Official Cash Rate to 2.25%. The central bank mentioned that future rate changes will depend on the economy and inflation, which could help the NZD maintain its strength against the USD. The value of the NZD is influenced by New Zealand’s economic performance and central bank policies. Key economic releases and the state of the Chinese economy are also important due to trade connections. The RBNZ aims for inflation to stay around 2%, adjusting interest rates as needed. Differences in rates between New Zealand and the US also affect the NZD/USD exchange rate. Economic data plays a crucial role in determining the NZD’s value. Strong economic reports can attract investment and potentially lead to higher interest rates. Market sentiment also influences the NZD. It tends to strengthen during positive market periods and weaken during uncertain times. The recent rise in US weekly jobless claims to 236,000 is a clear sign that the US labor market is weakening, which supports the Federal Reserve’s recent rate cut. This unexpected dip in the USD is a key reason why NZD/USD has pushed above the 0.5800 level. We believe that the weakness of the dollar will be a major theme in the immediate future.Market Outlook
The job data, along with core inflation staying steady at around 2.8% for the last quarter, gives the Fed little reason to change its dovish approach. Looking back at the aggressive rate hikes of 2022-2023, the current environment shows a noticeable policy divergence that is unfavorable for the dollar. We expect the greenback’s path to be stable or dropping. On the other hand, the Reserve Bank of New Zealand seems to have ended its rate cuts, keeping rates steady at 2.25%. Strong domestic PMI figures indicate that the New Zealand economy is doing well despite global challenges, creating a positive interest rate outlook for the Kiwi compared to the USD. External factors also support the NZD. For example, recent data shows strong industrial production in China, boosting confidence for its trading partners. Additionally, the Global Dairy Trade index has consistently risen over the past six months, with whole milk powder prices up over 15% since June 2025. This trend is beneficial for New Zealand’s export-driven economy and its currency. For derivatives traders, this situation suggests a bullish outlook for NZD/USD as we approach early 2026. Strategies such as buying call options with strikes around 0.5850 or selling cash-secured puts below the 0.5800 support level may be appealing. Keep in mind that the recent data shock could raise near-term implied volatility, leading to higher option premiums. Watch upcoming US data to determine whether this labor market weakness is temporary or the start of a longer trend. Any rallies in the US Dollar Index, which has struggled to stay above 102.50, could present opportunities to position for further Kiwi strength. Current trends suggest that testing earlier highs from this quarter may happen soon. Create your live VT Markets account and start trading now.The AUD/USD pair stays stable above the mid-0.6600s, approaching a three-month high in trading.
The AUD/USD pair is drawing new buyers after mixed Australian jobs data, staying stable above the mid-0.6600s. It is near a three-month high, supported by the Reserve Bank of Australia’s (RBA) strong stance and a positive market mood.
The US Dollar is under selling pressure due to expectations of a dovish Federal Reserve, with traders expecting two rate cuts next year. This positive market environment helps the Australian Dollar. The RBA’s decision to hold rates and consider future hikes bolsters the AUD.


