

For decades, the United States borrowed freely, supported by global confidence in its Treasury bonds and the strength of the US dollar. However, that confidence is beginning to show cracks. With national debt exceeding $36 trillion and interest payments rising sharply, borrowing costs have moved from the sidelines to centre stage, prompting markets to take notice.
Currently, the US government pays an average interest rate of 3.289% across its debt portfolio, comprising short-term bills, medium-term notes, and long-dated bonds. While that figure may not seem alarming in isolation, it takes on new significance when viewed alongside the broader picture: total debt has reached $36.18 trillion, compared with a GDP of approximately $29.18 trillion. A 1% increase in interest rates now adds over $360 billion annually in servicing costs.
Interest payments have become far more than a footnote in the federal budget—they’re beginning to rival core programmes such as defence and Medicare. In fiscal year 2024, interest expenditure accounted for 3.0% of GDP, closing in on the 3.2% high recorded in 1991. The Congressional Budget Office (CBO) forecasts this figure will rise to 4.1% by 2035 under existing legislation. Should average rates climb to 5.8% by 2054, the debt-to-GDP ratio could balloon to 217%—a full 50 percentage points above the current baseline estimate.
These projections aren’t just hypothetical. If the 10-year Treasury yield remains above 6%, annual interest costs could swell to $2.1 trillion, or roughly 7% of GDP. Many economists view a 5% interest cost threshold as a serious warning sign, where debt servicing begins to crowd out essential government expenditure and borrowing becomes necessary simply to cover interest—often a harbinger of a debt spiral.
Lessons from History
History provides useful context. In the 1980s, the Federal Reserve raised interest rates aggressively to combat inflation, and 10-year yields surged past 10%. However, debt levels were relatively modest, around 30% of GDP, so the economy absorbed the impact. By the 1990s, as debt rose to 50% of GDP, growing interest costs forced politicians to pursue budget reforms, resulting in a brief return to fiscal discipline.
From 2010 through 2021, historically low interest rates created a false sense of security. The US could accumulate more debt without facing immediate consequences. As the Fed tightens policy, the real cost of borrowing is coming into focus, and the financial pressure is mounting.
Domestically, the US retains some flexibility. Roughly 70% of its debt is held by domestic investors, including the Federal Reserve, which adds a degree of stability. Still, over-reliance on internal buyers can crowd out private investment. Should the Fed resume large-scale Treasury purchases, it risks re-stoking inflation and undermining the dollar. It is an effective short-term solution during the pandemic, but unsustainable in the long run.
What if yields continue rising? If the 10-year Treasury breaches 5.5%, fiscal pressures become more urgent. A future Trump-led administration, possibly influenced by figures like Scott Bessent, might consider measures such as spending freezes, tax changes, or even debt restructuring. Extending bond maturities to lock in rates is one option, so is generating revenue via tariffs or encouraging capital repatriation. However, these approaches carry significant risks and rely heavily on maintaining market confidence.
Bessent contends that strong GDP growth could ease fiscal burdens by raising tax revenues. While plausible, this argument falters if interest rates remain elevated or if inflation continues to bite. Markets will demand meaningful reform, not just optimistic forecasts.
What Lies Ahead?
All of this has direct implications for financial markets. Higher yields make equities less attractive by increasing discount rates to future earnings. Should interest rises above 5% of GDP, risk assets may face deeper corrections. Equity valuations, especially in growth sectors, will likely need to adjust to a more expensive capital environment.
The US dollar faces a delicate balancing act. Elevated yields may attract short-term inflows, but if debt sustainability is questionable, capital could quickly exit. A weakening dollar would lift import prices and reintroduce inflationary pressures, precisely the outcome the Federal Reserve is keen to avoid.
The takeaway is clear. The US can still service its debt, but the margin for doing so without consequence is narrowing. Fiscal policy is no longer a distant concern. It’s now a key market driver. With crucial inflation and GDP figures due this week, investors are poised to test that premise.
Market Movements This Week
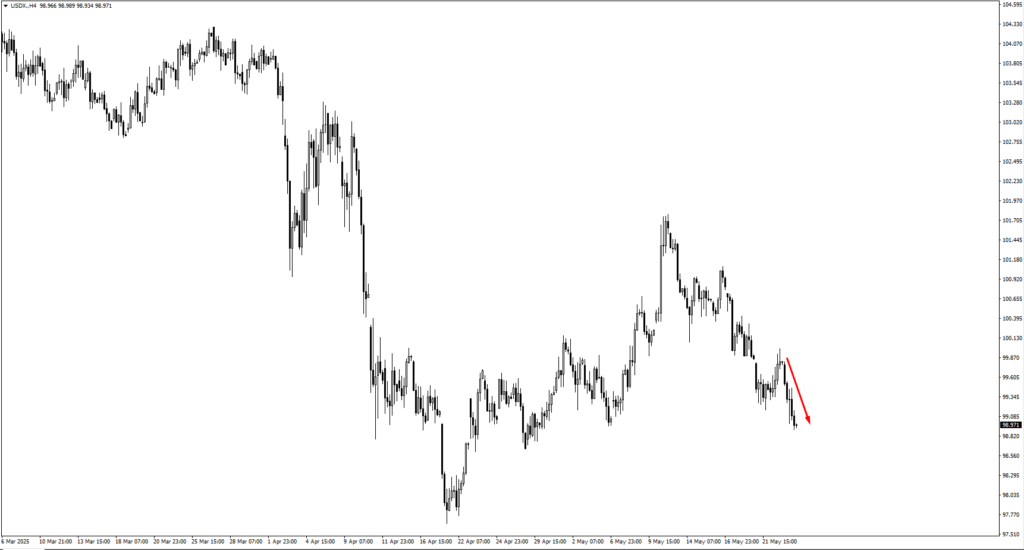
The US dollar index (USDX) continued to retrace from the 100.15 region, a monitored supply zone that has acted as resistance before. Prices pushed lower toward the 98.30 support level. With the dollar caught between yield appeal and structural doubts, a test of 98.30 may prove decisive. If support holds, the dollar could see a technical bounce. If broken, the path toward deeper correction would open, especially if bond yields soften or inflation surprises to the downside.
EUR/USD rallied cleanly from 1.1240, a key support area in the previous sessions. Traders will now be watching the 1.1470 level. Momentum remains cautiously bullish in the pair, with structural strength supported by weaker dollar expectations. However, further upside may require confirmation from Thursday’s US GDP and Friday’s Core PCE release. A softer print could reinforce the breakout structure, while a surprise to the upside may introduce volatility.
GBP/USD extended its bullish move this week. As the price climbs, attention turns to potential resistance zones at 1.3595 and 1.3670. Given the pair’s sensitivity to interest rate guidance, Friday’s speech by BOE Governor Bailey could trigger a technical reaction. Traders are advised to watch for signs of bearish reversal near these levels, especially if the dollar finds temporary support or if UK inflation commentary shifts tone.
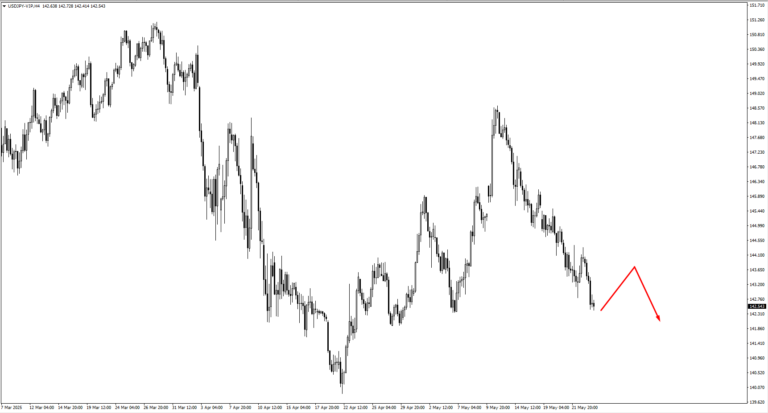
USD/JPY remains range-bound, with price approaching resistance at 143.30 and 143.80. These levels will likely serve as inflection points. A gradual move higher, followed by bearish reversal patterns, could indicate short opportunities, though a sharp, yield-backed rally would suggest caution for sellers.
USD/CHF edged lower but stopped just short of key support at 0.8330. On the rebound, resistance at 0.8255 and 0.8280 may attract bearish attention. The strength of the move into these levels will determine whether selling setups have sufficient edge.
AUD/USD is now trading near monthly highs. The pair has been supported by rising commodity demand and a broadly softer USD. If the market consolidates at these highs, the 0.6460 zone becomes important for fresh bullish price action setups. Bulls will want to see a controlled pullback into that region, followed by confirmation before reengaging.
NZD/USD has broken out of its range. If it pauses to consolidate, 0.5950 will be a level to watch for bullish price action. The Reserve Bank of New Zealand’s upcoming cash rate decision could inject volatility midweek. Traders should be cautious ahead of that release, especially if the pair trades aggressively into resistance without consolidation.
USD/CAD slid just beneath the 1.3920 resistance zone. If the pair retraces higher in the coming sessions, 1.3810 becomes a likely area for bearish setups. The loonie remains sensitive to oil price dynamics, so crude movement may further influence the direction of this pair.
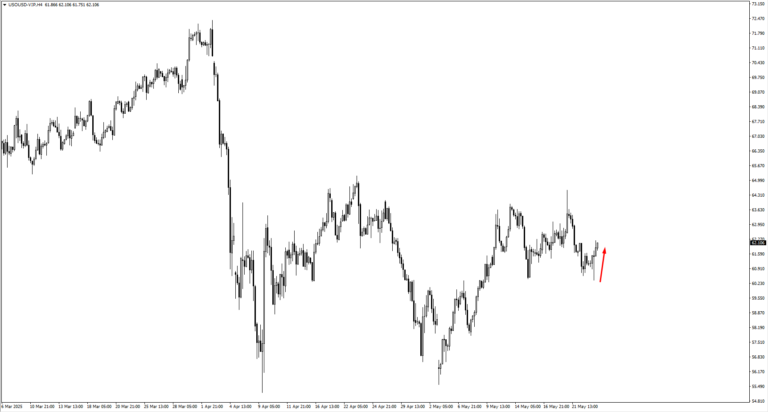
Commodities saw notable movement, with crude oil (USOil) rising sharply from support near 60.20. A break above the 64.534 level could confirm a new bullish leg. However, signs of stalling beneath this resistance may suggest the trend is losing steam.
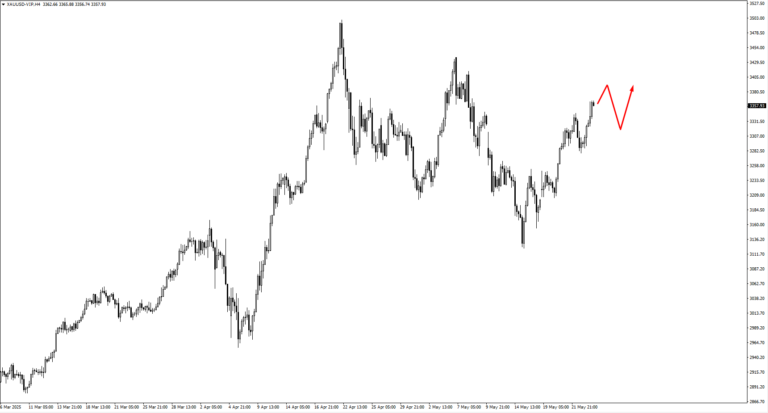
Gold climbed higher this week, ignoring the previously monitored 3220 level on its way up. Now, traders eye the 3400 resistance zone. If price reaches this level and begins to retrace, the 3305 area could provide a new staging ground for bulls to re-enter. Any retest of that level would need to show clear bullish price action, especially in response to inflation data on Friday.
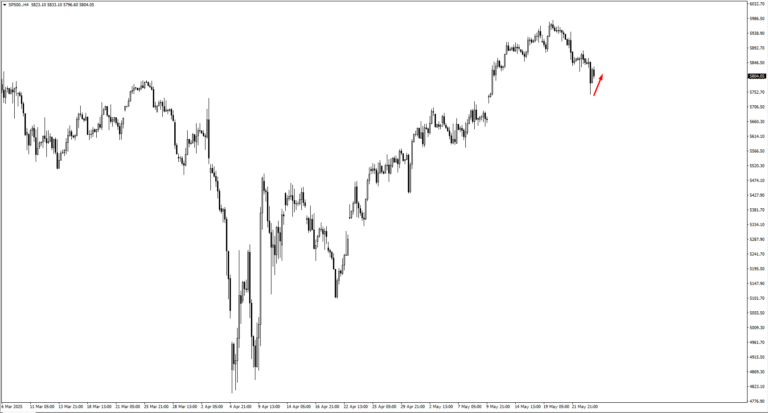
The S&P 500 continues to recover, pushing up from the 5740 zone. If price pulls back again, 5690 would be the key level to watch for fresh bullish setups. A clean move higher could bring 6100 into view as the next target. However, rising Treasury yields and policy noise could make gains harder to sustain. Traders should stay adaptive.
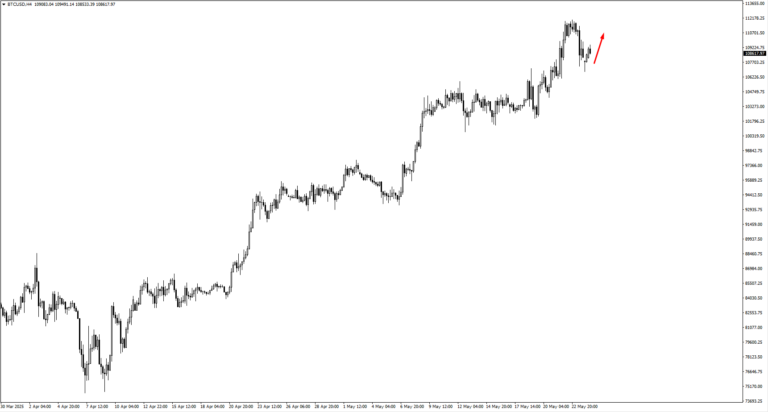
Bitcoin remains elevated, with resistance zones at 113,500 and 123,000 under watch. While institutional demand and risk-on sentiment provide support, price action remains overheated. Patience and confirmation will be essential for those chasing further highs.
Key Events This Week
Wednesday, May 28, brings the first real event of the week. The Reserve Bank of New Zealand is expected to cut its official cash rate from 3.50% to 3.25%. If NZD/USD hasn’t already broken the 0.60238 high earlier in the week, the release could spark a retracement. If the breakout is confirmed, a dovish tone from the RBNZ could accelerate the next leg lower. Either way, traders are watching closely for a clean reaction before stepping in.
On Thursday, May 29, attention turns to the US Preliminary GDP data. Forecasts expect -0.3%, the same as last quarter. It won’t surprise the market, but internal details, especially consumer spending and business investment, could set the tone for Friday’s inflation print. Traders are likely to stay cautious, letting prices digest the number before making big directional bets.
Friday, May 30, is the big one. Bank of England Governor Andrew Bailey speaks in the early session. With GBP/USD testing resistance near 1.3595–1.3670, his tone could make or break a breakout. A hawkish lean might push the pound higher, while a dovish or measured tone may send it back down into range.
Later, the US Core PCE Price Index is released. Forecasted at 0.10%, up from 0.00%, the reading could rekindle concern about sticky inflation. If the number beats expectations, Treasury yields could rise again—and with them, the dollar. Equities, especially growth names, may struggle to hold gains into the weekend.
Finally, China’s Manufacturing PMI drops into the late session, with a forecast of 49.5, just above the previous 49.0. Still below the 50.0 expansion line, the data may weigh on sentiment if it underperforms. Traders watching AUD and NZD will be vigilant for signs of a slowdown in Chinese demand.
It’s a week that starts slow and ends with pressure. For traders, patience will be key. The best opportunities may come late, after the dust settles from a data-heavy Friday.
Create your live VT Markets account and start trading now.


