

On 12 August, Bitcoin hit a record high of $124,492, only to fall back sharply to $107,340 by the end of the month.
Such dramatic reversals are nothing unusual for Bitcoin. The asset has always moved in cycles of euphoric surges followed by steep corrections, often flushing out excess leverage before testing just how firmly investors remain committed.
Liquidity Still Flowing
Liquidity conditions remain supportive. Between November 2024 and August 2025, over $67 billion in new stablecoins entered circulation across USDT, USDC, and EURC.
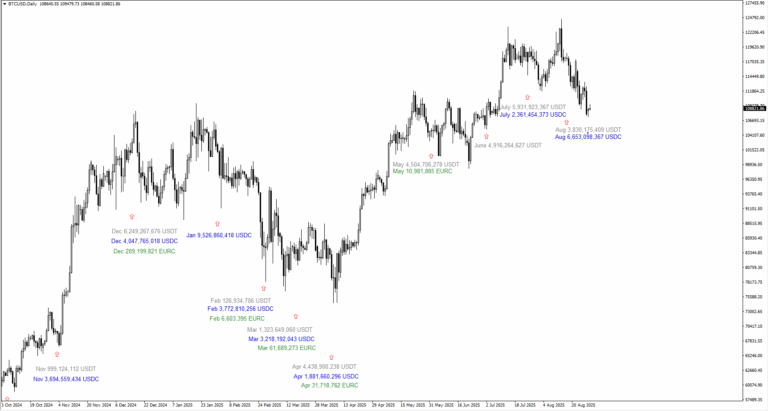
December 2024 alone added $10 billion, followed by $9.5 billion in January, while July and August combined delivered another $18 billion.
By late August, stablecoin supply had reached fresh records: USDT $167.3 billion, USDC $70.6 billion, DAI $5.4 billion, and FDUSD $1.45 billion – totalling close to $245 billion. Smaller issuers push the total above $275 billion.
This stockpile of liquidity is ‘dry powder’ that could be redeployed into Bitcoin when sentiment improves.
Institutions remain the other driving force. July was particularly strong, with US spot Bitcoin ETFs attracting $6 billion of inflows and crypto ETFs as a whole securing $12.8 billion – a record. This helped propel Bitcoin through the $120,000 barrier.
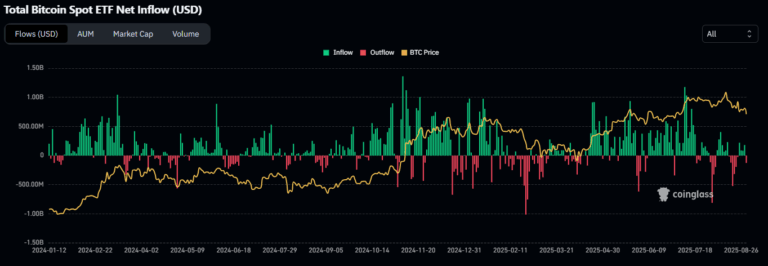
But August reversed the trend. Spot ETFs saw heavy outflows, including a single-day redemption of $2.6 billion from BlackRock’s IBIT, pulling Bitcoin down by $16,000.
The picture is one of timeframes. Daily ETF flows are erratic, monthly flows steer momentum, and cumulative flows define the long-term trajectory. Despite August’s setback, net institutional buying for 2025 remains intact.
The outlook is cautious: more withdrawals are possible if volatility stays high, yet the broader current still favours accumulation rather than abandonment.
Seasonal Trends Suggest Q4 Strength
Bitcoin’s seasonal pattern points to resilience in the final quarter. Historically, August and September have been weak, while October and November usually deliver strong gains.
On average, October has returned more than 20%, and November over 40%. With August already in the red, the pattern holds. If Bitcoin can ride out September without breaching support, conditions favour another rally into year-end.
Still, history only rhymes – it doesn’t guarantee repetition. Broader macroeconomic forces could always disrupt the seasonal narrative.
At present, Bitcoin is grappling with the $110,000 barrier, now acting as resistance after previously serving as support. Liquidity data shows strong selling pressure clustered between $109,000–110,000, as trapped longs seek to exit.
On the downside, liquidity pockets build up at $108,000 and $107,000. A move above $110,000 could restore momentum, while failure might send prices towards $105,000 or lower.
Traders Prepare For Volatility
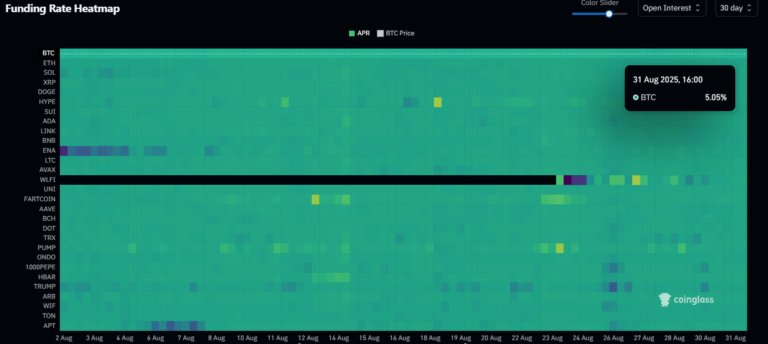
Market sentiment has cooled, but not collapsed. The Fear and Greed Index stands at 40, signalling caution rather than panic. Perpetual futures funding rates are only marginally positive, suggesting modest long positioning but no overheating.
This is the anatomy of a reset: excess optimism has been flushed, leverage cut back, but no full capitulation. It leaves room for stabilisation, though also signals hesitancy as traders wait for clearer signals.
August has tested conviction, but the cycle’s pillars remain: ample liquidity, positive net institutional flows, and favourable seasonal trends into year-end.
The key question now is whether Bitcoin can defend the $107,000 level and reclaim $110,000. Success could set the stage for another test of $124,000 before 2025 ends; failure risks a slide towards $105,000.
Market Movements Of The Week
The new week opens with the US Dollar Index locked in a holding pattern. Prices have lingered around the same area since Friday, showing little appetite for a decisive move.
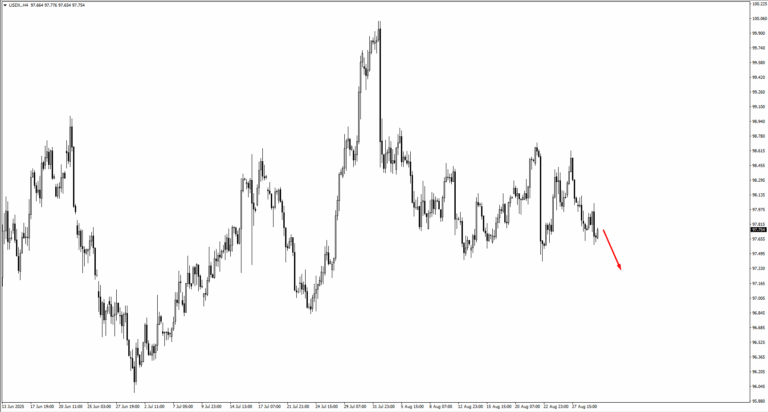
Traders are watching the 97.409 swing low, a level that, if broken, could pull the index lower toward 97.35.
For now, the lack of momentum signals indecision, but any sharp shift in data or sentiment may push the dollar out of its narrow corridor.
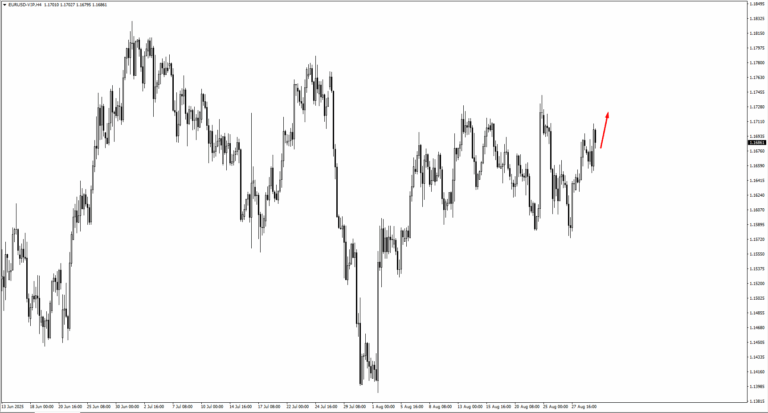
In Europe, the single currency mirrors the dollar’s pause. EURUSD trades close to Friday’s levels, though the charts suggest that a lift toward 1.1755 would be the next zone to monitor.
Sterling also sits in a pivotal position. GBPUSD dipped but failed to crack through 1.35435. If buyers step in and drive it higher, the 1.3555 mark becomes the line to watch for signs of strength.
Across the Pacific, USDJPY drifts lower, and eyes are set on whether 146.208 will give way. A break beneath that level could invite deeper downside.
USDCHF also trends down, with traders marking 0.7960 as the key checkpoint.
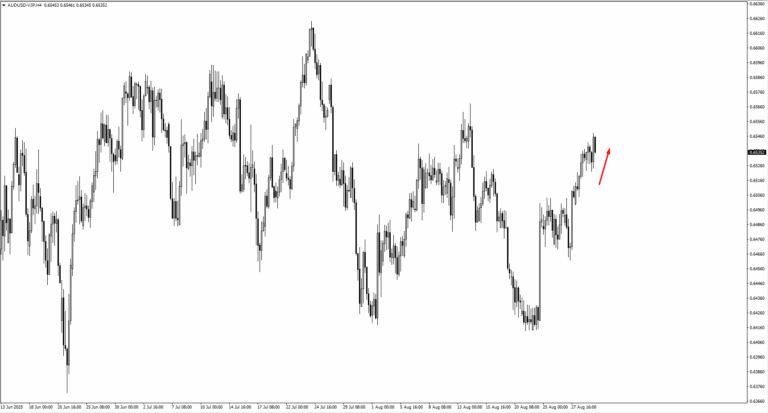
The Australian dollar is testing nerves at 0.6550. Sellers have held ground here, but if the price edges upward, 0.6570 offers the next area of interest. New Zealand’s dollar is climbing instead, with 0.5920 as its near-term target.
North America tells a mixed story, as USDCAD trades around 1.3735. Consolidation is evident, and should the pair slip lower, the 1.3700 handle could come into play.
Commodities, meanwhile, are showing more rhythm. Oil appears to be consolidating after recent swings. Traders have an eye on 66.45, where bearish price action could reassert itself should prices rise.
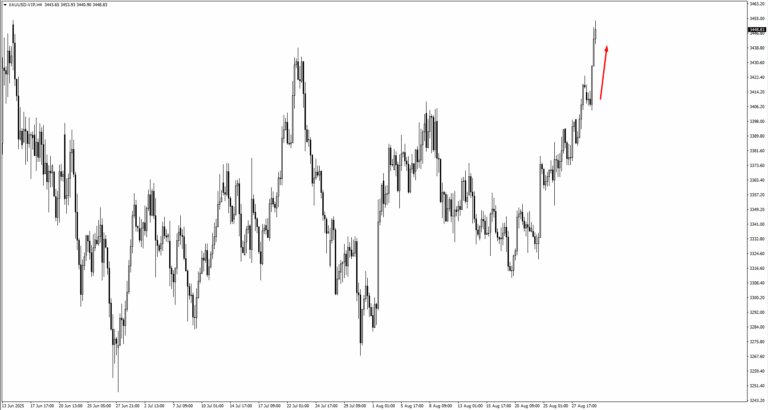
Gold, by contrast, has found traction. After pausing around 3,420 dollars, it pressed higher, with the next challenge set at 3,470 dollars.
Silver continues its own march upward, with momentum favouring the bulls. If a consolidation phase emerges, the 38.75 level will serve as the staging ground for the next push.
Natural gas is also climbing, having rebounded from 2.80. The market now leans toward testing 3.04. Energy traders will be alert to whether this move holds or fades under fresh supply pressures.
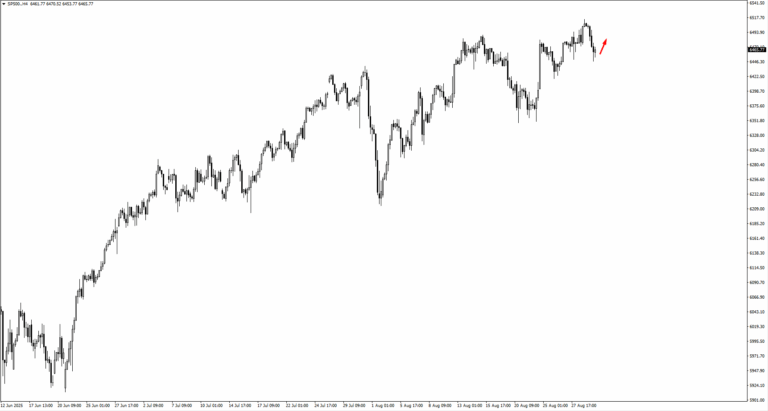
In equities, the S&P 500 retreated from the psychological 6,500 mark before settling. If it manages to rise again, traders are watching the 6,485 area for the quality of price action. A close above 6,497 could open the path to 6,630 or even 6,730.
Nasdaq tells a similar tale. It slipped from 23,780, but the focus now shifts to 23,600. Should it close above 23,700, momentum would likely swing back to the upside.
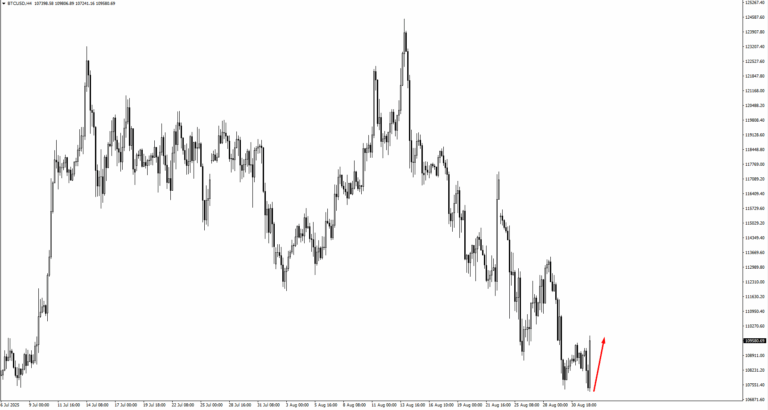
Bitcoin holds the spotlight among digital assets. It found footing at 107,245 but remains fragile. If the price makes a lower low, the market will eye 105,700 and even 101,400 as the next potential landing spots.
Ethereum has its own test ahead, with the 4,585 mark acting as the key pivot for traders seeking confirmation of renewed strength.
Among individual stocks, UnitedHealth shows potential consolidation. If support holds, bulls may look to 270 for a fresh entry, with intrinsic value estimates climbing as high as 410 on recent earnings.
Novo Nordisk, trading above 55.37, also signals the possibility of a fresh leg higher. Analysts now place its intrinsic value around 90, suggesting that investors still see more room in its climb.
The week is set against a backdrop of fragile confidence. Many assets hover around support or resistance, waiting for data or sentiment to tip the balance.
Key Events Of The Week
Activity starts to pick up on Tuesday, 2 Sep, when the US releases its ISM Manufacturing PMI. Forecasts point to a reading of 48.9, slightly higher than July’s 48.0.
Wednesday, 3 Sep, brings a pair of releases that could move different corners of the market. Australia’s GDP is expected to show growth of 0.5 percent quarter-on-quarter, an improvement over the previous 0.2 percent. In the US, JOLTS Job Openings are projected at 7.24 million, down from 7.44 million. The labour market remains a focal point for traders and policymakers alike.
Thursday, 4 Sep, shifts attention back to US services, with the ISM Services PMI forecast at 50.5 compared to the previous 50.1. This sits just above the expansion line and could reinforce the picture of an economy slowing but not yet stalling. Traders will be watching whether the reading provides relief for the dollar or continues to paint a cautious outlook.
Friday, 5 Sep, closes the week with the headline jobs report. Non-Farm Employment Change is expected at 74,000, just above the prior 73,000. The unemployment rate is forecast to tick up to 4.3 percent from 4.2 percent. Together these figures underline a gradual softening in the labour market.


