

Key Takeaways Here
- Policymakers appear to be assuming the oil shock tied to the Iran conflict will eventually fade, allowing growth to remain firm and inflation to normalise.
- That assumption is now the market’s biggest risk. If energy prices remain elevated, the Fed may be forced into a longer, higher-for-longer stance.
- The biggest market risk is a policy mismatch: stronger growth forecasts, higher inflation projections and continued rate-cut guidance do not sit comfortably together.
- Leadership uncertainty around Jerome Powell and the expected arrival of Kevin Warsh adds another layer of policy and market tension.
- This week’s focus is on whether price action across the dollar, oil, gold, equities and crypto confirms a deeper macro repricing.
The Federal Reserve is trying to hold together a narrative that is becoming harder for markets to accept.
At the March 2026 FOMC meeting, officials voted 11–1 to keep the benchmark rate unchanged at 3.50% to 3.75%. On the surface, that looked like a steady and measured outcome. The median dot still points to one rate cut in 2026.
But the details told a more cautious story.
Chair Jerome Powell acknowledged two immediate problems. Inflation data had already been running firmer than expected before the Iran conflict intensified, and the geopolitical backdrop now makes the path forward
even less predictable. The Fed lifted its 2026 PCE inflation forecast to 2.7%, up from 2.4% in December, while also signalling that it is too early to fully measure the economic damage from the war and the associated supply risks around the Strait of Hormuz.
That leaves markets with an uneasy question: if inflation is moving higher and geopolitical risk is rising, why is the Fed still trying to keep rate cuts alive?
A Dot Plot That Looks Stable But Feels Less Dovish
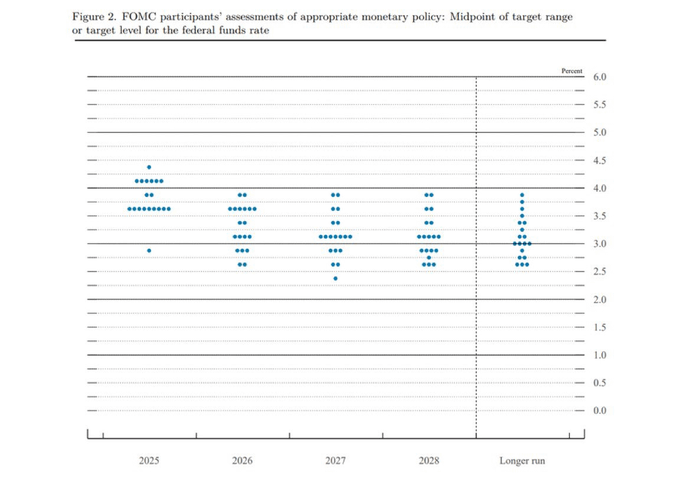
Federal Reserve ‘dot plot’ (Courtesy: Federal Reserve)
The median projection still suggests one cut, but the internal shift was more important than the headline.
Powell said that four or five members moved their projections from two cuts to one, showing that the centre of the committee has shifted toward more caution. In other words, the dot plot did not collapse, but it did become less dovish.
That matters because markets tend to react first to the headline, then slowly catch up with the distribution underneath it.
The Fed is effectively telling markets that inflation remains sticky, oil risk is real, and uncertainty is elevated, yet some degree of policy easing is still possible later in the year. That only works if the energy shock fades and broader price pressures cool again.
For now, that looks more like an assumption than a conclusion.
Contradiction In The Growth Forecast
The latest Fed message not only suggests an inflation upgrade, it appears officials also lifted their 2026 GDP growth forecast to 2.4%. That creates a tension at the heart of the macro outlook.
If the Iran conflict is serious enough to raise inflation expectations and threaten energy markets, then forecasting stronger growth at the same time implies a very benign view of how temporary the shock will be.
The Fed appears to be betting that US demand can absorb higher energy costs without a meaningful hit to momentum. That may prove right, but it is a narrow path.
If oil remains elevated, the economy could slide toward a more stagflationary setup where inflation stays firm while growth deteriorates. In that environment, the projected rate cut would become even harder to justify.
Higher For Longer Quietly Becomes The Base Case
The market may still focus on the headline of “one cut,” but the deeper signal from the meeting is that higher for longer remains the dominant policy bias.
The Fed does not want to sound overly hawkish while markets are already dealing with war risk and fragile sentiment. But its own projections are moving in that direction. If inflation remains sticky and oil does not retreat, that single projected cut may disappear altogether.
That is why this week’s cross-asset price action matters so much. Markets are now testing whether the Fed’s optimistic balance between growth, inflation and easing can still hold.
Leadership Transition Adds Another Risk Layer
The macro picture is further complicated by leadership uncertainty inside the Fed.
The upcoming arrival of Kevin Warsh in June introduces a political and policy dimension that markets cannot ignore. Warsh is widely perceived as more supportive of lower rates, but he may be stepping into an environment where the inflation backdrop leaves very little room for early easing.
Political friction surrounding DOJ subpoenas and Senate confirmation dynamics could keep Powell in place longer than expected, delaying a clean leadership transition. That uncertainty could matter for market psychology, especially if traders begin to price not just the next move in rates but also the next policy-making regime.
In practice, Warsh may inherit a Fed that remains trapped in a higher-for-longer framework, regardless of his personal policy preferences.
Is The Fed Losing The Plot?
Under standard macro logic, when growth forecasts rise and inflation projections rise, the case for cutting rates becomes weaker, not stronger. Holding steady makes sense. Signalling that even one cut becomes much more debatable.
The Fed has acknowledged uncertainty from the Iran conflict, admitted inflation pressures have already intensified and still kept alive the idea of future easing. That combination is what makes the latest outlook feel unstable and even frivolous.
The more charitable interpretation is that policymakers are trying to avoid overreacting to what they still view as a temporary geopolitical shock. The harsher interpretation is that the Fed is trying to preserve market calm while the internal logic of its projections is becoming increasingly difficult to defend.
Either way, traders should pay less attention to the median dot alone and more attention to the committee’s direction. The broader message is that officials are drifting toward fewer cuts, more caution and less conviction in the disinflation story.
Upcoming Events
24 March 2026
1. US/UK/EUR Flash PMIs
First meaningful read on whether war risk and higher energy costs are starting to hit activity.
25 March 2026
1. JP CPI (February), Previous: 1.50%
A hotter inflation print could revive BOJ tightening expectations and make any fresh upside in USDJPY more sensitive.
2. US Import and Export Prices
A useful second-tier inflation check. If import prices stay firm, it adds to the view that the Fed may have to stay cautious even while still projecting a cut.
26 March 2026
1. US Initial Jobless Claims, Forecast: 211K, Previous: 205K
Labour-market resilience would reinforce the Fed’s cautious stance and keep the dollar supported. A softer claims trend could ease some of the pressure on risk assets.
For a full view of upcoming economic events, check out VT Markets’ Economic Calendar.
Key Movements Of The Week
This week is less about what the Fed said and more about whether markets believe it. For markets, the Fed’s latest message reinforces a fragile cross-asset setup.
- US dollar may stay firm if the Fed’s underlying hawkish shift becomes more visible through rates pricing.
- Oil remains central. As long as geopolitical risk keeps energy markets tight, inflation expectations stay vulnerable to another move higher.
- Gold may remain supported by policy uncertainty, geopolitical stress and doubts about the durability of real disinflation.
- Equities could struggle if investors begin to accept that rate cuts may not arrive as easily as previously expected, especially if growth optimism starts to fade.
- Risk assets more broadly, including crypto, may face a tougher backdrop if the market begins to price a longer period of restrictive policy into an already uncertain macro environment.
Key Symbols to Watch
USDX || CL-OIL | USOUSD | SP500 |
USDX
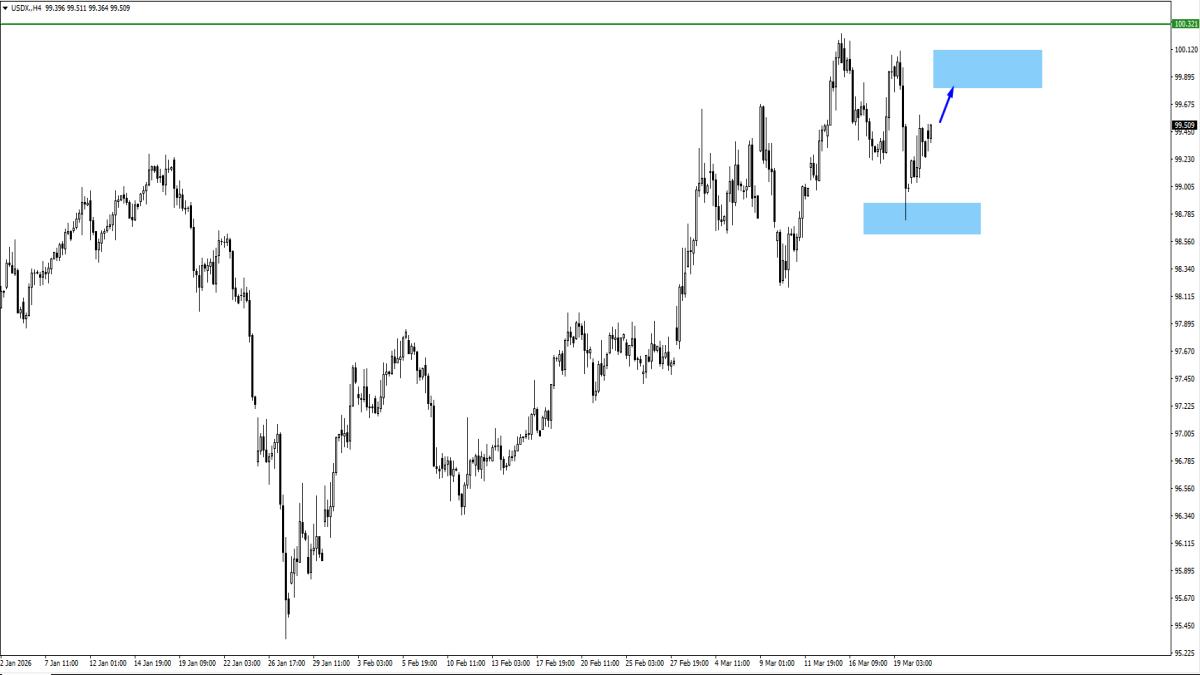
Watch this week
- Resistance focus near 100.00.
- Rejection there may trigger consolidation.
- Acceptance above it would strengthen the higher-for-longer narrative.
EURUSD
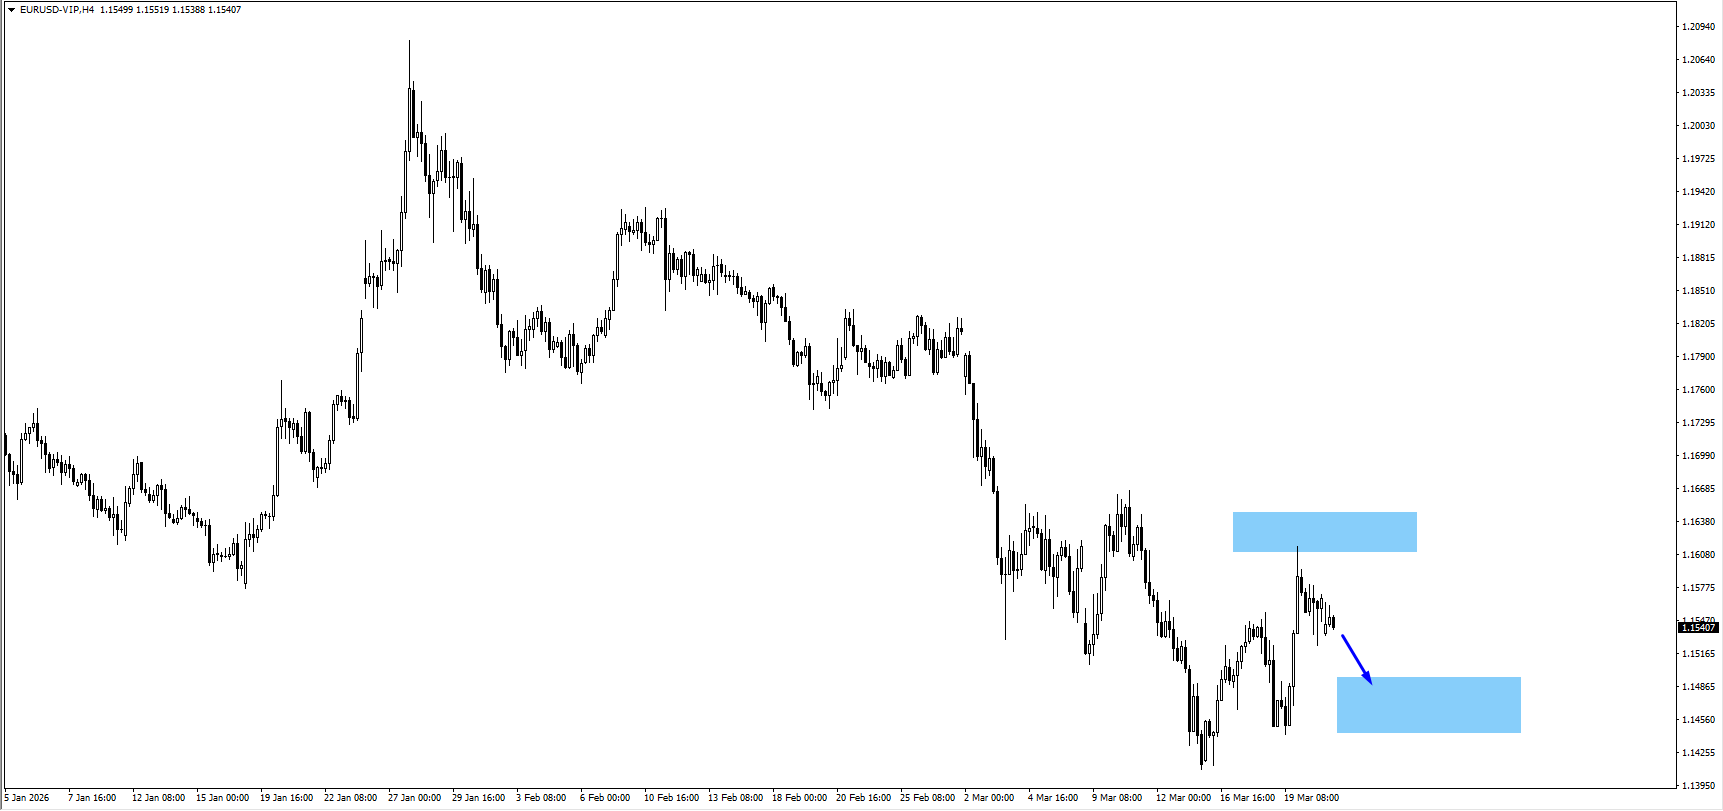
Watch this week
- Near-term downside focus at 1.1475.
- Weak price action there keeps pressure on the pair.
- A firm hold could slow the dollar move.
US Oil
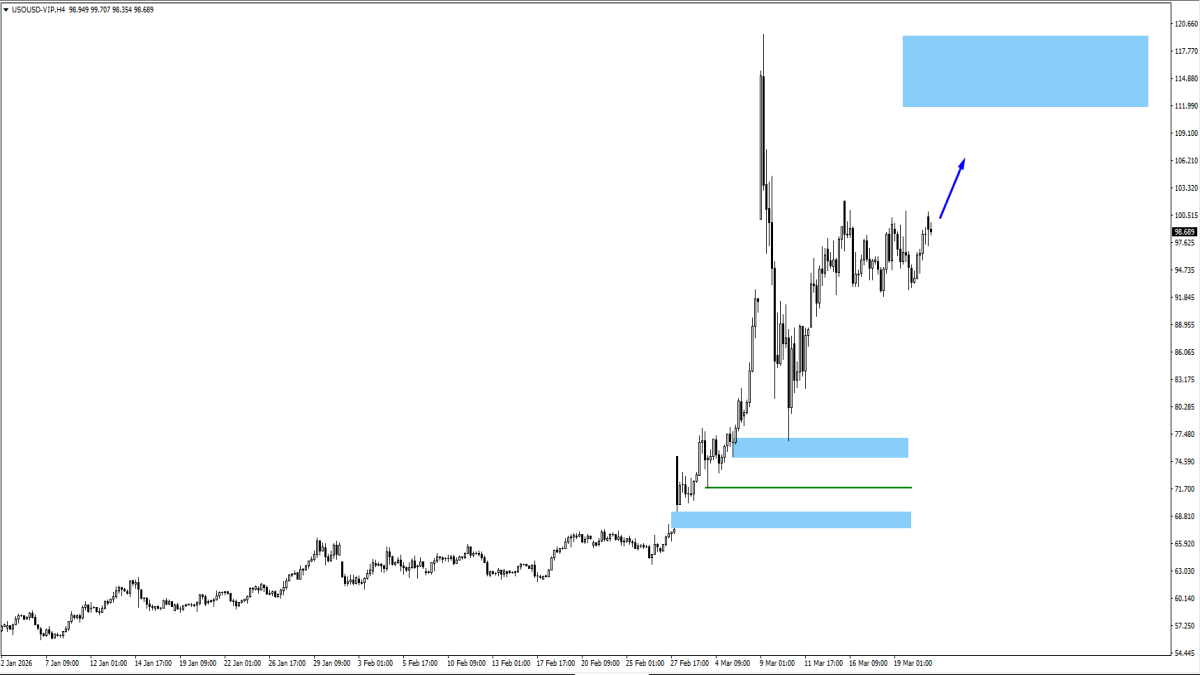
Watch this week
- Break and hold above 99.284.
- Upside extension toward 112.20.
- Any de-escalation headlines could trigger sharp retracement risk.
XAUUSD
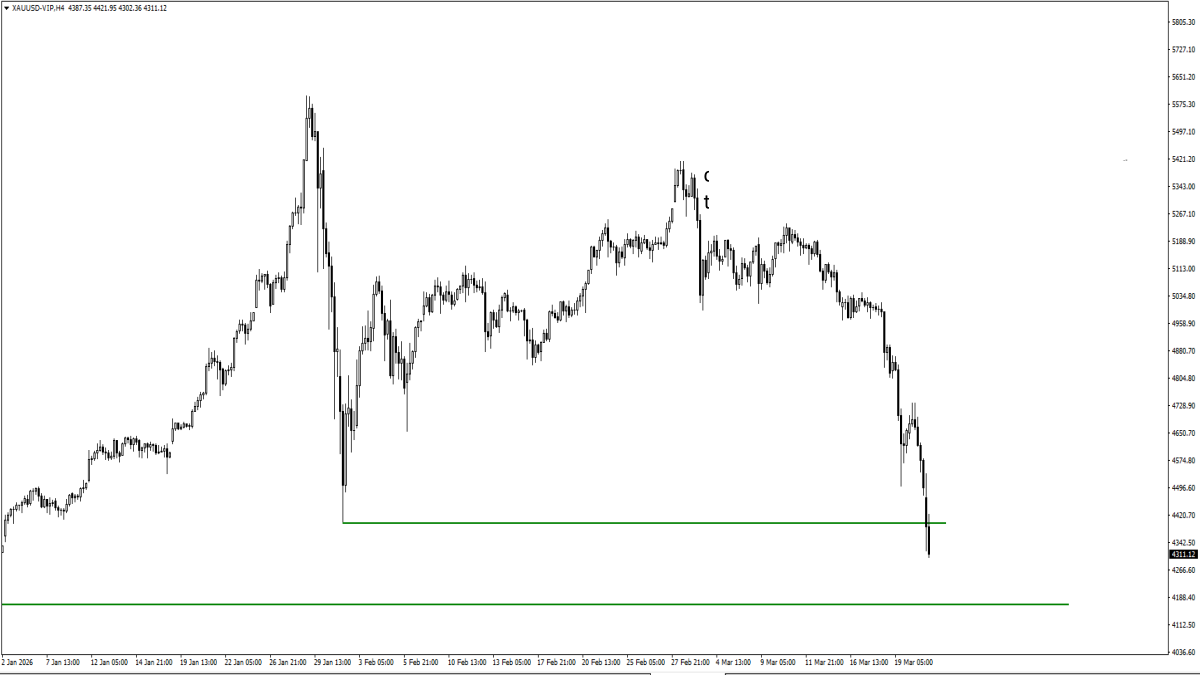
Watch this week
- Current support reaction after the break of 4402.73.
- A break below 4169 would open another lower leg.
- Stabilisation could produce a temporary consolidation phase.
SP500
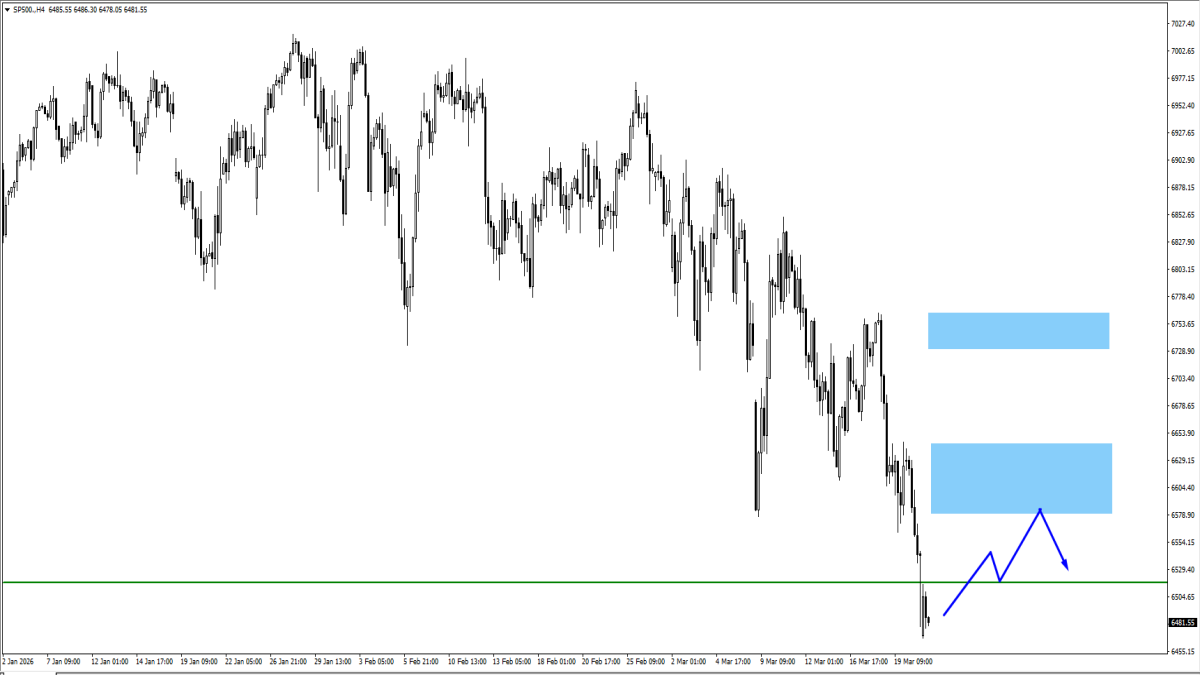
Watch this week
- Breakdown below 6517.
- Bearish rebound zones at 6600 and 6750.
- A weak recovery structure would fit the Fed/oil risk narrative.
BTCUSD
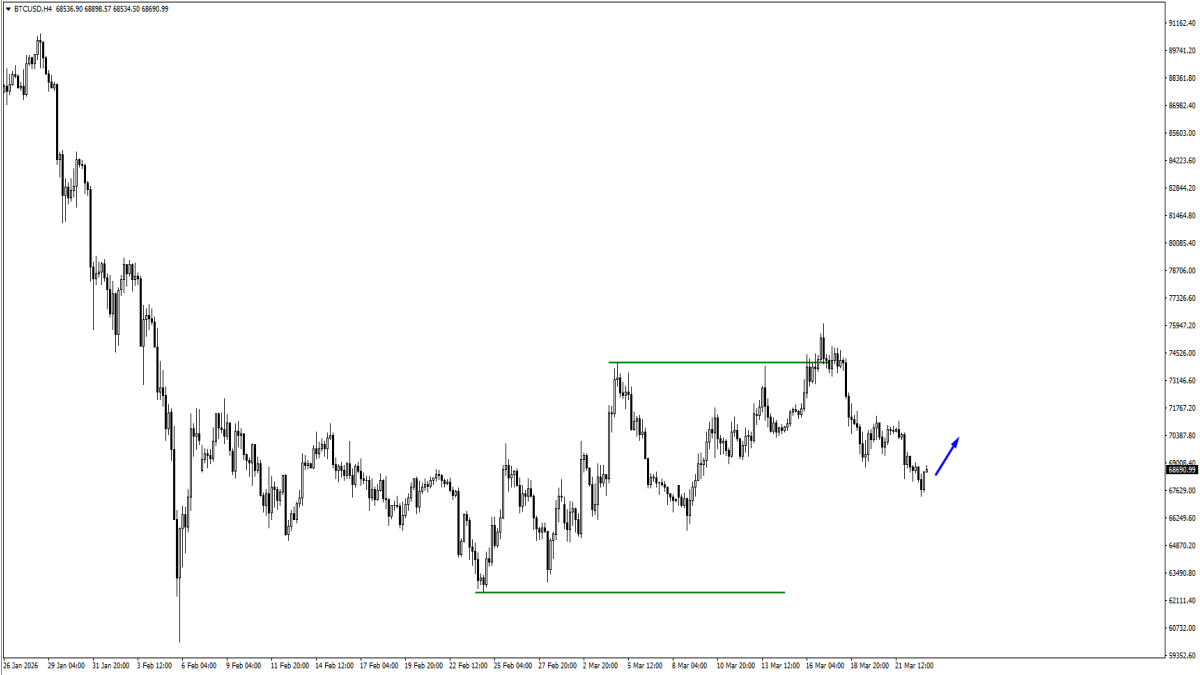
Watch this week
- Rebound focus toward 70550.
- Rejection there would keep the structure fragile.
- Strong acceptance would suggest broader risk appetite is stabilising.
Bottom Line
For this week, the key market theme is simple: the dot plot may still look orderly on the surface, but the logic underneath it is starting to crack.
The March 2026 FOMC was not a clear dovish pause. It was a pause carrying a more hawkish internal shift.
The dot plot still shows one cut, but the market is beginning to question whether that guidance can withstand higher inflation, war-driven energy risk, and a still-optimistic growth forecast. That tension is what matters most this week.
If the charts continue to confirm stronger oil, a firmer dollar, and weaker risk appetite, the market may conclude that the Fed’s latest roadmap is already losing credibility.
Create your live VT Markets account and start trading now.
Tap for Refresher on Report
Why does this report say the Fed’s dot plot looks less credible now?
Because the Fed is projecting higher inflation at 2.7% and stronger 2026 growth at 2.4%, while still leaving room for a rate cut. Under normal macro logic, firmer growth and firmer inflation usually support holding rates steady or staying tighter for longer, not easing.
Why is oil such an important driver for markets this week?
Oil is the clearest link between geopolitics and inflation. If the Iran conflict keeps supply risk elevated, especially around the Strait of Hormuz, higher oil prices can push inflation expectations up again. That would make it harder for the Fed to justify cutting rates and could pressure equities while supporting the US dollar.
Why are USDX, gold and equities being watched together?
They help reveal how markets are interpreting the same macro story. A stronger USDX suggests tighter financial conditions or reduced rate-cut expectations, gold reflects both safe-haven demand and dollar pressure, and equities show whether investors are becoming less comfortable with the growth and policy outlook.


