

Markets were thrown into chaos once again this April as a fresh round of tariffs announced by the Trump administration sent shockwaves across global assets, only to have the measures walked back shortly afterwards, reinforcing the phenomenon known as the “Trump Put.”
Borrowed from the idea of the “Fed Put,” the term refers to Trump’s tendency to soften hardline policies whenever market turmoil threatens his political standing. April 2025 may have showcased the clearest instance yet.
On April 2, 2025, the White House rolled out sweeping new tariffs: a 145% duty on over $500 billion in Chinese imports, fresh taxes on goods from close allies like Canada and Mexico, and vague threats aimed at European carmakers. The market reaction was swift and brutal. In a mere three sessions, the S&P 500 tumbled over 16%, plunging from 6,090 to 5,115, erasing months of gains.
The damage extended beyond equities. Bond yields spiked, with the 10-year Treasury staying stubbornly above 4.25%. Retail and industrial sectors bore the brunt, with fears of spiralling inflation and fresh supply chain disruptions rattling the broader economy.
Behind closed doors, pressure quickly mounted. Top CEOS from major companies like Walmart, Target, and Home Depot sounded alarms about rising prices and looming shortages. Treasury Secretary Scott Bessent urged President Trump to reconsider, warning that persistent economic instability could damage his reelection chances. Meanwhile, consumers, already grappling with rising costs, threatened to turn their frustrations into political action.
Responding to the mounting turmoil, Trump took action. On April 7, he announced a 90-day delay on most of the new tariffs. By April 22, he confirmed that the 145% tariff rate on Chinese goods would be “significantly” scaled back, though not entirely scrapped. Treasury Secretary Bessent simultaneously noted that the initial tariff measures were economically unsustainable and signalled a gradual thaw in trade tensions.
Markets wasted no time responding. The S&P 500 rebounded strongly, regaining 10% to stabilise around the 5,650 mark. Meanwhile, the VIX, Wall Street’s fear gauge, cooled from a panic-driven peak of 60 down to 29 in just over a week. Even consumer confidence started to inch back up, albeit cautiously.
The “Trump Put” has proven once again that economic performance often steers political decision-making. Trump has historically viewed stock market performance as a personal report card, and his willingness to adjust course when investors panic has become an established pattern. Now, market participants are increasingly expecting policy retreats after major selloffs, reinforcing the cycle.
Yet, the Trump Put is not without its limits. It doesn’t promise full reversals of damaging policies. Temporary rhetorical shifts can soothe nerves but often lack concrete follow-through, meaning volatility can easily return. Traders would be wise to stay vigilant. What looks like a relief rally could unravel if real economic damage continues to build.
Looking ahead, flexibility is key. If markets experience another steep 10–15% correction in a short span, especially during periods of heightened consumer dissatisfaction or corporate outcry, the likelihood of intervention rises. Investors should keep a close eye on statements from influential figures like Treasury Secretary Bessent and market-friendly voices like Howard Lutnick. Meanwhile, advisors such as Peter Navarro and Stephen Miller, known for their nationalist stances, may signal more aggressive policy persistence.
Indicators like the VIX provide useful signals as well; a spike above 50 usually foreshadows government efforts to restore market confidence. Also, rebounds in retail and manufacturing stocks, particularly names like Walmart and Home Depot, might serve as early clues that a “Trump Put” intervention is underway.
Despite ongoing market turbulence, the Trump Put remains a psychological anchor for investors in 2025. However, relying too heavily on political backstops is risky. Traders must balance the opportunity to ride relief rallies with the caution that real structural challenges may persist beneath the surface.
Market Movements This Week
Markets opened this week in a muted tone, caught in tight consolidation patterns as traders awaited major US economic reports and central bank commentary. Beneath the surface, there’s an unmistakable sense of tension, just waiting for a catalyst.
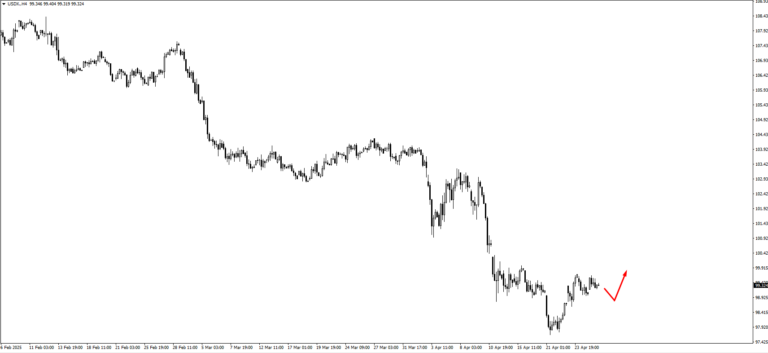
The US Dollar Index (USDX) remains rangebound. Support zones around 98.80 and 98.50 could attract buyers if the greenback weakens, while resistance near 100.60 remains the critical upside hurdle, particularly if US economic data misses forecasts.
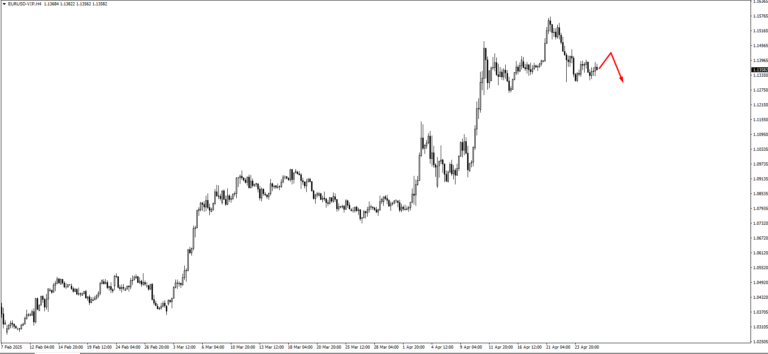
EUR/USD continues to trade sideways. Sellers are eyeing the 1.1400 -1.1470 zone, while a break below 1.1200 could trigger a steeper pullback if eurozone data underwhelms.
In the United Kingdom, GBP/USD is moving sideways, struggling to find direction. If price edges higher, traders are watching 1.3370 for potential selling pressure. On the other hand, a loss of momentum could drive a retest of the 1.3202 swing low, a key area where buyers may attempt to step back in.
The USD/JPY pair retraced slightly before moving higher but failed to reach the closely watched 141.95 level. If price resumes its climb, 144.60 will be the next resistance to test. However, if price consolidates or hesitates at 144.60, traders are preparing for a bearish response closer to 146.60.
USD/CHF rebounded from the 0.8235 support area earlier in the week. As it pushes higher, eyes are on 0.8380 for signs of exhaustion. Should price consolidate or falter there, another bearish wave could form toward 0.8530.
For the commodity currencies, AUD/USD has traded lower from the 0.6410 area. As the Aussie drifts downward, the focus shifts to 0.6295 for bullish setups. However, if price retraces back upward before testing 0.6295, bearish price action may reappear near 0.6460.
Similarly, NZD/USD is showing weakness after sliding from the 0.5990 area. If the price moves lower, traders will look for buying opportunities at 0.5910 and 0.5870. If, instead, the kiwi rallies ahead of schedule, bearish setups may emerge around 0.6040.
USD/CAD is currently ranging, anchored around the 1.3830 support zone. If the price climbs higher, watch for selling interest around 1.3910 and 1.3945. A breakdown, however, would put the 1.3755 area into play for possible bullish setups.
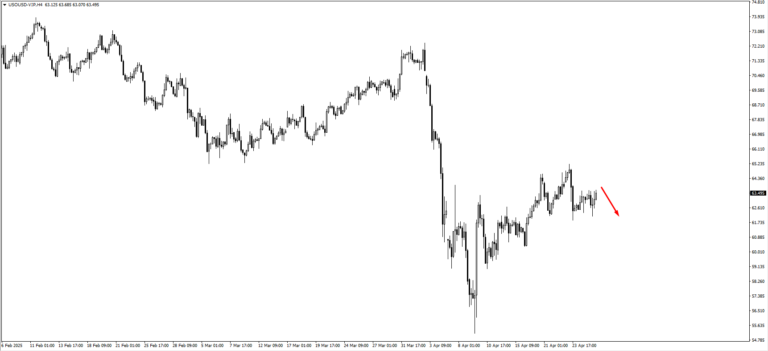
In commodities, US Oil (USOil) is consolidating after recent swings. Resistance at 64.00 could cap any upside moves, while 61.00 remains a key support level for potential bullish setups if oil weakens on renewed trade fears.
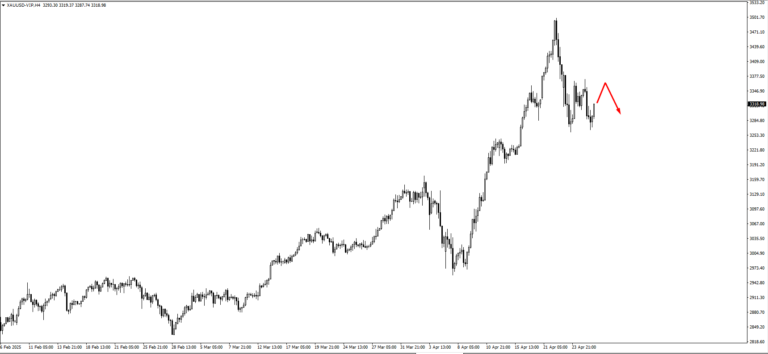
Gold (XAU/USD) has pulled back slightly after reaching the lower end of the 3390 monitored area. Price may consolidate further, but should gold rally again, 3350 and 3390 will serve as the next bearish checkpoints as traders gauge the balance between safe-haven demand and easing political tensions.
The S&P 500 remains precarious, even as it edges higher. 5610 is the next major resistance to watch. A failure to break above this could trigger renewed selling, particularly if incoming US data, such as JOLTS openings or GDP growth, disappoints market expectations.
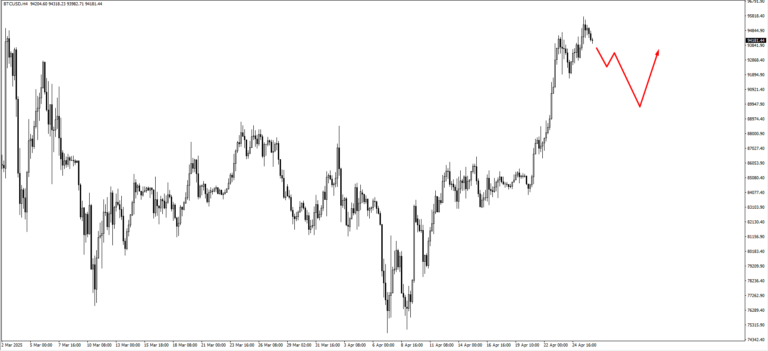
In crypto, Bitcoin (BTC) remains choppy but resilient. A solid base could trigger a bullish move toward 89,300, with 98,300 as the next target if volatility stays subdued.
Natural Gas (NATGAS) is showing tentative recovery after bouncing from the 2.80 zone. Should momentum falter, traders will be watching 2.55 for another potential bullish setup.
Key Events This Week
Though the calendar is lighter, risk levels remain high:
- Tuesday, April 29: The US JOLTS Job Openings report is due. A sharper-than-expected drop could spark Fed rate cut bets, pressuring the USD.
- Wednesday, April 30: Australia releases its CPI y/y, with inflation expected to dip to 2.3% from the previous 2.4%, reinforcing expectations that the RBA will remain cautious. Canada’s GDP m/m reading will also be scrutinised after a prior print of 0.4%, though structural factors mean traders will be more reactive to trend shifts than single data points. For the US, the spotlight falls squarely on the Advance GDP q/q, forecasted at a meagre 0.4%, a dramatic slowdown from the previous 2.4% pace. Combined with a forecasted Core PCE Price Index m/m reading of just 0.1% versus the previous 0.4%, these reports could reignite recession fears and drag the dollar lower if confirmed.
- Thursday, May 1: Bank of Japan announces its latest Policy Rate decision. Although no changes are expected, traders will parse the statement closely for hints about future moves.
- Friday, May 2: US Non-Farm Payrolls (NFP) report arrives. Expectations for just 129,000 jobs (versus 228,000 previously) could signal labour market weakness. A surprise in the Unemployment Rate (forecast at 4.2%) could sharply impact Fed expectations heading into summer.


