Back

The year-on-year GDP of Singapore for the fourth quarter stands at 5%, surpassing 4.3%.

Singapore’s gross domestic product (GDP) recorded a year-on-year growth of 5% in the fourth quarter, improving from 4.3% previously. This reflects a positive trend in the nation’s economic performance.

In currency movements, the EUR/USD pair has seen fluctuations, recently retreating below the 1.0500 mark as market sentiments remain cautious. Meanwhile, GBP/USD shows slightly diminished gains, settling just under 1.2650 ahead of anticipated communications from Bank of England officials.

Gold prices are holding steady near record highs, influenced by trade war concerns and a weakening US dollar. Despite endorsements from high-profile individuals, Dogecoin continues to face selling pressure, trading around $0.23.

The money market landscape for 2025 presents varied dynamics across the US, Eurozone, and UK, with expectations for rate changes influencing strategies.

Singapore’s economic expansion in the fourth quarter, growing from 4.3% to 5% on a yearly basis, suggests a stable recovery. The numbers indicate that industries have sustained momentum, likely due to strong domestic investment and external trade flows. If this trajectory holds, we may see shifts in monetary policy expectations, particularly if inflation pressures build up alongside this growth.

Turning to currency movements, the weakening of EUR/USD below the 1.0500 level shows markets adjusting to shifting risk appetite. Traders appear hesitant, likely weighing economic indicators and central bank positioning for the months ahead. Meanwhile, the British pound is holding just under 1.2650, suggesting that market participants are waiting to see how the Bank of England’s policymakers signal their next move. If the upcoming statements lean towards stability or tightening, sterling may find some support—but if uncertainty persists, we could see further fluctuations.

In commodities, gold remains near its peak, reflecting investor caution amid trade tensions and increased volatility in foreign exchange markets. With the US dollar under pressure, demand for the metal seems relatively intact. If external uncertainties continue, gold’s price action could provide safe-haven opportunities.

Elsewhere, Dogecoin continues to experience selling pressure, despite endorsements from well-known figures. Its struggles may stem from broader concerns about liquidity in the crypto market, as speculative interest wanes. If support levels fail to hold, further declines remain a real possibility.

Looking ahead to 2025, monetary policy is shaping expectations across the US, Eurozone, and the UK. With rate decisions set to influence strategy, derivative traders should monitor macroeconomic data closely. Each region faces different challenges, from inflationary risks to growth concerns, which could cause varied movements across interest rate curves. These shifts will demand a reassessment of positioning to anticipate potential market volatility in fixed-income and currency derivatives. The interaction between inflation outlooks and central bank responses will be key in determining capital flows.
Chinese developers are purchasing land at increased prices, indicating a return of market confidence.

China’s state-backed developers are increasingly acquiring land at higher prices as the government loosens home price restrictions to rejuvenate the property market. In 2025, 37% of land deals sold for at least 20% above the asking price, a rise from 14% in 2024 and 4.6% in 2023, as per China Index Academy.

Despite weak home sales and prices, this surge in land purchasing indicates a growing confidence in future market recovery. However, land sales volumes still trail behind pre-crisis figures, with many transactions involving smaller parcels.

To counter falling land sale revenues, local governments have eased restrictions. Numerous cities eliminated price caps on new homes last year, enhancing profit margins for developers. In November, Beijing removed home price limits for the first time in three years, with Shanghai and Hangzhou soon following suit.

Despite ongoing market uncertainties, state-owned developers are at the forefront, buoyed by government assurances to stabilise the real estate sector. With beneficial policy changes and renewed competition for prime land, the Chinese property market is exhibiting early signs of recovery.

While property sales remain weak, the steep increase in land acquisition costs paid by state-owned firms suggests that confidence in a market rebound is gathering momentum. The data from China Index Academy makes this clearer—only a small portion of land deals went far above asking prices in previous years, yet more than a third have done so in 2025. This reflects a shift in expectations.

At the same time, overall land sales remain subdued compared to the levels seen before the downturn. While transactions are happening, they often involve smaller plots, meaning developers are being selective rather than aggressively expanding. Still, the fact that these purchases continue at higher prices implies that some firms expect conditions to improve enough to justify paying more today.

Policy shifts are playing a key role. By loosening restrictions on housing prices, officials have given developers a stronger incentive to acquire land. The removal of price caps in cities like Beijing, Shanghai, and Hangzhou directly increases potential profits, which makes land acquisitions more appealing despite ongoing economic challenges. Given the concerns over falling land sale revenues, local governments are prioritising measures that entice firms to return to the market.

State-owned developers are the most active participants. While private firms remain cautious, those backed by the government have moved forward with purchases, likely encouraged by the latest efforts to stabilise real estate. With policy tailwinds in place and demand for prime land heating up, we are witnessing the early effects of these changes.

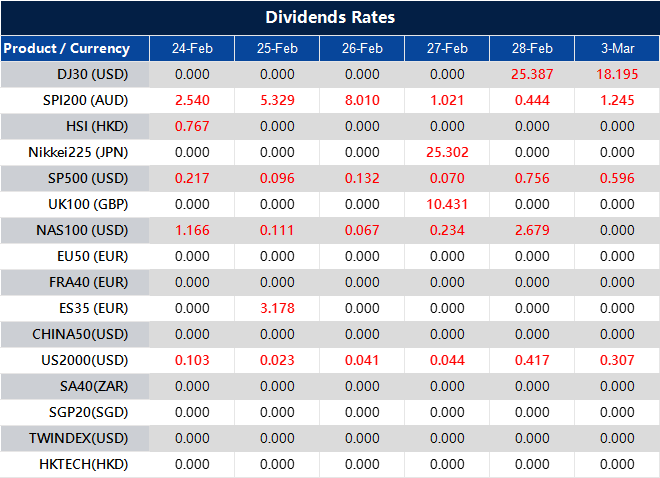
Dividend Adjustment Notice – Feb 24 ,2025

Dear Client,

Please note that the dividends of the following products will be adjusted accordingly. Index dividends will be executed separately through a balance statement directly to your trading account, and the comment will be in the following format “Div & Product Name & Net Volume ”.

Please refer to the table below for more details:

The above data is for reference only, please refer to the MT4/MT5 software for specific data.

If you’d like more information, please don’t hesitate to contact [email protected].

Gold prices increased in Pakistan today, as per the data collected by local sources.

Gold prices in Pakistan rose on Monday, with the cost per gram reaching 26,304.74 PKR, an increase from 26,249.55 PKR on Friday. The price per tola also rose, now at 306,813.30 PKR compared to 306,169.70 PKR previously.

Prices for gold are as follows: 1 gram is 26,304.74 PKR, 10 grams are 263,047.40 PKR, and a troy ounce is priced at 818,169.50 PKR. Daily updates are provided, reflecting local and international market conditions.

Central banks added 1,136 tonnes of gold, valued at approximately $70 billion, to reserves in 2022, marking the highest annual purchase historically. Gold inversely correlates with both the US Dollar and risk assets, influencing its price based on geopolitical events, interest rates, and currency strength.

Gold prices have edged up in Pakistan at the start of the week. A modest increase has been seen both per gram and per tola, aligning with fluctuations in broader markets. This movement reflects changing conditions locally and globally, highlighting the role of external factors in precious metal trends.

One of the largest players remains central banks, which collectively accumulated over a thousand tonnes of gold in 2022. This was the highest yearly purchase on record and underlines how these institutions view gold’s role in maintaining financial stability. With such strong buying patterns, it reinforces gold’s long-term appeal as a store of value, especially when economic conditions become uncertain.

Historically, gold prices tend to move in the opposite direction to the US Dollar and riskier assets. When the currency strengthens, gold often pulls back, and when investors seek safer alternatives, buying increases. This balance means geopolitical tensions, monetary policy changes, and interest rate shifts all have a measurable effect on pricing.

For traders using derivatives, these price dynamics require close monitoring. Changes in central bank strategies or adjustments in monetary policies could lead to fluctuations that present both opportunities and risks. When economic instability increases and the US Federal Reserve signals potential shifts in interest rates, gold can become more attractive as a hedge.

A strong dollar may create downward pressure, but if inflation persists or economic slowdown concerns grow, gold tends to retain its strength. Traders should be prepared for price swings driven by policy updates and shifts in investor sentiment. Given the steady accumulation by central banks and the ongoing uncertainties in financial markets, attention to macroeconomic indicators remains necessary in the coming weeks.

During Monday’s Asian trading hours, XAG/USD rises to approximately $32.70, maintaining its upward momentum.

Silver price (XAG/USD) is around $32.70 during Asian trading hours on Monday, supported by a weakening US Dollar. Concerns regarding US President Donald Trump’s tariff plans may enhance safe-haven flows, contributing to the rise in Silver’s price.

The market outlook remains bullish, with prices holding above the 100-day Exponential Moving Average. The 14-day Relative Strength Index (RSI) stands near 64.40, indicating potential upward movement.

Key resistance lies between $33.35 and $33.40. If prices consistently trade above this range, targets include $34.55 and potentially $34.87.

Initial support is at $31.52, with additional support levels at $30.90 and $30.70.

Prices are influenced by numerous factors, including geopolitical tensions and economic conditions in major markets. Silver’s industrial applications also significantly affect demand—its use in electronics and solar energy is notable.

Silver typically moves in tandem with Gold prices, mirroring their safe-haven asset status. Analysts may look at the Gold/Silver ratio to assess their relative valuations, guiding potential investment decisions.

With Silver holding firm at $32.70 in early Asian trade, the weakening US Dollar appears to be keeping prices elevated. Market sentiment remains positive, largely due to persisting concerns over Donald Trump’s trade policies, which may drive further safe-haven demand. These tariff-related anxieties could maintain an environment where precious metals attract cautious investors looking to hedge against economic risk.

Technical indicators continue to reflect strength. With prices holding above the 100-day Exponential Moving Average, short-term momentum appears favourable. The RSI hovering around 64.40 suggests there may still be room for further upside before overbought conditions emerge. However, traders should watch for any rapid shifts in momentum.

For those focusing on key price levels, resistance is marked near $33.35–$33.40. If Silver pushes past this, there is scope for a move towards $34.55, with an extended target around $34.87. A decisive break above these levels would suggest continued buying interest, further reinforcing the current bullish sentiment.

On the downside, initial support is found at $31.52, while stronger buying support exists around $30.90 and $30.70. Should prices retreat, these levels may attract renewed interest from dip buyers looking to capitalise on lower entries.

Beyond technicals, external market forces remain influential. Geopolitical tensions, particularly trade uncertainties and macroeconomic conditions in top economies, could dictate price direction. Additionally, industrial demand remains a significant factor, with Silver playing a key role in technology and renewable energy sectors, such as electronics and solar panels.

There is also the broader relationship with Gold to consider. Historically, Silver often tracks movements in Gold, given their perceived safe-haven attributes. The Gold/Silver ratio can offer insights into valuation trends—if the ratio shifts considerably, it may provide clues about potential reversals or momentum changes in either metal.

With the current trajectory still leaning upwards, traders should stay alert to technical signals and macroeconomic developments. Reaction to tariff discussions, fluctuations in the US Dollar, and broader commodity movements will be particularly important in shaping short-term price action.

On Monday, gold prices in India increased, based on recently compiled data.

Gold prices in India rose on Monday, with the price per gram reaching 8,197.41 Indian Rupees (INR), up from 8,175.44 INR on Friday. For tola, the cost increased to 95,609.34 INR, compared to 95,350.84 INR previously.

The prices for gold in different units are as follows: 1 gram at 8,197.41 INR, 10 grams at 81,970.98 INR, and a troy ounce at 254,976.20 INR. These figures reflect adaptations of international prices to local measurements.

Central banks remain the largest holders of gold, accumulating 1,136 tonnes worth approximately $70 billion in 2022. Price fluctuations depend on various factors, including geopolitical instability and interest rate changes.

Gold has climbed again, edging upwards from Friday’s levels, setting a new benchmark for those tracking market movement. A gram now commands 8,197.41 INR, a gain from 8,175.44 INR at the week’s close. Meanwhile, the price per tola has moved to 95,609.34 INR, reflecting a broader upward shift.

Breaking these figures down, 10 grams now stand at 81,970.98 INR, while a troy ounce sits at 254,976.20 INR. These conversions serve as a guide for pricing adjustments, particularly for traders balancing between international and domestic rates.

Central banks continue to exert a wide influence, having collectively acquired 1,136 tonnes in 2022, valued around $70 billion. Their role remains dominant as they add further reserves, demonstrating sustained confidence in gold as a safeguard.

Price movement stems from a mix of factors, notably geopolitical events and changes in interest rates. With central banks maintaining their purchases and rates still shaping financial decisions, fluctuations are unlikely to disappear anytime soon. For traders, these elements must be factored into their strategies, as both short-term adjustments and long-term positioning will be shaped by how these forces develop in the coming weeks.

In January, credit card spending in New Zealand rose, while NZD/USD reacts to USD’s decline.

New Zealand reported a year-on-year increase in credit card spending of 1.3% for January, an improvement from the previous decline of 1.3%.

The New Zealand dollar is rising against various currencies today, including the Australian dollar, euro, Swiss franc, British pound, and Canadian dollar.

Currently, the NZD/USD exchange rate is not influenced by local data but rather by the weakness of the US dollar. The USD/JPY rate remains above 149.00, despite a brief drop below this level.

This uptick in credit card spending suggests a slight boost in consumer activity compared to last year, a reversal from the decline previously seen. Household financial behaviour appears to be shifting, and while the increase is not particularly large, it indicates that spending is moving in a more positive direction.

The New Zealand dollar is gaining value across multiple pairs, showing broad strength against the Australian dollar, euro, Swiss franc, British pound, and Canadian dollar. This reflects a mix of domestic conditions and external influences, but what stands out is the movement of NZD/USD. The pair’s rise is not coming from local data or domestic drivers but rather from a weaker US dollar. This distinction is worth noting, especially for those who track the relationship between economic indicators and currency movements.

Meanwhile, USD/JPY is still holding above 149.00, though it briefly slipped beneath this mark. That momentary dip suggests some selling pressure, but it was not enough to take it lower for a sustained period. Considering past trends, it’s worth watching whether this level continues to hold or if a deeper pullback develops over time.

Understanding these shifts is more than just recognising the numbers. It’s about seeing where the pressure is coming from and how the reactions play out across different assets. The New Zealand dollar’s current strength does not appear to be driven by domestic factors, which means external conditions are having a greater say in its performance. Given that, closely watching broader currency dynamics may offer a more accurate view of where movements are heading.

As for USD/JPY, keeping an eye on how it behaves near this level is essential. If it manages to stay above 149.00, that could reinforce stability, but a decisive move lower might suggest otherwise. Watching how other assets respond could provide further confirmation. The next few weeks will likely offer more clarity, particularly as new economic data emerges and external conditions develop further.

On Monday, gold prices increased in Malaysia, based on compiled data.

Gold prices in Malaysia increased on Monday. The price for gold reached 415.96 Malaysian Ringgits (MYR) per gram, up from MYR 414.97 on Friday.

The cost of gold per tola also rose to MYR 4,851.73 compared to MYR 4,840.13 on the previous day.

The prices for gold based on different units are as follows: 1 gram at MYR 415.96, 10 grams at MYR 4,159.64, tola at MYR 4,851.73, and troy ounce at MYR 12,938.04.

Factors influencing gold prices include geopolitical instability, interest rates, and the performance of the US Dollar. Central banks, particularly those in emerging economies, are increasing their gold reserves to support currencies and combat economic uncertainty.

Gold prices in Malaysia have gone up again, with a slight but noticeable increase compared to the end of last week. A gram now costs MYR 415.96, which is more than Friday’s MYR 414.97. The price for a tola, often preferred in South Asian and Middle Eastern markets, moved up by over MYR 11.

This is not happening in isolation. Many things shape how gold is valued, and we have been seeing a steady influence from global instability, shifting interest rates, and the strength of the US Dollar. When interest rates rise, holding gold becomes less attractive since it does not provide income like bonds do. However, when major currencies fluctuate or stocks perform poorly, many investors shift towards gold as a safer place for their money.

On top of that, central banks continue adding to their gold reserves. In emerging markets, the logic is straightforward: securing more of the metal helps strengthen their currencies and provides insurance against unpredictable economic turns. With ongoing concerns around inflation and economic slowdowns in different regions, we have observed steady demand coming from these banks.

Traders dealing with gold derivatives should keep an eye on upcoming announcements from major monetary institutions. Any indications of interest rate shifts—particularly from the US Federal Reserve—will likely cause reactions in the market. If inflation remains persistent or central banks signal slow rate cuts, gold could hold its appeal. Conversely, if borrowing costs drop quickly, some traders may look elsewhere for better returns.

Beyond macroeconomic factors, geopolitical tensions have added reasons for traders to consider hedging their positions. When uncertainty in global politics spikes, gold has historically been the asset investors turn towards. Pay attention to developments across major economies, as any worsening conflicts or economic instability could sustain or even push prices higher.

With volatility present in various markets, short-term price swings remain possible. Monitoring demand from institutional buyers, global economic trends, and shifts in the Dollar’s strength will be necessary in the weeks ahead.

Goldman Sachs remains optimistic about China’s A-shares and H-shares, anticipating strong AI-driven growth.

Goldman Sachs supports an overweight position on China’s A-shares and H-shares, attributing this to AI-driven growth and liquidity support. Analysts predict that H-shares will gain from AI advancements, while A-shares have potential for improvement.

An increase in global fund exposure to China is observed, with H-shares likely remaining a preferred option. However, A-shares might experience better momentum shortly.

Goldman Sachs anticipates that A-shares will outperform H-shares over the next three months. The premium of A-shares over H-shares has decreased from 34% to 14% in three months, suggesting around 10% upside if it returns to the average of the past year.

Goldman Sachs has expressed confidence in the prospects of both A-shares and H-shares, highlighting artificial intelligence as a key driver for growth alongside supportive liquidity conditions. This view is supported by the observation that international funds are slowly increasing their exposure to Chinese equities. Within this, H-shares appear to remain the preferred route for many investors, yet recent trends suggest that A-shares could gather stronger momentum in the near future.

Over recent months, there has been a narrowing gap between A-share and H-share valuations. The premium that A-shares held over their offshore counterparts has tightened from 34% to 14%, a compression that might indicate further room for upside if historical price relationships are any guide. Should this trend revert to its one-year average, A-shares could still see an additional 10% advance from current levels.

With these shifting dynamics in valuation spreads and investor positioning, questions naturally arise about how market participants should navigate exposure over the coming weeks. The expectation remains that domestically traded equities will outperform their Hong Kong-listed counterparts over the next three months. If this forecast holds, traders who anticipate relative strength in A-shares may look towards vehicles that capitalise on the potential for price recovery.

At the same time, the upward move in global funds allocating capital towards China introduces another factor to consider. If this flow persists, it could provide a reinforcing effect for valuations, particularly for the segment of the market that has lagged in recent months. The relative appeal of A-shares could continue to improve as a result, particularly if liquidity conditions remain constructive and domestic momentum strengthens.

Expectations for artificial intelligence remain central to this outlook, benefiting both classes of shares, though not necessarily to the same degree. If H-shares remain the more accessible option for foreign investors seeking exposure to AI-related themes, those looking for stronger near-term movement may find A-shares more promising—especially given the valuation reset that has already taken place.

Over the coming weeks, close attention is required as valuations rebalance. With momentum shifting, a reassessment of positioning may be warranted to capture the potential discrepancies in pricing.

The US Dollar’s decline causes USD/CAD to drop below 1.4200, trading near 1.4190.

USD/CAD fell below 1.4200, trading around 1.4190 due to a weakening US Dollar influenced by disappointing economic data. The US Dollar Index dipped near 106.00, with Treasury yields at 4.19% and 4.43% for 2- and 10-year bonds, respectively.

In Canada, mixed economic results, including a 0.4% decline in Retail Sales, signal a slowdown in consumer spending. Elevated inflation pressures, seen in rising industrial producer prices, complicate the Bank of Canada’s policy decisions.

Weaker crude oil prices may challenge the CAD, as Canada is a major oil exporter. Expectations for resumed oil exports from Kurdistan’s fields apply additional downward pressure.

The US Dollar has been on the back foot, as weaker-than-expected economic data raises doubts about the strength of the American economy. A drop below 1.4200 in USD/CAD reflects the broader softness, with the Dollar Index slipping towards 106.00. At the same time, US Treasury yields remain elevated but have eased slightly, with 2-year yields at 4.19% and 10-year yields at 4.43%. This suggests bond markets are recalibrating expectations around the Federal Reserve’s monetary policy.

On the Canadian front, data paints a mixed picture. The 0.4% decline in Retail Sales points to fading consumer demand, which could weigh on overall economic growth. However, price pressures persist, particularly in industrial producer prices, making the Bank of Canada’s job more complex. With inflation still a concern, there’s uncertainty about how policymakers will respond in the coming months.

Oil is another factor playing into the currency’s movement. Canada’s reliance on crude means lower prices often translate into a weaker CAD. With the possibility of oil exports resuming from Kurdistan, global supply could rise, keeping prices from moving higher. If this plays out, it may add further downside for the Canadian currency.

For those trading derivatives, the interaction between these elements needs close monitoring. A softening US Dollar, sticky inflation, and uncertainty surrounding energy prices create conditions where volatility could increase. If economic data continues to disappoint in the US, expectations around rate cuts might intensify, pulling yields lower. That, in turn, could push USD/CAD further down, provided Canadian data doesn’t surprise on the weaker side.

Equally, the Bank of Canada’s stance will determine if CAD can hold its ground. If policymakers signal they are still concerned about inflation despite softer demand, the currency could find support. However, if economic growth slows further, and rate expectations shift, that support might weaken. In either case, oil will remain a central factor. If prices find stability or increase, CAD could benefit, but prolonged weakness in crude could act as a headwind.

Watching how these narratives unfold will be key. Treasury yields, policy decisions, and commodity prices are all in flux, which means price swings could be sharper than usual in the coming weeks. Keeping an eye on upcoming economic releases will be important, as they will help determine the next move in USD/CAD and broader market sentiment.

Back To Top
server

Hai 👋

Bagaimana saya boleh membantu?

Segera berbual dengan pasukan kami

Chat Langsung

Mulakan perbualan secara langsung melalui...

  • Telegram
    hold Ditangguh
  • Akan datang...

Hai 👋

Bagaimana saya boleh membantu?

telegram

Imbas kod QR dengan telefon pintar anda untuk mula berbual dengan kami, atau klik di sini.

Tidak ada aplikasi Telegram atau versi Desktop terpasang? Gunakan Web Telegram sebaliknya.

QR code