Notification of Trading Adjustment – Mar 27, 2025

Dear Client,

The trading hours of some MT5 products will change due to the upcoming Daylight Saving Time change in the EU/UK. Please refer to the table below outlining the affected instruments:

Notification of Trading Adjustment in DST

The above information is provided for reference only; please refer to the MT4/MT5 software for specific data.

If you’d like more information, please don’t hesitate to contact  [email protected].

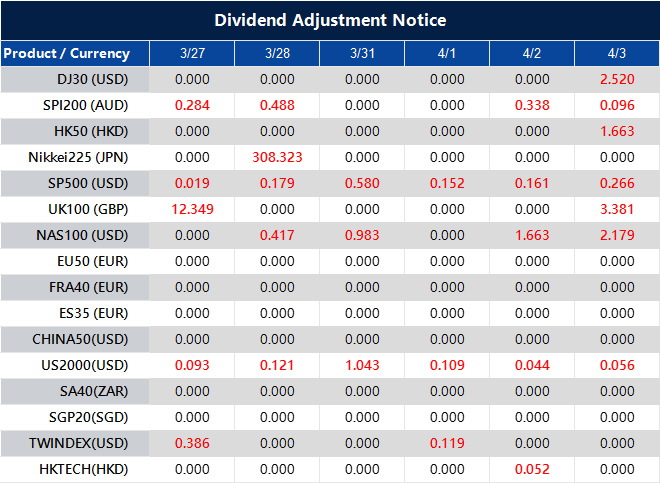
Dividend Adjustment Notice – Mar 27 ,2025

Dear Client,

Please note that the dividends of the following products will be adjusted accordingly. Index dividends will be executed separately through a balance statement directly to your trading account, and the comment will be in the following format “Div & Product Name & Net Volume”.

Please refer to the table below for more details:

Dividend Adjustment Notice

The above data is for reference only, please refer to the MT4/MT5 software for specific data.

If you’d like more information, please don’t hesitate to contact [email protected].

Dividend Adjustment Notice – Mar 26 ,2025

Dear Client,

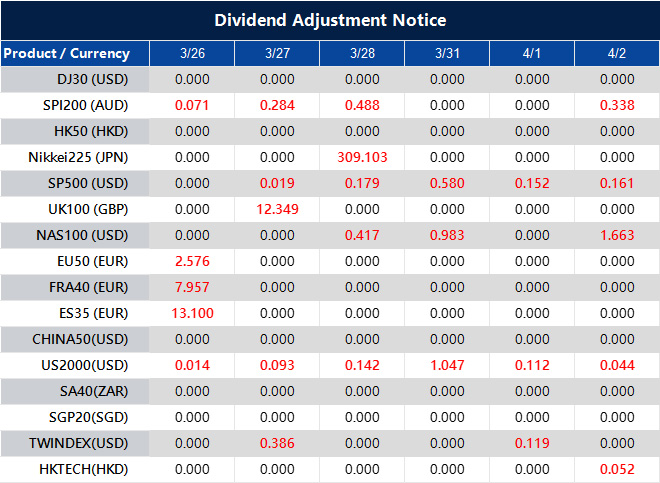
Please note that the dividends of the following products will be adjusted accordingly. Index dividends will be executed separately through a balance statement directly to your trading account, and the comment will be in the following format “Div & Product Name & Net Volume”.

Please refer to the table below for more details:

Dividend Adjustment Notice

The above data is for reference only, please refer to the MT4/MT5 software for specific data.

If you’d like more information, please don’t hesitate to contact [email protected].

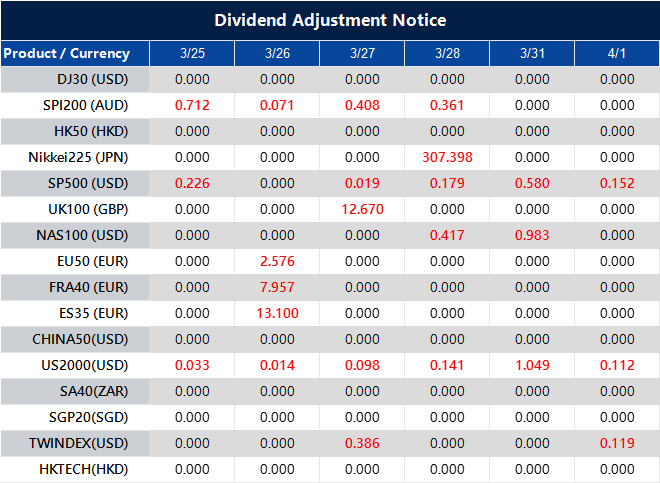
Dividend Adjustment Notice – Mar 25 ,2025

Dear Client,

Please note that the dividends of the following products will be adjusted accordingly. Index dividends will be executed separately through a balance statement directly to your trading account, and the comment will be in the following format “Div & Product Name & Net Volume”.

Please refer to the table below for more details:

Dividend Adjustment Notice

The above data is for reference only, please refer to the MT4/MT5 software for specific data.

If you’d like more information, please don’t hesitate to contact [email protected].

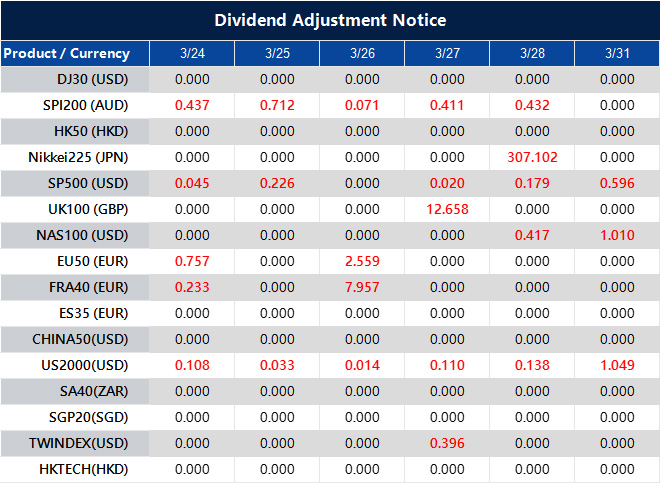
Dividend Adjustment Notice – Mar 24 ,2025

Dear Client,

Please note that the dividends of the following products will be adjusted accordingly. Index dividends will be executed separately through a balance statement directly to your trading account, and the comment will be in the following format “Div & Product Name & Net Volume”.

Please refer to the table below for more details:

Dividend Adjustment Notice

The above data is for reference only, please refer to the MT4/MT5 software for specific data.

If you’d like more information, please don’t hesitate to contact [email protected].

New Products Launch – Mar 21 ,2025

Dear Client,

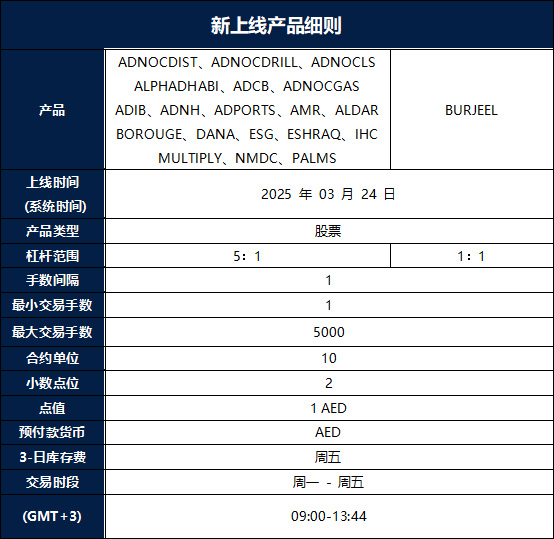
To provide you with more diverse trading options, VT Markets will launch 20 new products on 24th March 2025.

You can trade the world’s popular products on Meta Trader 5 with the following specifications:

New Products Launch

The above data is for reference only, please refer to the MT5 platforms for the updated data.

Friendly reminders:
1. Please refer to the MT5 platforms for the specific swap rate.

If you’d like more information, please don’t hesitate to contact [email protected].

Hello world!

Welcome to VT Markets Sites. This is your first post. Edit or delete it, then start blogging!

As risk aversion rises, USDJPY retreats below a crucial swing zone towards 61.8% retracement level

The USDJPY is declining as risk aversion grows, with stock markets facing pressure and bond yields decreasing. The 10-year yield has fallen by 5 basis points, while the 2-year yield decreased by 5.7 basis points.

Equity markets are also weakening, with the NASDAQ down by 1.63% and the S&P 500 declining by 1.23%. On the technical side, USDJPY has dropped below a significant swing area between 147.21 and 147.34, with the next key support identified at the 61.8% retracement level from September’s rally, positioned at 146.94. A sustained movement below this level may suggest a more negative technical outlook.

The decline in USDJPY reflects a growing sense of caution in financial markets. Investors typically move towards safer assets when uncertainty rises, and we see that happening now. Stock markets are under pressure, and at the same time, bond yields are falling. Lower yields indicate stronger demand for bonds, which often corresponds with a risk-off approach from investors. The 10-year yield is down by 5 basis points, while the more short-term focused 2-year yield has fallen slightly more, showing a 5.7 basis point decrease.

Equities are feeling the strain as well. The NASDAQ, which leans towards technology stocks, has dropped by 1.63%, while the S&P 500 is lower by 1.23%. Selling pressure continues to be apparent, and if this persists, it could reinforce the broader aversion to risk.

From a technical perspective, USDJPY has now moved below an area that previously acted as support between 147.21 and 147.34. This signals growing weakness, as failure to hold above these levels suggests sellers are gaining control. The next line to watch is the 61.8% retracement from September’s rally, located at 146.94. Given how widely followed this retracement level is among market participants, a breach below it could trigger further downside movement.

If downward momentum strengthens, we may see additional technical selling from traders who rely on these key levels for their strategies. This kind of positioning can create sharper movements, particularly if broader risk sentiment remains weak. On the other hand, if buyers step in around current levels, there may be an effort to stabilise price action. However, that would largely depend on whether broader market conditions allow for it.

For now, the tone in financial markets remains cautious. The reaction in stocks and bonds underscores this, and the technical break in USDJPY aligns with that sentiment. If this trend continues, it would not be surprising to see more defensive positioning across asset classes.

Stocks are experiencing a decline, with NASDAQ dropping 1.09% and S&P 500 close behind

Stocks are experiencing a downturn, with the NASDAQ declining by 196.47 points (1.09%) to a level of 17,872. The S&P 500 has decreased by 53.5 points (0.94%), now at 5,685.

The S&P 500 is moving further away from its 200-day moving average of 5,732.70. The NASDAQ is set to close below its 50-week moving average for the first time since March 2023.

This decline marks the NASDAQ’s third consecutive weekly decrease, down 5.15% this week. The S&P 500 has also recorded three weeks of consecutive losses, currently down 4.61%.

Market Momentum Shift

These declines highlight a change in momentum. Markets do not move in straight lines, but patterns emerge when volatility increases, and recent weeks have demonstrated that. The NASDAQ breaking below its 50-week moving average signifies more than a temporary pullback. Since March 2023, buyers have defended this level, suggesting that sentiment has shifted. A breach of this kind often encourages further selling, as traders who previously relied on this as an entry point begin to exit.

The S&P 500 distancing itself from its 200-day moving average reinforces the lack of buying strength. This isn’t a minor fluctuation—it extends a pattern of sellers pressuring prices lower. When major indices repeatedly fail to hold key technical thresholds, the argument for a short-term recovery weakens.

Weekly trends matter. A single red week can be dismissed as normal market action, but three in a row suggest larger forces at play. The NASDAQ’s 5.15% drop this week is not an isolated occurrence. The S&P 500’s 4.61% loss mirrors that weakness, further emphasizing that downward pressure is widespread.

We must also pay attention to volume. A decline supported by higher-than-normal trading activity signals conviction behind the move. If institutions are reducing exposure, rallies may struggle. If volume is lacking, the selling could be less durable. Understanding this distinction helps avoid reacting too soon.

Sentiment alone does not dictate market direction. Interest rates, economic data, and corporate earnings cannot be ignored. Market participants anticipating a rebound must ask what has changed. Buying after notable declines is common, but without a shift in the factors driving the sell-off, such attempts can be premature.

Key Support Levels

Watching how indices behave around support levels can provide clarity. A recovery that lacks momentum may only serve as a temporary pause before further declines. Conversely, a sharp move upward with strong participation could indicate renewed confidence.

There is no single factor determining where prices will settle, but patterns, volume, and external catalysts all shape expectations. The next few weeks will determine whether this is a passing dip or something deeper.

Create your live VT Markets account and start trading now.
Centeno mentioned the inflation cycle nearing resolution, with ongoing ECB rate cuts until targets are met

ECB’s Centeno stated that the economy is nearing the end of the current inflationary cycle. He confirmed that rate cuts will persist until inflation reaches the designated target.

The ECB’s latest projections indicate headline inflation at 2.3% for 2025, 1.9% for 2026, and 2.0% for 2027. The increase for 2025 is attributed to stronger energy price movements.

Inflation Forecast Breakdown

Excluding energy and food, inflation forecasts are 2.2% for 2025, 2.0% for 2026, and 1.9% for 2027. The current average remains above the CPI target of 2.0%, so convergence has not yet been achieved.

Centeno’s remarks suggest the European Central Bank will continue lowering rates for the foreseeable future. Policy adjustments will aim to bring inflation in line with the target, though this process may take several years. Recent predictions reflect this, with inflation not expected to hit 2% consistently until 2026.

Fresh estimates for next year show inflation slightly above this level, primarily due to movements in energy markets. This means external cost pressures are still playing a role, which could introduce some volatility. However, when excluding energy and food, projections are lower, meaning underlying trends may be moving in the desired direction. That being said, numbers remain marginally off target, reinforcing why rate reductions are set to continue.

Policy Adjustments And Market Reactions

For traders analysing price movements, expectations around policy shifts remain clear. If projections hold, rate adjustments will follow a path aimed at achieving price stability. While current levels suggest inflation is moderating, the ECB has made it clear that policy will stay accommodative until full convergence occurs.

Understanding these shifts allows for better positioning in the weeks ahead. Inflation expectations set by the ECB establish a framework for possible rate decisions, influencing how markets react. By paying close attention to how actual inflation progresses relative to forecasts, any deviations in pricing trends can present new opportunities.

Policymakers have not indicated any abrupt changes, so adjustments will likely be gradual. The pace depends on how quickly inflation aligns with targets. Given that energy prices remain unpredictable, this element must be factored into short-term expectations. While broader trends suggest a downward trajectory, external factors mean vigilance is still required.

Create your live VT Markets account and start trading now.
Back To Top
server

Hai 👋

Bagaimana saya boleh membantu?

Segera berbual dengan pasukan kami

Chat Langsung

Mulakan perbualan secara langsung melalui...

  • Telegram
    hold Ditangguh
  • Akan datang...

Hai 👋

Bagaimana saya boleh membantu?

telegram

Imbas kod QR dengan telefon pintar anda untuk mula berbual dengan kami, atau klik di sini.

Tidak ada aplikasi Telegram atau versi Desktop terpasang? Gunakan Web Telegram sebaliknya.

QR code