Back

How to trade indices? 

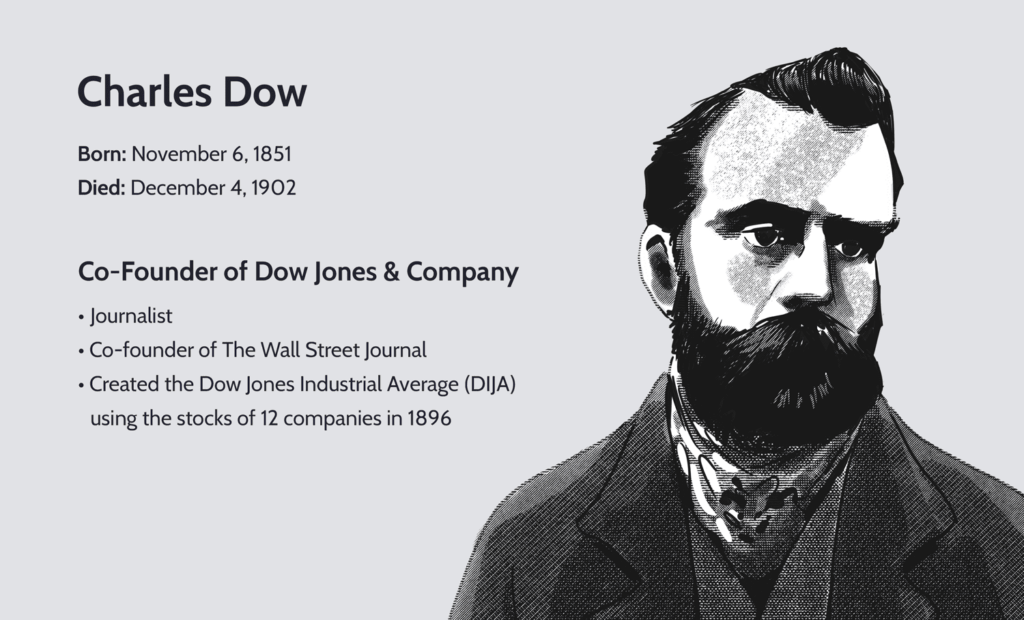
Transport yourself back to the remarkable year of 1896, a time characterised by industrial revolution and transformative economic changes. Amid the bustling streets of New York City, the brilliant mind of Charles Dow sparked an idea that would send ripples through the financial world. 

With a mere selection of 12 carefully chosen companies, he crafted what we know today as the Dow Jones Industrial Average (DJIA) – a beacon of brilliance among stock indices. 

Fast-forward to the present day, and these luminous indicators continue to captivate investors and economists alike. They offer a unique glimpse into a country’s economic performance, providing invaluable insights into the ever-changing global financial landscape. 

If you’re interested in understanding how indices trading works, what these indices represent, and how to analyse their price movements, continue reading to explore our detailed guide. 

Understanding Indices 

Indices are numerical representations of the top-performing shares from a particular stock exchange. They provide a snapshot of the exchange’s major players by averaging individual stock movements, consolidating a vast amount of financial activity into a single figure. 

Some of the largest indices in the world are: 

  • Dow Jones (in the US) 
  • Nasdaq (US) 
  • S&P 500 (US) 
  • DAX 40 (in Germany) 
  • CAC (in France) 
  • FTSE (in the UK) 
  • Hang Seng (in Hong Kong) 
  • Nikkei (in Japan) 
  • ASX (in Australia) 

Stock indices can be calculated using two distinct approaches: one involves considering the performance of the largest companies, known as a market capitalisation-weighted average. This method is employed for indices like the S&P 500, FTSE, and ASX, where the movements of high-value companies carry greater influence over the overall index. 

While the majority of stock indices adopt this approach, there are exceptions, and some indices are calculated using a price-weighted average. The Dow Jones and Nikkei are prime examples of indices using this method, where shares with higher prices wield more significant sway. 

Since indices represent the overall stock value of multiple top-performing companies or high-value stocks, they tend to be more volatile compared to individual company stocks, providing both trading opportunities and increased risk for traders. 

What is Index Trading? 

Since indices are just numbers representing the performance of a group of shares on an exchange, they cannot be directly bought or sold. 

Instead, traders need to choose products that mirror their performance, such as: 

  • Index funds
  • Exchange-traded funds (ETFs)
  • Futures
  • Options
  • Contracts for differences (CFDs). 

These products track the underlying index’s price, allowing traders to speculate on whether the index’s price will rise or fall and take positions accordingly. 

Image shows index drops amid the covid-19 outbreak
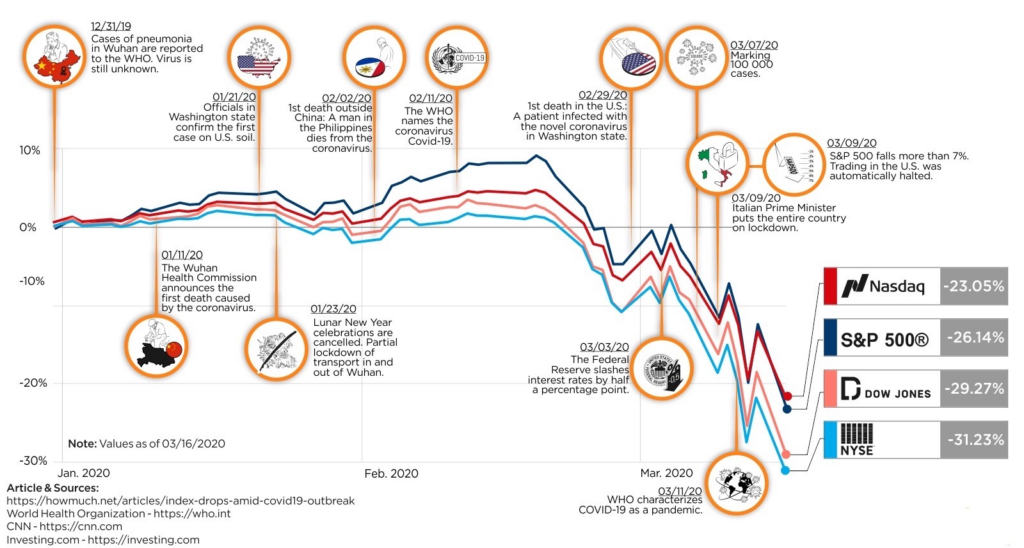
U.S stock indexes drops since 31/12/2019 (as %)
source: howmuch.net

Factors Influencing Index Prices 

Various factors can cause index prices to rise or fall, and understanding these factors is essential for trading indices effectively. These factors include: 

  • General economic news: As indices summarise multiple companies’ stock performances, they serve as indicators of an economy’s health and are influenced by economic news. 
  • Global news: Multinational corporations within local indices are affected by global events, such as pandemics, natural disasters, commodity price fluctuations, supply chain disruptions, and global economic turmoil. 
  • Company financial results: Individual companies’ performance within an index affects the overall index, especially for highly valued companies with significant stock price movements. 
  • Company announcements: Changes in company leadership, mergers, manufacturing updates, and other announcements have broader implications for individual stock prices and the index price. 
  • Index composition changes: Adding or removing companies from an index can impact its overall price and requires traders to reevaluate their positions. 

How to Trade Indices 

When trading stock indices, thorough research, a good understanding of the chosen product, and proper risk management strategies are crucial. Index CFDs are among the most popular trading products. They allow traders to profit from both rising and falling index prices by predicting the price direction accurately. 

Traders can approach index CFDs in two ways: going long or going short. Going long involves buying index trading products when expecting the price to rise, while going short involves selling or closing positions when expecting a price decline. Profit or loss depends on the accuracy of the prediction and the market’s overall movement. 

CFD trading involves leverage, allowing traders to open positions with a small initial deposit (margin) that represents a percentage of the total asset value. While leverage provides exposure to larger markets with less capital, it also carries the risk of incurring losses greater than the initial deposit. Traders should choose suitable strategies for their portfolios when trading CFDs. 

Tips on Successful Trading Indices 

  • Do your research: Before you start trading, it is important to do your research and understand the risks involved. Read books and articles about index trading and watch educational videos. This will help you understand how the market works and how to make informed trading decisions. 
  • Start small: Don’t start trading with a large amount of money. Start with a small amount and gradually increase your investment as you gain experience. This will help you minimise your losses if you make any mistakes. 
  • Use a demo account: VT Markets offers a Demo account [internal link: https://www.vtmarkets.com/get-trading/open-demo-account/] that allow you to trade with virtual money. This is a great way to learn the basics of trading without risking any real money. Once you feel comfortable with the process, you can start trading with real money. 
  • Be patient: Trading indices can be a volatile market, so it is important to be patient and not expect to get rich quick. It takes time and experience to become a successful trader. 
  • Use stop-loss orders: Stop-loss orders are a way to limit your losses. If the price of an index falls below a certain level, your trade will be automatically sold, preventing you from losing more money than you are comfortable with. 
  • Use take-profit orders: Take-profit orders are a way to lock in your profits. If the price of an index rises above a certain level, your trade will be automatically sold, ensuring that you don’t miss out on potential profits. 
  • Don’t trade emotionally: It is important to stay calm and make rational decisions when trading indices. Don’t let your emotions get the best of you, or you will likely make bad trading decisions. 

Starting Index Trading 

To begin trading indices in live markets, follow these steps: 

  • Select your preferred trading method: VT Markets offers indices CFDs, providing opportunities to profit from rising and falling prices. 
  • Choose between cash indices and index futures: Cash indices have tighter spreads and offer on-the-spot trade pricing, suitable for day traders. Index futures are preferred for longer-term views with fewer overnight funding charges. 
  • Create and log in to your trading account: Opening a live account [internal link: https://www.vtmarkets.com/get-trading/forex-trading-account/] with VT Markets is quick and easy. 
  • Choose the index to trade: Select from popular global indices [internal link: https://www.vtmarkets.com/trading/markets/indices/] based on available analysis and market insights. 
  • Decide to go long or short: Choose the direction based on the outlook for the economic sector or domestic market. 
  • Implement risk management strategies: Utilise stop-loss and limit orders to prevent excessive losses. 
  • Open your first position: Seize opportunities by monitoring and closing positions at the right time. 

In conclusion, trading stock indices offers a window into the performance of major companies and economies worldwide. Understanding the factors influencing index prices and utilising products like index CFDs can provide traders with both opportunities and risks. 

With proper research, risk management, and the support of a reliable broker like VT Markets, traders can confidently navigate the exciting world of index trading, diversify their portfolios, and hedge against market fluctuations. Happy trading! 

Summary: 
  • Stock indices represent the overall performance of top-performing shares from specific stock exchanges, providing a snapshot of the economy’s health. 
  • Indices can be calculated using market capitalisation-weighted or price-weighted averages, affecting their volatility and risk levels. 
  • Traders can’t directly buy or sell indices but can trade products like index funds, ETFs, futures, options, and CFDs, mirroring index performance. 
  • Several factors influence index prices, including economic news, global events, company financial results, announcements, and changes in index composition. 
  • Index CFDs are popular trading products that allow traders to profit from both rising and falling index prices with leverage. 
  • Proper research, risk management, and selecting the right trading strategy are crucial for successful index trading. 

Dividend Adjustment Notice – July 24, 2023

Dear Client,

Please note that the dividends of the following products will be adjusted accordingly. Index dividends will be executed separately through a balance statement directly to your trading account, and the comment will be in the following format “Div & Product Name & Net Volume ”.

Please refer to the table below for more details:

The above data is for reference only, please refer to the MT4/MT5 software for specific data.

If you’d like more information, please don’t hesitate to contact [email protected].

Week Ahead: All Eyes on FOMC Meeting Minutes and ECB, BOJ Rate Decisions

The graph displays stocks with an uptrend represented in green, indicating bullish markets.

This week’s economic calendar includes important events that can significantly impact the markets: the FOMC Meeting Minutes, as well as the ECB and BOJ Rate Decisions. Traders should be well-prepared for potential market volatility resulting from these announcements and be ready to adjust their strategies accordingly.

Keep an eye on the following economic releases:

German, UK and US Flash Manufacturing PMI (24 July 2023)

Germany’s Manufacturing PMI experienced a downward revision in June 2023, reaching 40.6. In contrast, the UK’s PMI was revised upward to 46.5, while the US confirmed a PMI of 46.3, marking a six-month low. 

The figures for July 2023 will be released on 24 July. Analysts predict Manufacturing PMIs as follows: Germany at 40, the UK at 46, and the US at 46.

German, UK and US Flash Services PMI (24 July 2023)

US Services PMI was revised slightly higher to 54.4 in June 2023, while Germany’s was confirmed at 54.1, the lowest reading in three months. UK’s was confirmed at 53.7, the lowest in three months. 

Analysts predict Services PMIs for July 2023 as follows: Germany at 53.3, the UK at 53, and the US at 54.

Australia Consumer Price Index (26 July 2023) 

The annual inflation rate in Australia declined to 7% in Q1 2023, falling from an over-30-year high of 7.8% in the previous period. This marked the lowest recorded rate since Q2 2022. 

Looking ahead, analysts are forecasting a slower growth rate of 6.3% for the data covering the year up to June 2023. This information is scheduled for release on 26 July.

US FOMC Meeting Minutes (26 July 2023) 

The Fed decided to maintain its funds rate target at 5.25% in June 2023. Following the FOMC decision, the Fed Chair emphasised multiple times the necessity of raising rates further within the current year. 

For the upcoming meeting on 26 July, analysts forecast that the Fed will raise its interest rates to 5.5%.

European Central Bank Main Refinancing Rate (27 July 2023)

In its June meeting, the European Central Bank (ECB) raised its key interest rates by 25 bps to 4%. The ECB made it clear that future decisions would rely on incoming data and underscored its commitment to adopting a meeting-by-meeting approach in light of the uncertain economic environment, particularly as interest rates were nearing a potential peak level. 

For the upcoming 27 July meeting, analysts expect the central bank to implement another 25 bps increase to 4.25%.

US Advance GDP (27 July 2023)

The US economy expanded at an annualised rate of 2% on a quarter-on-quarter basis in Q1 2023. This growth was higher than the previous second estimate of 1.3%. 

The figures for Q2 2023 will be released on 27 July, with analysts projecting a slower growth rate of 1.9%. 

BOJ Rate Statement (28 July 2023) 

In its June meeting, the Bank of Japan decided to maintain its key short-term interest rate at -0.1% and kept the 10-year bond yields at 0%

For its upcoming meeting on 28 July, analysts anticipate the central bank to maintain the current interest rate levels.

Notification of Server Upgrade – July 21, 2023

Dear Client,

As part of our commitment to provide the most reliable service to our clients, there will be server maintenance this weekend.

Maintenance Hours :
22nd of July 2023 (Saturday) 02:00 – 07:00 (GMT+3)

Please note that the following aspects might be affected during the maintenance:

1. The price quote and trading management will be temporarily disabled during the maintenance. You will not be able to open new positions, close open positions, or make any adjustments to the trades.

2. There might be a gap between the original price and the price after maintenance. The gaps between Pending Orders, Stop Loss and Take Profit will be filled at the market price once the maintenance is completed.

3. Please refer to MT4/MT5 for the latest update on the completion and market opening time. Our services will be back online once the maintenance is completed.

Thank you for your patience and understanding about this important initiative.

If you’d like more information, please don’t hesitate to contact [email protected].

Dividend Adjustment Notice – July 21, 2023

Dear Client,

Please note that the dividends of the following products will be adjusted accordingly. Index dividends will be executed separately through a balance statement directly to your trading account, and the comment will be in the following format “Div & Product Name & Net Volume ”.

Please refer to the table below for more details:

The above data is for reference only, please refer to the MT4/MT5 software for specific data.

If you’d like more information, please don’t hesitate to contact [email protected].

Dow Jones Rises on Johnson & Johnson’s Earnings Beat, While Netflix and Tesla Struggle

The Dow Jones Industrial Average continued its impressive winning streak for the ninth consecutive day, fueled by the better-than-expected earnings results of pharmaceutical giant Johnson & Johnson. With a 6% rise in Johnson & Johnson’s shares, the Dow recorded its best daily performance since 2017. Additionally, insurer Travelers surpassed revenue expectations for the quarter, contributing to the Dow’s overall gains.

However, the broader market faced challenges as post-earnings declines hit popular tech stocks like Netflix and Tesla. Netflix’s revenue fell short of analysts’ estimates, causing a more than 8% drop in its stock value, despite a positive year leading up to the report. Meanwhile, Tesla’s shares tumbled by 9.7% after CEO Elon Musk announced a slowdown in vehicle production during the third quarter for factory improvements.

Overall, corporate earnings have shown strength, with 74% of S&P 500 companies surpassing expectations. This has generated optimism for a favorable economic outlook, despite concerns from some about a potential bear market rally. The Dow’s outperformance compared to the tech-heavy Nasdaq 100 index marked a significant trend, emphasizing the market’s current dynamics.

Data by Bloomberg

On Thursday, the market declined by 0.68%. Utilities, Health Care, and Energy sectors showed gains of 1.85%, 1.65%, and 1.29%, respectively. Information Technology and Communication Services sectors experienced the most significant declines, dropping by 2.04% and 2.49%, while Consumer Discretionary sector faced the largest setback, declining by 3.40%.

Major Pair Movement

On Thursday, the dollar index rose by 0.6% as positive jobless claims and Philly Fed data boosted Treasury yields, leading to a risk-off sentiment in the market. The Nasdaq declined by about 2% as investors turned cautious. The dollar’s recovery was driven by its earlier decline in July, caused by hopes of U.S. disinflation, despite steady core PCE figures.

The dollar’s gains were fueled by the Bank of Japan’s Governor dismissing tightening speculation, doubts raised by an ECB hawk about multiple rate hikes, and below-forecast UK CPI affecting BoE rate hike expectations. The EUR/USD fell by 0.67% due to Germany’s real estate crisis and uncertainty surrounding China’s efforts to boost the yuan and economic growth. Sterling sank by 0.6%, testing BoE rate hike expectations. USD/JPY gained 0.33%, but caution remains ahead of Japan’s CPI report. The AUD/USD’s earlier gains were trimmed amid dollar strength and derisking despite solid jobs data and PBoC’s action to weaken USD/CNY.

Picks of the Day Analysis

EUR/USD (4 Hours)

EUR/USD Falls on Stronger US Dollar Ahead of Fed and ECB Meetings

The EUR/USD pair experienced its second consecutive daily decline and worst daily loss in a month as the US Dollar gained strength, pushing the pair towards 1.1100. Market participants are closely monitoring next week’s Federal Reserve (Fed) and European Central Bank (ECB) meetings, which have contributed to short-term momentum favoring the Dollar. Data on both sides, including improved consumer sentiment in the Euro area and tight US labor market indicators, influenced the Dollar’s rise and bond yields on both sides of the Atlantic.

Chart EURUSD by TradingView

According to technical analysis, the EUR/USD pair is moving lower on Thursday creating a push to the lower band of the Bollinger Band and creating a wider gap between the bands. The Relative Strength Index (RSI) is currently at 37, suggesting that the EUR/USD pair has the potential of moving lower.

Resistance: 1.1208, 1.1291

Support: 1.1086, 1.0977

XAU/USD (4 Hours)

XAU/USD Slides as US Dollar Gains Ground: Fed Policy Decision Looms

On Thursday, the XAU/USD pair experienced a decline to $1,965.30 per troy ounce as the US Dollar strengthened. The Dollar Index (DXY) surged towards 101.00, prompted by an upward correction after a consolidative phase at multi-month lows. Market sentiment for XAU/USD was mixed, with initial pessimism during Asian trading hours but a return to optimism in the American afternoon. While Wall Street saw mixed trades, only the Dow Jones Industrial Average remained in the green, while rising Treasury yields provided additional support to the USD. Market participants assessed a range of US data ahead of the Federal Reserve (Fed) monetary policy decision, which includes an anticipated 25 basis points (bps) rate hike as indicated by the Federal Open Market Committee (FOMC) dot-plot.

Chart XAUUSD by TradingView

According to technical analysis, the XAU/USD pair moved lower on Thursday and managed to reach the middle band of the Bollinger Bands. Currently, the price is slightly below the middle band, indicating a potential move towards the lower band. Additionally, the Relative Strength Index (RSI) is at 53, suggesting that the XAU/USD pair has returned to a neutral stance.

Resistance: $1,992, $2,013

Support: $1,970, $1,954

Dividend Adjustment Notice – July 20, 2023

Dear Client,

Please note that the dividends of the following products will be adjusted accordingly. Index dividends will be executed separately through a balance statement directly to your trading account, and the comment will be in the following format “Div & Product Name & Net Volume ”.

Please refer to the table below for more details:

The above data is for reference only, please refer to the MT4/MT5 software for specific data.

If you’d like more information, please don’t hesitate to contact [email protected].

Stocks Rise as Earnings Season Kicks Off with Dow’s Longest Winning Streak in Four Years

Stocks showed positive momentum on Wednesday during the ongoing corporate earnings season, with the Dow Jones Industrial Average achieving its longest winning streak in nearly four years. The Dow closed 0.31% higher, at 35,061.21 points, marking its eighth consecutive day of gains, a feat not seen since September 2019. The S&P 500 also climbed 0.24% to 4,565.72, while the Nasdaq Composite edged up 0.03% to finish at 14,358.02. The current earnings season has shown promising results, with 78% of S&P 500 companies surpassing expectations, signaling an optimistic outlook for a potential soft-landing scenario as inflation data remains encouraging.

Goldman Sachs reported mixed results on profit and revenue, primarily influenced by losses in real estate and GreenSky. Despite the anticipated lackluster quarter, Goldman’s shares gained nearly 1%. Other major companies, including U.S. Bancorp and J.B. Hunt, experienced notable stock jumps of about 6.5% and 3.7%, respectively. Additionally, as prominent firms such as Netflix, Tesla, IBM, and United Airlines prepare to release their earnings, the market remains hopeful for continued positive outcomes. The positive sentiment was further boosted by Carvana, a used car retailer, which saw its shares surge by 40% after securing a deal to reduce its debt, and releasing its quarterly earnings report ahead of schedule.

Data by Bloomberg

On Wednesday, all sectors in the market showed an overall increase of 0.24%. The real estate sector experienced the highest gain, rising by 1.12%, followed by utilities, which increased by 1.02%. Consumer staples also performed well with a rise of 0.93%, while both the energy and consumer discretionary sectors saw a moderate increase of 0.52%. Health care and financials sectors followed closely with gains of 0.50% and 0.45% respectively. The communication services sector showed a more modest growth of 0.23%.

However, not all sectors had a positive day, as some faced declines. The industrials sector experienced a slight decrease of -0.05%, while the information technology sector saw a more significant decline of -0.27%. The materials sector had the largest decline among all sectors, with a drop of -0.52%. Overall, the market exhibited a mix of positive and negative performances across different sectors on Wednesday.

Find out Share CFDs with VT Markets

Major Pair Movement

The dollar index saw a rise of 0.34%, largely driven by a significant 0.85% drop in sterling. This decline in sterling led to a sharp decrease in BoE policy rate pricing and gilts yields. The oversold dollar had been rebounding since its collapse in July and gained traction after finding support at the midpoint of its previous advance. As a result, two-year gilts yield fell 20bp, and the expectation for a 50bp August BoE hike was repriced to just 25bp, with the likelihood of a following hike now in doubt. On the other hand, two-year Treasury yields remained flat, and the Fed’s next rate hike is priced at 25bp next week, with only a 28% probability of another hike before rate cuts in 2024. EUR/USD also fell 0.25%.

Looking ahead, Thursday’s below-forecast U.S., UK, and Canadian inflation data may bring increased focus on the Fed’s mandate for maximum employment. If initial and continued claims remain above forecast, it could strengthen the dollar’s bearish outlook. However, initial claims remain relatively low compared to historical levels. Meanwhile, the yen rose 0.52%, facing resistance at 140 due to a series of large 140 options expiring in the coming week. The dollar’s rebound and lingering uncertainty influenced the Australian dollar and yuan, both of which saw declines of 0.6% and 0.5% respectively. Upcoming events include Philly Fed, existing home sales, leading indicators on Thursday, and Japan’s CPI report on Friday.

Picks of the Day Analysis

EUR/USD (4 Hours)

EUR/USD Pair Holds Steady Despite Mixed Economic Data in EU and US

The EUR/USD pair experienced slight downward movement on Wednesday, reaching a low of 1.1173 before settling just below the 1.1200 threshold by the end of the day. The Euro was supported above 1.1200 during the first half of the day due to positive European data, with the Eurozone confirming a 5.5% YoY increase in the June Harmonized Index of Consumer Prices (HICP), meeting preliminary estimates. Additionally, the European Union’s annual inflation rate in June decreased to 6.4% from May’s 7.1%. Meanwhile, financial markets remained optimistic during the American session, despite discouraging US macroeconomic figures, which showed a 3.7% decline in June Building Permits and an 8% decrease in Housing Starts for the same month. The Greenback gained momentum after Wall Street’s opening, even as US indexes extended their rallies, with the Dow Jones Industrial Average rising for a seventh consecutive session, and the Nasdaq Composite and S&P 500 up for the third straight day. On Thursday, the macroeconomic calendar will feature the June German Producer Price Index (PPI) and Eurozone May Current Account, along with July Consumer Confidence data. Meanwhile, the US is set to publish weekly unemployment figures and June Existing Home Sales.

Chart EURUSD by TradingView

According to technical analysis, the EUR/USD pair is currently experiencing a period of consolidation, with limited movement and a narrower gap between the upper and lower bands of the Bollinger Bands. The Relative Strength Index (RSI) is currently at 58, suggesting that the EUR/USD pair has returned to a neutral stance.

Resistance: 1.1291, 1.1382

Support: 1.1173, 1.1086

XAU/USD (4 Hours)

XAU/USD Prices Slightly Down as US Dollar Rebounds on Easing Global Inflation

Gold prices experienced a modest decline on Wednesday, as the US Dollar regained demand due to recent oversold conditions and its inability to continue last week’s downward trend. Despite the dollar’s resurgence, global financial markets remained optimistic as inflation showed signs of easing, with the UK’s annual Consumer Price Index rising below market expectations and the Eurozone’s Harmonized Index of Consumer Prices also showing a modest increase. Global stocks continued to perform well, with US indexes posting significant gains for the third consecutive day and government bond yields easing, which tempered the bullish potential for XAU/USD. As a result, the precious metal traded at around $1,974 per troy ounce.

Chart XAUUSD by TradingView

According to technical analysis, the XAU/USD pair moved higher on Wednesday and managed to reach the upper band of the Bollinger Bands. Currently, the price is slightly below the upper band, indicating a potential move towards the middle band. Additionally, the Relative Strength Index (RSI) is at 75, suggesting that the XAU/USD pair has returned to a bullish sentiment.

Resistance: $1,992, $2,013

Support: $1,970, $1,954

Economic Data

CurrencyDataTime (GMT + 8)Forecast
AUDEmployment Change09:3032.6K (Actual)
AUDUnemployment Rate09:303.5% (Actual)
USDUnemployment Claims20:30239K

Dividend Adjustment Notice – July 19, 2023

Dear Client,

Please note that the dividends of the following products will be adjusted accordingly. Index dividends will be executed separately through a balance statement directly to your trading account, and the comment will be in the following format “Div & Product Name & Net Volume ”.

Please refer to the table below for more details:

The above data is for reference only, please refer to the MT4/MT5 software for specific data.

If you’d like more information, please don’t hesitate to contact [email protected].

Strong Corporate Earnings Propel Dow Jones to New Highs

In a positive turn for investors, the Dow Jones Industrial Average soared on Tuesday as traders reacted to impressive corporate earnings reports. The Dow closed the day with a gain of 366.58 points, marking a 1.06% increase and reaching a new high of 34,951.93. Similarly, the Nasdaq Composite rose by 0.76% to end at 14,353.64, while the S&P 500 recorded a 0.71% gain, closing at 4,554.98. This remarkable performance resulted in the Dow’s seventh consecutive day of gains and the longest winning streak since March 2021, with all three major indexes achieving their highest closes since April 2022.

The positive earnings reports were led by Bank of America, which exceeded expectations for the second quarter due to higher interest rates, resulting in a more than 4% increase in the bank’s shares. Bank of New York Mellon also reported better-than-expected earnings, contributing to the upward momentum in the market. Other notable companies, such as Morgan Stanley and PNC Financial, saw their stocks rise following strong revenue and earnings performances. As the earnings season progresses, it is worth noting that a significant 84% of the S&P 500 companies that have reported have surpassed profit estimates, according to FactSet.

Despite softer data from the Commerce Department, including a modest increase of 0.2% in advance retail sales for June, investors remain optimistic. The positive sentiment stems from the belief that recent inflation data supports the likelihood of a soft-landing scenario, easing concerns of an imminent interest rate hike by the Federal Reserve. As a result, the stock market continues its rally, providing a positive outlook for investors in the near term.

Data by Bloomberg

On Tuesday, the overall market saw a positive performance with a gain of 0.71%. The Information Technology sector led the way with a significant increase of 1.26%, followed closely by Financials, which rose by 1.12%. Energy and Materials sectors also performed well, gaining 0.98% and 0.78% respectively. Health Care and Industrials sectors experienced moderate growth with gains of 0.70% and 0.57% respectively. Communication Services and Consumer Discretionary sectors had smaller gains of 0.38% and 0.28% respectively. On the other hand, Consumer Staples sector showed a slight decline of 0.13%. Utilities and Real Estate sectors experienced losses of 0.78% and 0.82% respectively.

Overall, it was a positive day for most sectors, particularly Information Technology and Financials, while Utilities and Real Estate sectors faced some decline.

Major Pair Movement

The dollar index managed to recover from its recent 13-month lows, halting the decline in Treasury yields that followed the release of the Consumer Price Index (CPI) data. Initially, the dollar dipped briefly after U.S. retail sales rose by 0.2%, falling short of the 0.5% forecast. However, the May figures were revised upward, and the control group, which feeds into the GDP calculation, saw a 0.6% increase, double the forecast and with a revised higher figure for May. This positive data reassured investors that the economy was performing well and eased concerns about the Federal Reserve tightening its monetary policy excessively. Consequently, the dollar and Treasury yields rebounded, with two-year Treasury yields rising by 2 basis points after a previous 9 basis point fall, while two-year bund yields fell by 9.4 basis points.

The divergence between two-year bund and Treasury yields had already begun to affect EUR/USD prices since Thursday, contributing to the retreat from 13-month highs observed on Tuesday. The upcoming Federal Reserve and European Central Bank meetings will provide further guidance to the markets, which are currently pricing in a peak in Fed rates this month and a faster decline in ECB rates next year. Despite hitting a high of 1.1276 on EBS, EUR/USD slid and failed to close above the 61.8% Fibonacci retracement level of the 2021-2022 decline at 1.1271. Meanwhile, the yen rebounded sharply against other currencies after Bank of Japan (BoJ) Governor Haruhiko Kuroda dashed hopes of a JGB yield cap increase. The recovery of the yen crosses has been struggling to regain the uptrend line from March, which was broken below last week and currently stands at 139.51. The importance of Japan’s Consumer Price Index data, scheduled for release on Thursday, has been reduced due to Ueda’s stance.

In the currency markets, the pound depreciated by 0.25%, influenced by a drop of approximately 10 basis points in gilts yields and a correction in the pound’s overbought readings, which were at their highest level in nearly three years. These developments occurred ahead of the upcoming UK employment data, which could impact the decision between a 25 basis point or 50 basis point rate hike at the Bank of England’s August meeting.

Picks of the Day Analysis

EUR/USD (4 Hours)

EUR/USD Remains Steady Within Limited Range Despite Positive Wall Street Earnings

The EUR/USD pair maintained a narrow trading range on Tuesday, reaching a yearly high of 1.1275. Initially, the US Dollar benefited from a negative market sentiment in the first half of the day, but the mood shifted with the release of positive Wall Street earnings reports. While the Eurozone did not publish significant figures, the United States unveiled mixed data, including modest Retail Sales and declining Industrial Production. On Wednesday, market focus turns to the final estimates of the June Harmonized Index of Consumer Prices (HICP) in the EU, while the United States prepares to release June Housing Starts and Building Permits.

Chart EURUSD by TradingView

According to technical analysis, the EUR/USD pair is currently experiencing a period of consolidation, with limited movement and a narrower gap between the upper and lower bands of the Bollinger Bands. The Relative Strength Index (RSI) is currently at 58, suggesting that the EUR/USD pair has returned to a neutral stance.

Resistance: 1.1291, 1.1382

Support: 1.1173, 1.1086

XAU/USD (4 Hours)

XAU/USD Prices Driven by Worsened Market Mood as US Dollar Temporarily Strengthens

The XAU/USD pair experienced an upward trajectory on Tuesday, reaching $1,972.17 per troy ounce in the European session due to a deteriorating market sentiment. Although the US Dollar saw some short-term demand prior to Wall Street’s opening and after the release of mixed US data, it quickly resumed its climb, surpassing the mentioned high and reaching a fresh 2023 high of around $1,984.35. The US Census Bureau reported that Retail Sales in the US increased by 0.2% MoM in June, falling short of market expectations. However, the Retail Sales Control Group exceeded predictions with a growth of 0.6%. Despite these figures, US equities surged, placing additional downward pressure on the American currency, particularly propelled by better-than-expected earnings reports from major banks, driving the Dow Jones Industrial Average to new yearly highs around 35,000.

Chart XAUUSD by TradingView

According to technical analysis, the XAU/USD pair moved higher on Tuesday and managed to reach the upper band of the Bollinger Bands. Currently, the price is slightly below the upper band, indicating a potential move towards the middle band. Additionally, the Relative Strength Index (RSI) is at 68, suggesting that the XAU/USD pair has returned to a bullish sentiment.

Resistance: $1,984, $2,001

Support: $1,962, $1,939

Economic Data

CurrencyDataTime (GMT + 8)Forecast
NZDCPI q/q06:451.1% (Actual)
GBPCPI y/y14:008.2%
USDHousing Starts20:301.48M
Back To Top
server

Hai 👋

Bagaimana saya boleh membantu?

Segera berbual dengan pasukan kami

Chat Langsung

Mulakan perbualan secara langsung melalui...

  • Telegram
    hold Ditangguh
  • Akan datang...

Hai 👋

Bagaimana saya boleh membantu?

telegram

Imbas kod QR dengan telefon pintar anda untuk mula berbual dengan kami, atau klik di sini.

Tidak ada aplikasi Telegram atau versi Desktop terpasang? Gunakan Web Telegram sebaliknya.

QR code