Back

How to Trade Coffee: A Comprehensive Guide 

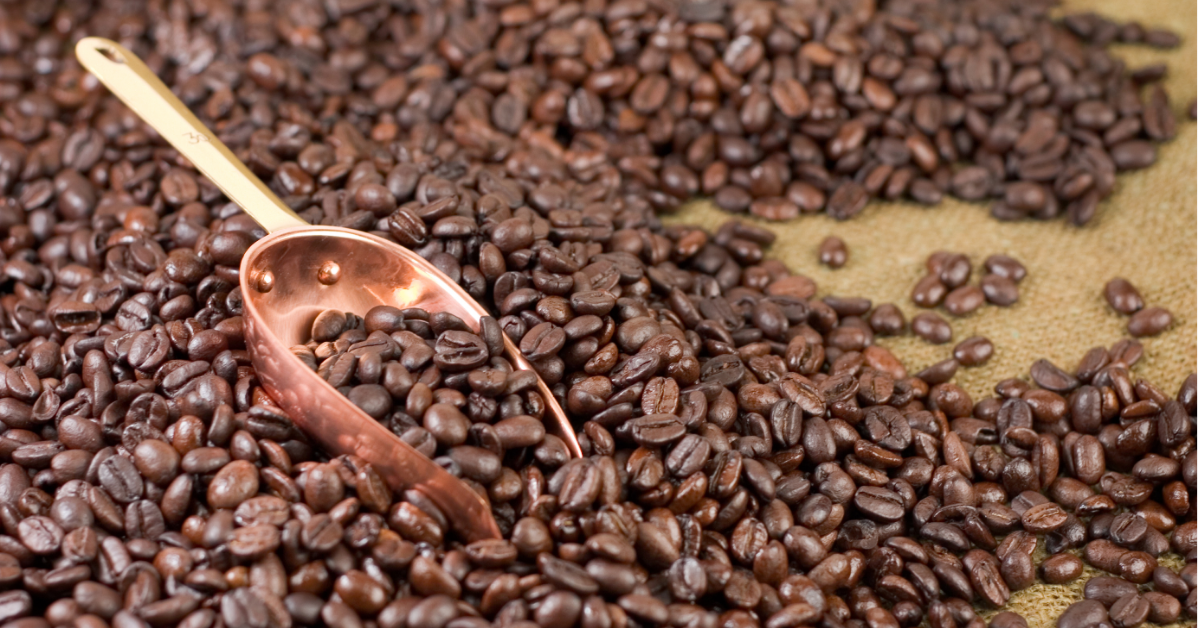
The coffee industry, valued at over 100 billion US dollars annually, boasts a thriving global market and is regarded as one of the most highly traded and consumed soft commodities worldwide. Coffee trading presents lucrative opportunities for traders, as it can be influenced by various external factors, including the prices of other commodities. 

In this article, we will explore the process of trading coffee, delve into its historical significance as a soft commodity, and analyse the factors that impact its price, while also discussing the available trading options. 

The Historical Background of Coffee Trading 

Coffee, classified as a soft commodity, is an agricultural product that shares similarities with other crops. Unlike hard commodities, which are extracted or mined, coffee is grown naturally. 

It has been an essential part of diets across the globe for centuries. Originating in the Middle East, coffee gained popularity as a beverage in the 15th century

European merchants discovered the flavourful bean in the 17th century, leading to the emergence of coffee trading. Merchants often gathered in coffee houses, which served as meeting places for trade discussions. 

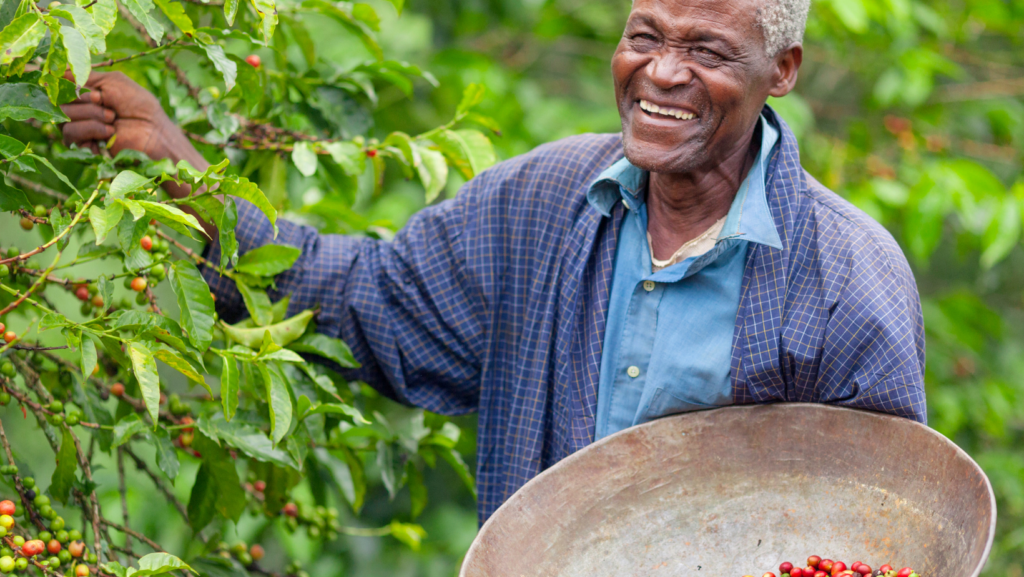
Over time, coffee plantations established by European colonists transformed into modern coffee suppliers. Today, the industry produces approximately 170 million bags of coffee beans each year, offering significant potential for traders. 

Distinct Coffee Varieties 

The global coffee trade primarily revolves around two main types of coffee: Arabica and Robusta. These varieties possess unique flavours and are influenced by external factors that impact their respective prices. To determine which type of coffee to trade, it is crucial to comprehend the factors that affect the price of each variety. 

source: coffeefriend.co.uk
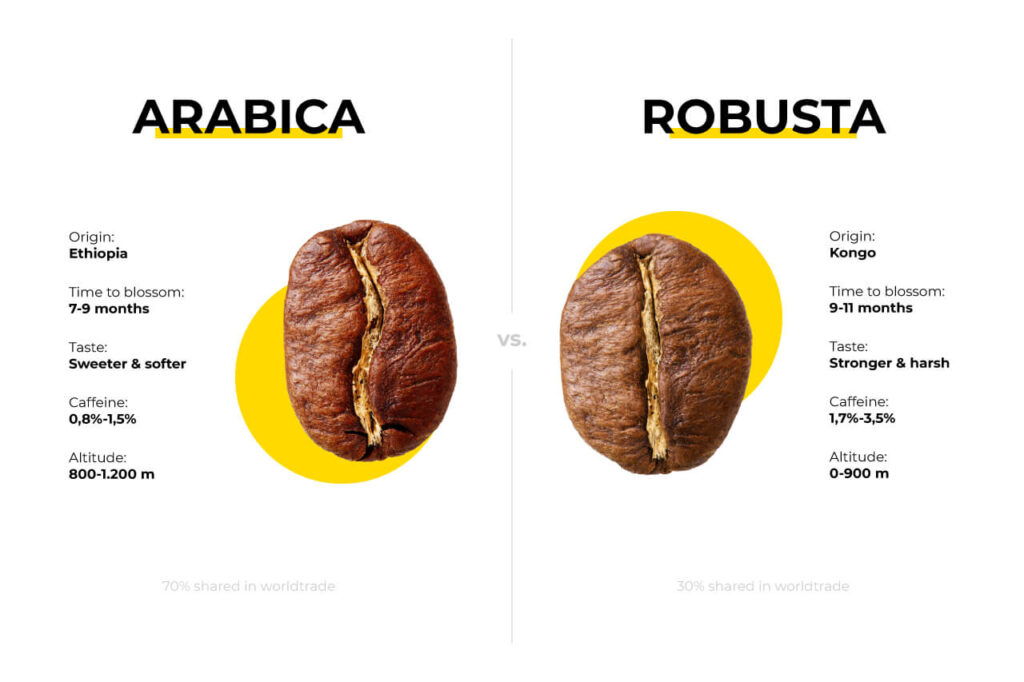
  • Arabica coffee, renowned for its superior quality, is favoured by cafe chains and features prominently in high-quality roasted coffee blends. Despite the common perception that Arabica is consistently more expensive than Robusta, this is not always the case.  Arabica beans account for 60-70% of the world’s coffee supply and are predominantly sourced from Brazil and Colombia. Arabica coffee tends to exhibit more stable price fluctuations. 
  • Robusta coffee, distinguished by its higher caffeine content, thrives in warmer climates and at lower altitudes compared to Arabica. It generally possesses a more bitter and earthy flavour profile, in contrast to Arabica’s acidity and fruitiness. 

Robusta accounts for around 30% of the coffee trading market and often trades at higher prices due to its demand among multinational corporations like Nestlé, which utilise the beans in global product lines such as Nescafé instant coffee. Vietnam is the primary producer of Robusta beans. 

Coffee Cultivation Regions 

The specific geographic conditions necessary for coffee cultivation define the “coffee belt.” This belt extends from the equator to the Tropic of Cancer in the north and the Tropic of Capricorn in the south. 

source: shopify.com

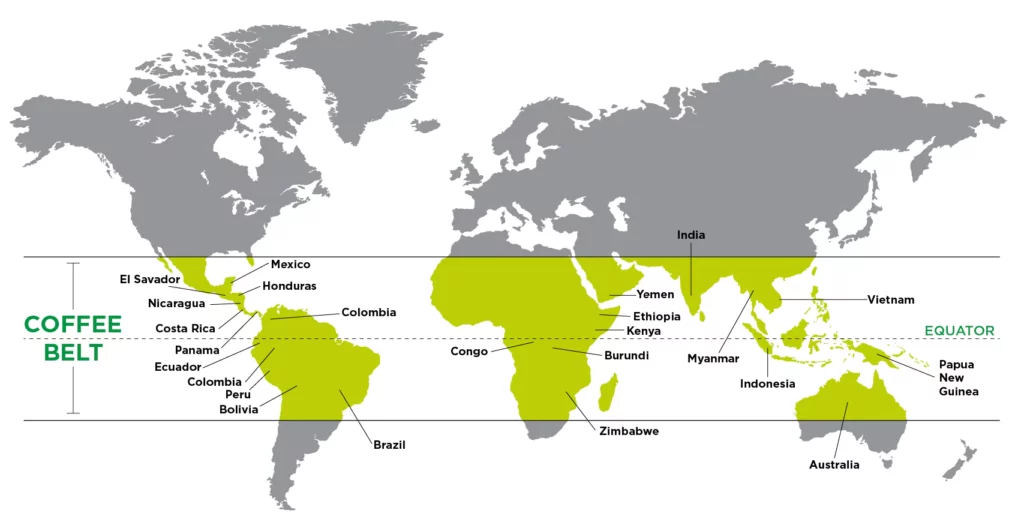
Although coffee of various types can be grown at different altitudes, the major coffee-producing nations include Brazil, Vietnam, Colombia, Indonesia, and Ethiopia. 

Coffee trading occurs worldwide, with the largest importers of beans being the European Union, the United States, Japan, Russia, and Canada. 

Given the multifaceted process of growing, harvesting, roasting, and transporting coffee, the coffee trade is subject to speculation and influenced by numerous factors that affect its price. Gaining familiarity with these fundamental aspects of the market is essential to master coffee trading. 

Factors Influencing Coffee Prices 

The intricate nature of coffee production, which involves planting, growth, and harvesting, means that multiple factors must align for coffee to reach the market successfully and be traded. 

Unexpected triggers can swiftly disrupt the coffee trading market, resulting in volatility. While volatility offers short-term profit opportunities for traders, those seeking stability may prefer to engage in coffee trading with a more consistent price index, utilising trends as guidance. 

  • Climate: Unforeseen climate conditions, such as frost, floods, or droughts, can devastate crops, driving up prices as suppliers struggle to meet demand. Conversely, favourable weather can result in an oversupply of coffee beans, causing prices to plummet. 
  • Consumer habits: Contemporary consumer preferences and evolving coffee culture impact the demand side of coffee trading. Specialised coffee varieties and concerns about caffeine’s effects and addictive properties have influenced prices. Additionally, during financial downturns or reduced consumer spending, the coffee trade may be negatively affected. 
  • Plant disease: Coffea plants are susceptible to climate and disease, with fungal infections like “coffee leaf rust” posing significant risks. Robusta coffee, being more resilient in the face of such diseases, can affect the prices of both major coffee bean types. 
  • Oil market: The prices of coffee transportation are influenced by the oil market, given that major coffee producers (e.g., Colombia, Brazil, and Vietnam) are located far from the main coffee-consuming regions. Spikes in oil prices subsequently impact coffee trading costs. 
  • Distribution costs: Apart from transportation-related expenses, shipping and freight costs also play a role in the coffee trade’s dynamics and overall pricing. 
  • Geopolitics: Geopolitical issues and instabilities in coffee-producing developing nations, which constitute a significant portion of the global supply, can cause price fluctuations. Similarly, political crises in major consumer nations can drive changes in demand. For instance, the Russia-Ukraine war has impacted Russia’s coffee consumption. 
  • US dollar: Like many commodities markets, coffee trading is priced in US dollars. Fluctuations in the value of the US currency consequently influence the commodity’s price. 

Coffee Trading Methods 

For those interested in coffee trading, selecting a preferred trading method is the first step. 

  • Spread betting on coffee: This financial derivative allows speculation on coffee’s price movements as an asset. Spread betting on coffee is tax-free in the UK and particularly suitable for short-term trading. 
  • Coffee CFDs: Similar to spread betting, trading coffee CFDs involves trading the difference between the opening and closing positions of a contract, reflecting the coffee market’s price movements. At the contract’s end, the parties exchange the difference, resulting in either profit or loss. Coffee CFDs are taxable in the UK and involve leveraging or margin rate trades, offering the potential for increased profits but also carrying higher risks of losses. 
  • Coffee futures: Trading coffee futures is a popular method that capitalises on the volatility of the coffee market. This approach establishes an exchange at a predetermined future date for a fixed price, enabling traders to benefit from market movements. 

Ready to Begin Coffee Trading? 

VT Markets provides a user-friendly trading environment, simplifying the process of starting your coffee trading journey. 

You can initiate your coffee trading experience by signing up for a free demo account, allowing you to practice trading coffee CFDs and futures on a risk-free platform for 90 days. 

Alternatively, you can create a live trading account to jump straight into the action. 

If you need guidance on opening your coffee trading account or wish to establish your trading portfolio, feel free to contact us. We are here to assist you in embarking on your trading endeavours. 

Summary: 
  • Coffee trading is a highly profitable market worth over 100 billion US dollars annually. 
  • Coffee, a soft commodity, has a rich history as an agricultural product and has been traded for centuries. 
  • Arabica and Robusta are the main types of coffee traded globally, each with its own flavour profile and price dynamics. 
  • Coffee is primarily grown in the “coffee belt,” with major producers including Brazil, Vietnam, Colombia, Indonesia, and Ethiopia. 
  • Various factors influence coffee prices, such as climate conditions, consumer habits, plant diseases, the oil market, distribution costs, geopolitics, and the value of the US dollar. 
  • Traders can engage in coffee trading through spread betting, coffee CFDs, or coffee futures. 

Calculating Pips with Confidence: A Practical Guide for Forex Traders

Imagine you’re at a bustling street market in a foreign country, excited to exchange your currency for the local one. As you approach the currency exchange booth, you notice that the exchange rates are constantly changing. 

Every time you see the rates fluctuate, even by the tiniest amount, it affects the amount of money you’ll receive in return. That’s where the concept of pips comes into play in the world of Forex trading. 

source: CNBC

What is a Pip? 

In the world of Forex trading, a pip is the equivalent of the change you witnessed at the currency exchange booth. It stands for “Percentage in Point.” 

A pip represents the smallest unit of price movement in a currency pair. Just like the ever-changing exchange rates at the booth, pips indicate the shifts in currency values that traders monitor closely. 

Let’s take an example to illustrate this further. Consider the popular EUR/USD currency pair. If the exchange rate for EUR/USD moves from 1.2000 to 1.2001, it means a change of 1 pip. This seemingly small alteration carries significant meaning in the Forex market. 

Understanding Pipettes 

Now, you might wonder if there’s a way to measure even smaller changes in currency values. That’s where pipettes come into play. 

Imagine you’re looking at the EUR/USD pair again, and this time, the exchange rate moves from 1.20000 to 1.20001. This indicates a change of 1 pipette. Pipettes allow for more precise measurements, giving traders a finer level of detail when analysing currency movements. 

In most cases, there are 10 pipettes in one pip. By differentiating between pips and pipettes, traders can gain a more accurate understanding of price fluctuations in the Forex market. 

The Role of Pips in Forex Trading 

Pips play a vital role in Forex trading, acting as the key to unlocking profits and managing risks. They help determine the relative value and volatility of different currency pairs. Let’s explore their significance further through some examples. 

Consider major currency pairs like the EUR/USD or GBP/USD. These pairs typically have small pip values, usually around 0.0001. On the other hand, cross currency pairs, such as the EUR/GBP or GBP/JPY, might have higher pip values, such as 0.001 or more. 

When trading, it’s crucial to be able to read and understand pip values on trading platforms. Most platforms automatically display pip values for currency pairs, allowing you to assess potential gains or losses accurately. 

Don’t underestimate the significance of even small changes in pip values. A seemingly minor movement of just a few pips can have a notable impact on your trades, especially when trading larger positions or utilising leverage. 

Pips and Lot Sizes 

Now that we’ve explored pips, let’s discuss their relationship with lot sizes. In Forex trading, a lot refers to the standardised quantity of a currency pair that you trade. Different lot sizes are available, including standard (100,000 units), mini (10,000 units), and micro (1,000 units). 

The size of your lot determines the pip value. As the lot size increases, so does the pip value. For example, if the pip value for one standard lot is $10, the pip value for one mini lot would be $1, and for one micro lot, it would be $0.10. 

Understanding lot sizes is crucial for managing risk effectively. Aligning your lot size with your risk tolerance and account size allows for better control over potential gains and losses. 

Pip Spreads and Trading Costs 

Pip spreads refer to the difference between the bid price (selling price) and the ask price (buying price) of a currency pair. It represents the cost of entering or exiting a trade. Brokers usually earn their profits from spreads. 

For example, if the bid price for EUR/USD is 1.2500, and the ask price is 1.2502, the spread would be 2 pips. Understanding and comparing spreads among different brokers is important to optimise your trading costs. 

Trading costs, including spreads, affect your overall profitability. Tighter spreads can be advantageous, especially for frequent traders or those executing scalping strategies. Try VT Markets RAW ECN Account with spreads starting from 0.0 pips. 

Pip Calculations and Pipettes in Practice 

Calculating pip values is essential to assess potential profits or losses. Let’s go through a step-by-step guide: 

  • Step 1. Identify the currency pair you’re trading and its exchange rate. 
  • Step 2. Determine the pip value by considering the lot size and the pip value for that particular currency pair. 
  • Step 3. Incorporate pipettes if necessary. For instance, if a currency pair has a pipette value of 0.1, the pip value would be ten times smaller than a regular pip. 

Practicing pip calculations using different currency pairs and lot sizes will enhance your understanding and proficiency in this fundamental aspect of trading. 

Practical Tips for Pip Management 

To effectively manage pips and optimise your trading strategy, consider the following tips: 

  • Set realistic profit targets based on pip values and market conditions. 
  • Understand the risk-to-reward ratio before entering a trade to ensure favourable risk management. 
  • Utilise stop-loss and take-profit orders to automate trade exits at predetermined levels, protecting your capital and securing profits. 
  • Manage leverage cautiously, as it amplifies both profits and losses based on pip movements. 

By implementing these practical tips, you’ll develop a disciplined approach to trading and enhance your overall success rate. 

In conclusion, pips are the building blocks of measuring price movements, determining profits and losses, and managing risk. Remember to practice pip calculations and familiarise yourself with various currency pairs to become a proficient trader. Stay curious, keep learning, and may your trading journey be filled with pips of success! 

Summary: 
  • Pips represent the smallest unit of price movement in Forex trading, indicating changes in currency values. 
  • Pipettes are fractional pips that allow for more precise measurements of price movements. 
  • Pips play a crucial role in determining profits and losses, and their values vary among currency pairs. 
  • Pip spreads represent the difference between buying and selling prices and impact trading costs. 
  • Practical tips for pip management include setting realistic profit targets, understanding risk-to-reward ratio, using stop-loss and take-profit orders, and managing leverage carefully. 

Dividend Adjustment Notice – July 18, 2023

Dear Client,

Please note that the dividends of the following products will be adjusted accordingly. Index dividends will be executed separately through a balance statement directly to your trading account, and the comment will be in the following format “Div & Product Name & Net Volume ”.

Please refer to the table below for more details:

The above data is for reference only, please refer to the MT4/MT5 software for specific data.

If you’d like more information, please don’t hesitate to contact [email protected].

Wall Street Prepares for Earnings Season Amidst Optimism and Economic Uncertainty

In a positive start to the week, stock markets experienced gains as Wall Street braced itself for the release of quarterly reports from major global companies. The Dow Jones Industrial Average reached its highest closing level in 2023, adding 76.32 points (0.22%) to close at 34,585.35. The S&P 500 climbed 0.39% to end the session at 4,522.79, and the Nasdaq Composite advanced 0.93% to 14,244.95. Notably, tech-giant Apple saw a 1.7% increase, Tesla climbed 3.2%, and JPMorgan Chase shares ticked up 2.4%.

The second-quarter earnings season gains momentum this week, with notable reports from major financial institutions like Bank of America, Morgan Stanley, and Goldman Sachs, along with companies such as United Airlines, Las Vegas Sands, Tesla, and Netflix. Analysts anticipate a challenging season, with a projected decline of over 7% in S&P 500 earnings compared to the previous year. Additionally, as the Federal Reserve enters its “blackout period” before its July policy meeting, traders are expecting a 97% likelihood of interest rate hikes later this month, after pausing them in June.

Despite concerns over profitability and economic performance, the stock market experienced a winning week, with the Dow Jones Industrial Average gaining 2.3%, its best weekly gain since March. The S&P 500 and Nasdaq Composite also saw gains of 2.4% and 3.3%, respectively. Market sentiment appears to be buoyed by the belief in a disinflationary, soft landing scenario. Ed Yardeni, president of Yardeni Research, expressed his perspective that although the economy may be experiencing a rolling recession, it is not a widespread economic downturn. Instead, he sees it as a rolling recovery.

These market movements were influenced by positive big bank earnings and softer inflation reports, which instilled hope that the central bank can effectively manage inflation without pushing the economy into a recession. As investors eagerly await earnings reports and monitor the Federal Reserve’s upcoming decisions, Wall Street faces a mixture of optimism and economic uncertainty.

Data by Bloomberg

On Monday, the stock market showed a mixed performance. Information Technology had a strong day, gaining 1.33%, while sectors like Utilities and Communication Services experienced declines of 1.18% and 0.65% respectively. The overall market ended with a 0.39% increase.

Check out Share CFDs with VT Markets

Major Pair Movement

The US dollar index experienced a slight decline of 0.1% as its rebound from last week’s significant drop started to fade. Investors were eagerly awaiting the release of US retail sales data, which would determine whether the recent selloff driven by disinflation concerns would continue. Despite indications of disinflation and expectations of future rate hikes, the dollar had reached an oversold condition against major currencies such as the euro, yen, and pound. The currency was in need of consolidation or a correction, especially after the surprisingly positive July Michigan consumer sentiment, which suggested that the US economy was handling the Federal Reserve’s rate hikes better than anticipated.

The performance of the euro against the US dollar saw a slight increase of 0.1% after experiencing a decline from its recent high. Despite reports of falling German wholesale prices and unexpected drops in exports, the euro maintained its strong gains from July. Additionally, the yield spreads between 2-year bunds and US Treasury bonds remained significantly negative. The recovery of the US dollar against the Japanese yen faced resistance at a previously broken uptrend line, although Monday’s trading range exhibited higher lows and highs for the first time since the trend high in late June. The British pound declined by 0.1% ahead of the release of US retail sales and UK Consumer Price Index (CPI) data scheduled for Tuesday and Wednesday, respectively.

Picks of the Day Analysis

EUR/USD (4 Hours)

EUR/USDTrades Rangebound as USD Weakens Despite Tepid Chinese Data and ECB Comments

The EUR/USD pair traded within a narrow range on Monday, hovering around 1.1240. The US Dollar weakened during American trading hours, despite tepid Chinese GDP data. European Central Bank (ECB) officials provided little fresh insight, with policymakers mentioning the need to tighten policy and raise interest rates based on upcoming data. ECB President Christine Lagarde expressed concerns about stagnant GDP growth and increasing trade restrictions. The Fed and ECB will announce their monetary policy decisions next week. In terms of US economic data, the NY Empire State Manufacturing Index for July came in below expectations but exceeded the previous month’s figure, while June Retail Sales, Industrial Production, and Capacity Utilization are set to be released on Tuesday.

Chart EURUSD by TradingView

Learn more about Forex Trading here

According to technical analysis, the EUR/USD pair is experiencing a flat consolidating movement on Monday, creating the Bollinger Bands to squeeze. The price is still near the upper bands of the Bollinger Bands. This suggests that the price has the potential to reach the upper band of the Bollinger Bands. Additionally, the Relative Strength Index (RSI) is currently at 78, which is within the overbought area, indicating a bullish trend for the EUR/USD.

Resistance: 1.1291, 1.1382

Support: 1.1173, 1.1086

XAU/USD (4 Hours)

Gold (XAU/USD) Temporarily Ease as Market Awaits Central Bank Updates and US Inflation Progress

Gold prices showed a temporary decline on Monday, with XAU/USD trading around $1,954, remaining flat for the day after reaching a low of $1,945.72 per troy ounce. Investor excitement in the financial markets calmed down as attention turned to upcoming key events, including central bank announcements and an update on US inflation. The US Dollar made a modest recovery after its recent collapse, although its gains were insignificant compared to the sell-off triggered by speculation that the Federal Reserve may end its tightening cycle earlier than expected. US inflation data, such as the Consumer Price Index (CPI) and Producer Price Index (PPI), came in below expectations, suggesting that the Fed may only implement one rate hike instead of the anticipated two.

Chart XAUUSD by TradingView

According to technical analysis, the XAU/USD pair underwent a consolidating movement on Monday, around the middle band of the Bollinger Bands. Suggesting the possibility of further upward movement. This indicates the potential for the price to reach the upper band of the Bollinger Bands. Furthermore, the Relative Strength Index (RSI) is currently at 59, within the overbought area, indicating a neutral but slightly bullish trend for the XAU/USD.

Resistance: $1,965, $1,981

Support: $1,946, $1,929

Economic Data

CurrencyDataTime (GMT + 8)Forecast
CADConsumer Price Index20:300.3%
USDRetail Sales20:300.5%

Dividend Adjustment Notice – July 17, 2023

Dear Client,

Please note that the dividends of the following products will be adjusted accordingly. Index dividends will be executed separately through a balance statement directly to your trading account, and the comment will be in the following format “Div & Product Name & Net Volume ”.

Please refer to the table below for more details:

The above data is for reference only, please refer to the MT4/MT5 software for specific data.

If you’d like more information, please don’t hesitate to contact [email protected].

Week Ahead: Markets to Focus on US Retail Sales and Canada, UK CPI

This week’s economic calendar features US Retail Sales figures, as well as inflation data from both the UK and Canada — all of which have the capacity to move markets significantly. Therefore, it is crucial for traders to be prepared for any volatility that may arise from these key announcements and adjust their approaches as needed.

Keep an eye on the following economic releases:

Canada Consumer Price Index (18 July 2023)

Consumer prices in Canada rose by 0.4% in May 2023, slowing from the 0.7% increase in the previous month. 

Analysts anticipate a 0.4% increase in the figures for June, set to be released on 18 July.

US Retail Sales (18 July 2023) 

US retail sales rose 0.3% month-over-month in May 2023, following a 0.4% increase in April.

Analysts expect a similar 0.3% growth in the figures for June, scheduled for release on 18 July.

New Zealand Consumer Price Index (19 July 2023) 

The Consumer Price Index in New Zealand rose by 1.2% in the March quarter, representing the smallest quarterly price increase since Q1 2021.

Analysts predict a 1.1% uptick in figures for the upcoming quarter, set to be released on 19 July.

UK Consumer Price Index (19 July 2023) 

The UK’s consumer price inflation remained stable at 8.7% in May 2023, repeating the 13-month low recorded in the previous month. 

Anticipated for release on July 19, the upcoming CPI data is expected to show a further decline to 8.3%.

Employment in Australia (20 July 2023) 

Employment in Australia surged by 75,900 to 14.1 million in May 2023. This followed a revised drop of around 4,000 in the previous month. Meanwhile, the unemployment rate decreased to 3.6%, down from April’s figure of 3.7%. 

Analysts expect employment figures to increase by 25,100 in the data for June 2023, set to be released on 20 July. The unemployment rate is expected to remain steady at 3.6%. 

Start trading now — click here to create your live VT Markets account.

Dividend Adjustment Notice – July 14, 2023

Dear Client,

Please note that the dividends of the following products will be adjusted accordingly. Index dividends will be executed separately through a balance statement directly to your trading account, and the comment will be in the following format “Div & Product Name & Net Volume ”.

Please refer to the table below for more details:

The above data is for reference only, please refer to the MT4/MT5 software for specific data.

If you’d like more information, please don’t hesitate to contact [email protected].

Notification of Server Upgrade – July 14, 2023

Dear Client,

As part of our commitment to provide the most reliable service to our clients, there will be server maintenance this weekend.

Maintenance Hours :
15th of July 2023 (Saturday) 02:00 – 08:30 (GMT+3)

Please note that the following aspects might be affected during the maintenance:

1. The price quote feature on the Client Portal will be temporarily unavailable. You will not be able to open new positions or close existing positions.

2. There might be a gap between the original price and the price after maintenance. The gaps between Pending Orders, Stop Loss and Take Profit will be filled at the market price once the maintenance is completed.

3. Please refer to MT4/MT5 for the latest update on the completion and market opening time. Our services will be back online once the maintenance is completed.

Thank you for your patience and understanding about this important initiative.

If you’d like more information, please don’t hesitate to contact [email protected].

Stocks Rise as Inflation Data Eases Concerns

Stocks surged on Thursday as the latest inflation data came below expectations, leading to renewed optimism in the market. The S&P 500 and the Nasdaq Composite reached their highest levels in over a year, with the S&P 500 climbing 0.85% to 4,510.04 and the Nasdaq Composite advancing 1.58% to 14,138.57.

The Dow Jones Industrial Average also saw a modest gain of 0.14%, adding 47.71 points to close at 34,395.14. Notably, cybersecurity stock Palo Alto Networks saw a notable increase of 2.7%, while MGM Resorts and Alphabet rose 4.1% and 4.7%, respectively.

The positive market performance was attributed to the release of June’s producer price index (PPI) report, which indicated a smaller increase than anticipated. The PPI, measuring wholesale prices, rose by 0.1% in June, falling short of economists’ expectations of a 0.2% increase.

Furthermore, the core PPI, excluding volatile food and energy prices, also rose by 0.1%, below the anticipated level. The favourable inflation data further complemented the optimism generated by Wednesday’s consumer price index report, fueling investors’ confidence in the market.

All sectors performance with a positive trend except for Health Care and Energy sectors.

Data by Bloomberg

On Thursday, the overall market experienced a positive trend, with all sectors showing gains except for the Health Care and Energy sectors. The communication services sector had the highest increase, rising by 2.32%. The Information Technology and Consumer Discretionary sectors also performed well, with gains of 1.49% and 1.08% respectively.

The Materials and Real Estate sectors saw moderate increases of 0.79% and 0.67% respectively. The Consumer Staples, Utilities, Financials, and Industrials sectors also showed positive but smaller gains, ranging from 0.38% to 0.37%. However, the Health Care sector experienced a marginal decline of -0.01%, while the energy sector showed a decrease of -0.45%.

Major Pair Movement

The dollar index experienced a significant decline of 0.7%, marking a weekly plunge of 2.4% and dropping below 100 for the first time since April 2022. This decline in the dollar was accompanied by a decrease in 2-year Treasury yields by 12 basis points. Market expectations now suggest that the Federal Reserve’s rate hike in July will likely be the last one before a series of rate cuts totalling nearly 200 basis points next year.

In contrast, the European Central Bank (ECB) is anticipated to raise rates by 50 basis points before implementing rate cuts of around 65 basis points in the second half of 2024. The positive sentiment toward the euro resulted in a 0.8% increase in the EUR/USD exchange rate, surpassing the key 200-week moving average and reaching its highest level since April 2022.

The anticipation of additional rate hikes and China’s stimulus measures contributed to a surge of 1.5% in the AUD/USD exchange rate. Despite concerns surrounding the situation, USD/CNH fell by 0.25%. The Swiss franc (CHF) experienced a 1% decline against the US dollar (USD), reaching its lowest level since the Swiss National Bank removed its 1.20 EUR/CHF floor in January 2015.

The USD/JPY pair, which had fallen by 4.3% in June, saw a modest increase of 0.34% on Thursday as it encountered support near the 138 expiry level. If the pair closes below the 38.2% Fibonacci retracement level of its advance in 2023, at 138.25 and 138, further downward pressure may be expected.

Additionally, gold prices rose by 1.1% following the departure of a member of the Bank of England (BoE), reinforcing expectations of aggressive rate hikes totalling 117 basis points to address the current economic challenges.

Picks of the Day Analysis
EUR/USD (4 Hours)

EUR/USDGains Momentum Amid Dollar Sell-Off and ECB’s Interest Rate Speculation

The EUR/USD currency pair extended its upward trajectory for the sixth consecutive day as the US Dollar experienced another round of selling pressure, driven by US inflation data indicating a slowdown. The negative momentum of the Dollar persists, potentially paving the way for further gains, although the extent of the rally suggests a potential consolidation or modest correction.

The European Central Bank (ECB) released minutes from its recent meeting, echoing President Lagarde’s comments about potential interest rate hikes beyond July if deemed necessary. Meanwhile, upcoming economic growth forecasts and trade balance data from the European Commission, along with declining US and Eurozone yields, continue to shape the market sentiment. The latest Producer Price Index figures highlighted a further slowdown in inflation, leading to additional losses for the Dollar, while the upcoming Consumer Confidence data is anticipated on Friday.

EURUSD gains as the US Dollar experienced another round of selling pressure, driven by US inflation data

Chart EURUSD by TradingView

According to technical analysis, the EUR/USD pair is experiencing an upward movement on Thursday, pushing towards the upper band of the Bollinger Bands. Currently, the price is still near the upper bands of the Bollinger Bands, and the bands themselves indicate the potential for further upward movement.

This suggests that the price has the potential to reach the upper band of the Bollinger Bands. Additionally, the Relative Strength Index (RSI) is currently at 84, which is within the overbought area, indicating a bullish trend for the EUR/USD.

Resistance: 1.1291, 1.1382

Support: 1.1173, 1.1086

XAU/USD (4 Hours)

Gold (XAU/USD) Consolidates as Markets Remain Optimistic on US Inflation Easing

Gold prices held steady at $1,958 per troy ounce as financial markets maintained an optimistic outlook on easing United States (US) inflation. The release of the Producer Price Index (PPI) indicated a modest year-on-year and month-on-month increase of 0.1%. The core annual reading of 2.4% was lower than expected and the previous figure, reinforcing positive sentiment.

Despite the US Dollar’s decline, investors turned their attention to high-yielding assets, resulting in limited gains for gold. While Wall Street maintained modest gains, comments from San Francisco Federal Reserve President Mary Daly expressing the need for rate hikes impacted stocks, citing the economy’s momentum and uncertain wage growth’s impact on inflation.

XAUUSD consolidates as markets remain optimistic on US Inflation easing

Chart XAUUSD by TradingView

According to technical analysis, the XAU/USD pair underwent a consolidating movement on Thursday, near the upper band of the Bollinger Bands. Suggesting the possibility of further upward movement.

This indicates the potential for the price to reach the upper band of the Bollinger Bands. Furthermore, the Relative Strength Index (RSI) is currently at 71, within the overbought area, indicating a bullish trend for the XAU/USD.

Resistance: $1,965, $1,981

Support: $1,946, $1,929

Economic Data

CurrencyDataTime (GMT + 8)Forecast
USDPrelim UoM Consumer Sentiment22:0065.5

Start trading now — click here to create your live VT Markets account.

Dividend Adjustment Notice – July 13, 2023

Dear Client,

Please note that the dividends of the following products will be adjusted accordingly. Index dividends will be executed separately through a balance statement directly to your trading account, and the comment will be in the following format “Div & Product Name & Net Volume ”.

Please refer to the table below for more details:

The above data is for reference only, please refer to the MT4/MT5 software for specific data.

If you’d like more information, please don’t hesitate to contact [email protected].

Back To Top
server

Hai 👋

Bagaimana saya boleh membantu?

Segera berbual dengan pasukan kami

Chat Langsung

Mulakan perbualan secara langsung melalui...

  • Telegram
    hold Ditangguh
  • Akan datang...

Hai 👋

Bagaimana saya boleh membantu?

telegram

Imbas kod QR dengan telefon pintar anda untuk mula berbual dengan kami, atau klik di sini.

Tidak ada aplikasi Telegram atau versi Desktop terpasang? Gunakan Web Telegram sebaliknya.

QR code