The price of gold continues to consolidate its recent run to new four-week highs ahead of the crucial US NFP report.
The yellow metal is supported by rising demand for safe havens in the midst of fears of a recession.
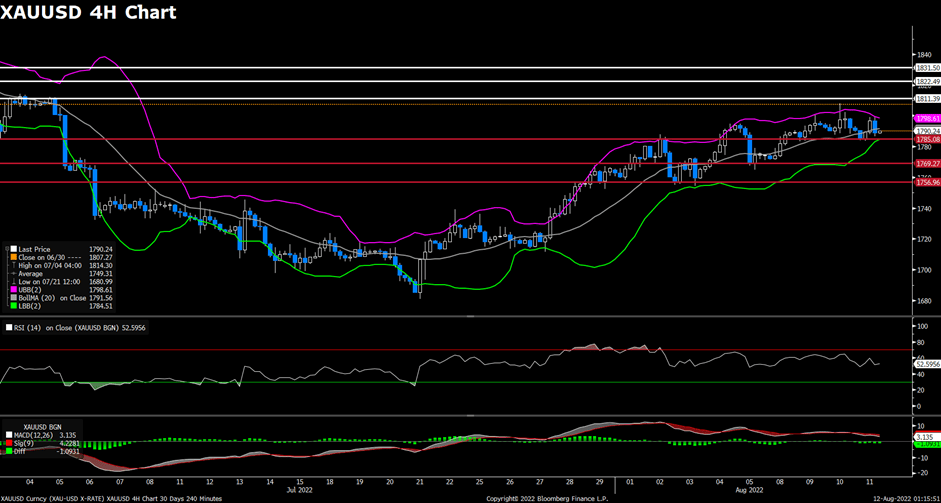
In the face of the impending bear cross, the XAU/USD currency pair is eyeing $1,800 as the next potential upside goal.
The price of gold has reached a monthly high and is currently trading just below the $1,800 level. This comes as bulls take a breather following the recent increase in price and in anticipation of the all-important US Nonfarm Payrolls report. The markets witnessed a temporary safe haven bid in the US dollar in the midst of mounting recession risks, particularly after the Bank of England (BOE) projected one later this year. However, dismal weekly Jobless Claims data dragged the USD lower, causing the recession risks to have a negative impact. The United States Department of Labour reported that the number of people filing initial claims for state unemployment rose by 6,000 to a total of 260,000 in the week that ended on July 30. This number is hanging close to an eight-month high. The financial markets are anticipating that if the figures continue to grow, it may be an indication that the largest economy in the world is about to enter a period of recession. The demand for safe havens shot through the roof, and investors rushed to buy gold as a classic safe haven investment.
In the middle of worries about economic expansion and positive corporate earnings reports, the value of the United States Dollar (USD) continued to weaken, which helped the price of gold to gain strength. The focus has now shifted to the data on the labour market in the United States, where it is anticipated that the economy created a measly 250,000 jobs in July, compared to the previous month’s gain of 372,000 jobs. Any sign of weakness in the US employment sector is likely to revive lower expectations of further Fed tightening, which will lead to a decline in the value of the dollar. As a result, the bullish trend that has been seen in stocks and the price of the precious metal measured in USD could continue.
On Thursday, the price of gold managed to finish the trading day at $1,790, which was higher than the crucial downward-sloping 50-day moving average.
The way is now clear for a second rise to the figure of $1,800, which, if achieved, will bring into play the horizontal trendline resistance connecting the high reached on July 5 at $1,812 in the price action. This means there will be less of a barrier for gold to overcome on its way to the next Resistance Levels at $1,808.
Stochastic Indicator for a period of 5 days showing a stronger Gold to rise to chase the overbought levels, which means that the possibility of it going up is quite high but is still limited to the Resistance Levels. Stochastic Indicator for a period of 5 days showing a stronger Gold to rise to chase the overbought levels.
Gold’s daily support levels are at $1,752, $1,734, and $1,697, while its daily resistance levels are at $1,808 and $1,828, respectively.
New contracts will automatically be rolled over as follows:
Please note:
•The rollover will be automatic, and any existing open positions will remain open.
•Positions that are open on the expiration date will be adjusted via a rollover charge or credit to reflect the price difference between the expiring and new contracts.
•To avoid CFD rollovers, clients can choose to close any open CFD positions prior to the expiration date.
•Clients should ensure that take profits and stop losses are adjusted before this rollover occurs.
If you’d like more information, please don’t hesitate to contact [email protected].
US stocks wavered on Thursday as traders parsed various corporate earnings against a backdrop of aggressive interest-rate hikes by global central banks. The US yield curve continued to be inverted as recession fears persisted.
The S&P 500 ended the session little changed after fluctuating throughout the day. The Nasdaq 100 closed up higher for the second straight day after swinging between modest gains and losses. The Nasdaq 100 closed up higher for the second straight day after swinging between modest gains and losses.
A flurry of economic data released this week assuaged fears of a downturn while hinting at stabilising growth. But the bond market, especially the persistently inverted Treasury yield curve, is flashing warnings on the economy amid a global wave of monetary tightening. All eyes will be on the US jobs report on Friday for further clues about the Federal Reserve’s path of rate hikes.
Elon Musk said he sees signs that the global economy has gone “past peak inflation.” Speaking at the electric-vehicle maker’s annual shareholder meeting, Musk said the company’s commodity and component costs are trending downward over the next six months. He also reiterated prior comments that he expects a mild recession to hit that could last 18 months.
“The trend is down, which suggests we are past peak inflation,” Musk said at Tesla’s Austin headquarters and factory. “I think inflation is going to drop rapidly” at some point in the future, he said.
Global central banks have embarked on a path of policy-tightening as inflation pressures consumers and corporate bottom lines. In the US, consumer prices increased by 9.1% in June from a year earlier, and Federal Reserve officials say the price gains have yet to slow. The next print on inflation comes on Aug 10.
Main Pairs Movement
The dollar fell against most of its major rivals, ending the day near its recent lows, usually a sign of further declines ahead in the near term. The fear of a global recession returned after the Bank of England announced its latest decision on monetary policy. The central bank raised interest rates by 50bps to 1.75% as expected.
But politicians have revised their inflation forecast upwards, expecting a recession in the next five quarters. A Federal Reserve official said that recession risks have increased in the US and that interest rates should continue to rise at least through this year and the first half of 2023.
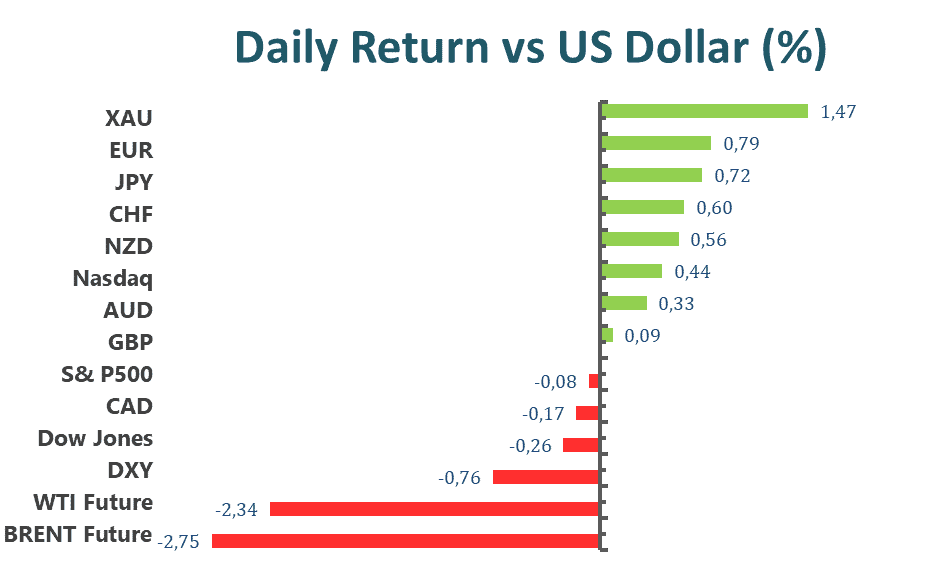
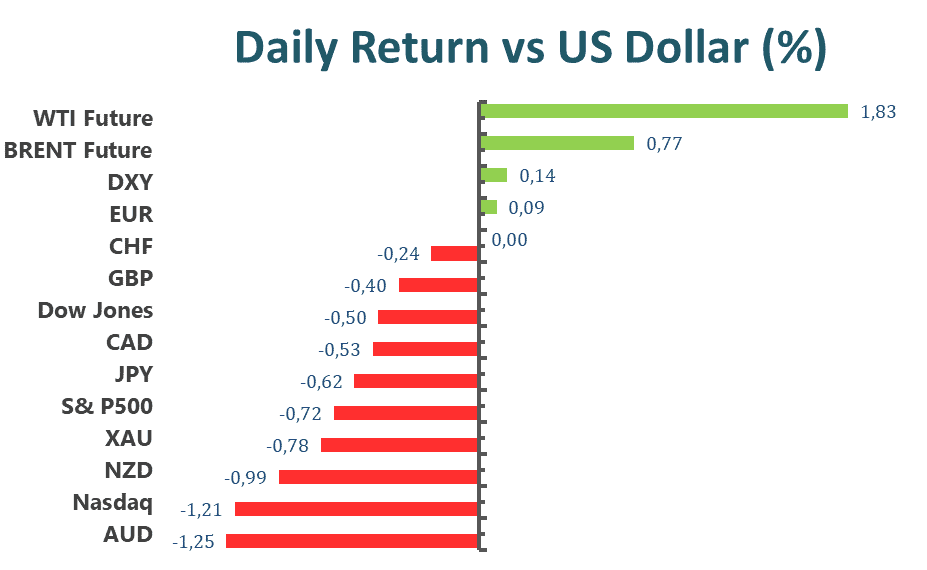
GBP/USD recovered some of its losses from the past two days and advanced towards 1.2170 in early European trading on Thursday. EUR/USD benefited from the broad dollar’s weakness and settled around 1.0250. The AUD/USD advanced and hovered around 0.6970, bolstered by gold, as the bright metal reached fresh one-month highs in the US$1,790 price zone. The US dollar strengthened against the Canadian dollar, climbing to around 1.2860 before settling at that level. The barrel of WTI currently trades at US$88.40 a barrel.
XAU/USD has pushed down within its weekly bullish correction to mark a high of US$1,794.23. Gold price increased as US bond yields decreased and the Bank of England issued a warning that the UK’s economy might be headed for a recession later this year due to inflation could reach 13%.
Technical Analysis
EURUSD (4-Hour Chart)
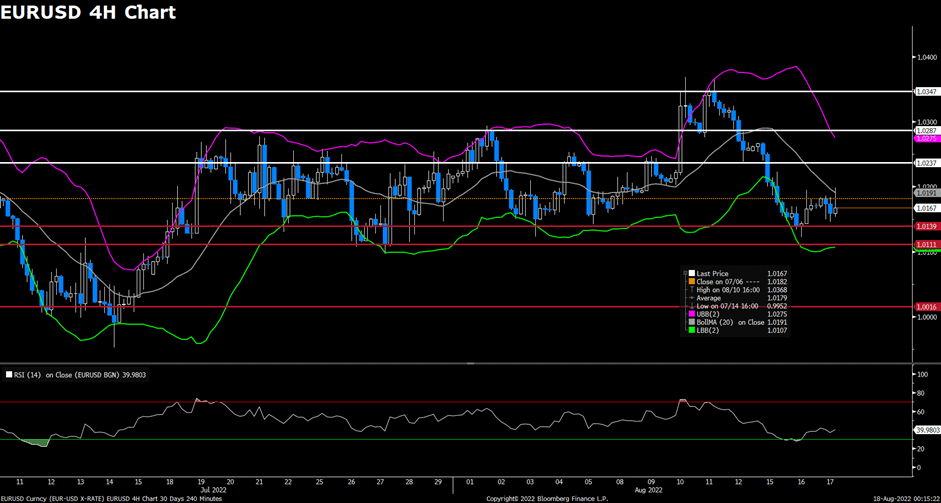
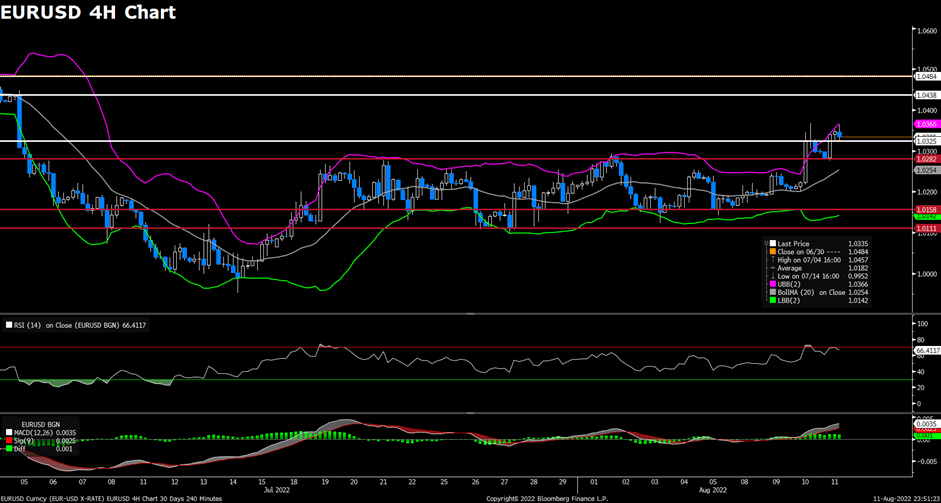
The EUR/USD pair advanced on Thursday, regaining upside momentum and rebounded from a weekly low below the 1.013 mark that touched yesterday amid the current rebound in the risk complex. The pair is now trading at 1.02106, posting a 0.46% gain on a daily basis. EUR/USD stays in the positive territory amid weaker US dollar across the board, as the falling US Treasury bond yields and the disappointing Jobless Claims data exerted bearish pressure on the greenback. The US Weekly Initial Jobless Claims rise to 260K, which came in slightly worse than the market expectation of 259K. But the recent hawkish stance from several Fed speakers and expectations for further rate hikes in the next months should limit the losses for the greenback. For the Euro, the IHS S&P Global Germany Construction PMI fell to 43.7 in July.
For the technical aspect, the RSI indicator figures as of writing, suggesting that upside is more favoured as the RSI stays above the mid-line. As for the Bollinger Bands, the price preserved its upside strength and crossed above the moving average, therefore the bullish momentum should persist. In conclusion, we think the market will be bullish as the pair is testing the 1.0221 resistance line. A break above that level might bring additional gains to the pair.
Resistance: 1.0221, 1.0287, 1.0438
Support: 1.0150, 1.0082, 0.9991
GBPUSD (4-Hour Chart)
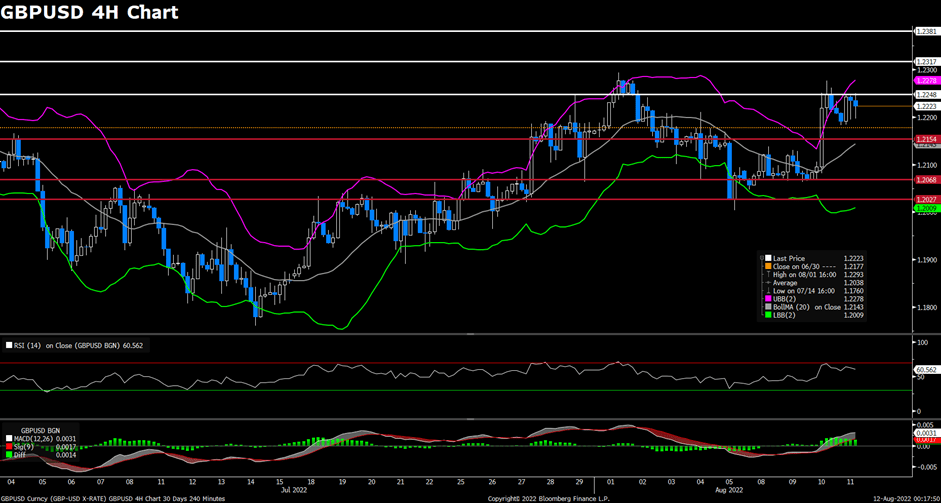
The GBP/USD pair edged lower on Thursday, coming under selling pressure and dropped to a daily low below 1.208 level after the announcement of the Bank of England’s policy decision. At the time of writing, the cable stays in negative territory with a 0.17% loss for the day. The BoE decided to raise the benchmark rate by 50 bps to 1.75% as widely expected, which was fully priced in the markets and prompted fresh selling around the cable. For the British pound, the currency remained under bearish momentum amid the dovish BoE policy decision. Investors continue to anticipate further rate hikes after this week. Moreover, BOE Governor Bailey also said that he expects the UK economy to tip into recession in Q4 in the press conference, therefore the pound is likely to have a difficult time finding demand.
For the technical aspect, the RSI indicator is 48 as of writing, suggesting that the bull is preserving strength as the RSI climbs toward the mid-line. For the Bollinger Bands, the price failed to touch the lower band and started to rise, indicating that some upside traction can be expected. In conclusion, we think the market will be bullish as the pair is heading to re-test the 1.2178 resistance line. On the upside, additional gains can be expected if the pair breaks above the aforementioned resistance.
Resistance: 1.2198, 1.2277, 1.2317
Support: 1.2050, 1.2002, 1.1897
USDCAD (4-Hour Chart)
Despite the US dollar coming under selling pressure amid dismal Initial Jobless Claims data on Thursday, the pair USD/CAD witnessed some upside momentum and climbed to a daily top above the 1.287 mark in the early US trading session. USD/CAD is trading at 1.28671 at the time of writing, rising 0.21% on a daily basis. The market focus now shifts to the Canadian employment conditions report and US Nonfarm Payrolls for July this Friday, as the market mood is mixed after US House Speaker Pelosi’s trip to Taiwan. On top of that, the falling crude oil prices also undermined the commodity-linked loonie and pushed the USD/CAD pair higher as WTI tumbled back to the US$88 per barrel area. Investors started to seek safety as the regional tensions have escalated.
For the technical aspect, the RSI indicator is 51 as of writing, suggesting the pair’s indecisiveness in the near term as the RSI indicator stays near. For the Bollinger Bands, the price lost its upside strength and dropped toward the moving average, therefore a continuation of the downside trend could be expected. In conclusion, we think the market will be bearish as long as the 1.2885 resistance line holds. The falling RSI also reflects bear signals.
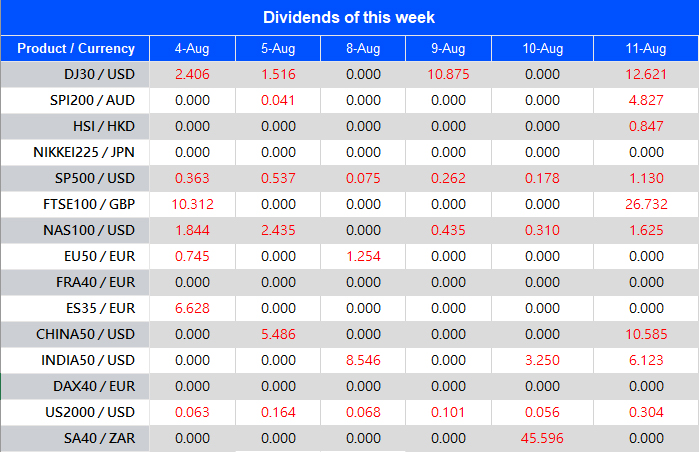
Warmly reminds you that the component stocks in the stock index spot generate dividends. When dividends are distributed, VT Markets will make dividends and deductions for the clients who hold the trading products after the close of the day before the ex-dividend date.
Indices dividends will not be paid/charged as an inclusion along with the swap component. It will be executed separately through a balance statement directly to your trading account, the comment for which will be in the following format “Div & Product Name & Net Volume ”.
Please note the specific adjustments as follows:
The above data is for reference only, please refer to the MT4/MT5 software for specific data.
If you’d like more information, please don’t hesitate to contact [email protected].
Best Affiliate Programme, Ultimate Fintech Awards 2022
VT Markets, the international multi-asset broker, is proud to announce that it has clinched the “Best Affiliate Program” at the prestigious Ultimate Fintech Awards 2022, hosted by iFX EXPO International. This globally respected award recognises VT Markets’ large and trusted affiliate network across the world.
VT Markets’ impeccable industry-leading Affiliate Partnership programme consistently delivers innovative trading product and service offerings, attractive and transparent commissions, advanced marketing and institutional solutions designed to ensure the success of its affiliates.
Yiangos Georgiou, Director of Business Development, comments: “Fostering successful affiliate partnerships has always been one of our top priorities as we understand the importance of our international affiliates in expanding our markets globally. We are committed to developing and nurturing these partnerships to help our affiliates achieve sustainable growth as an essential part of our global expansion journey.”
Best Mobile App Europe 2022 (Forex Division)
VT Markets won the “Best Mobile App Europe 2022 (Forex Division)” award with its recently relaunched trading app. It is recognised for creating a secure and integrated trading app that stays true to the brand promise of “Trading can be easy”.
It provides clients with real-time price alerts, performance analytics and smart signals newsletter. It gives in-depth product information with corresponding market analysis and economic news. The enhanced user interface offers excellent accessibility and over 80 payment methods.
An exciting new feature is “Big Movers” which alerts clients on major market shifts and trading opportunities in the previous 24 hours. The “Learn” feature provides valuable educational trading content.
Timothy Lee, Integrated App Marketing Manager comments: “VT Markets has made tremendous investments to bring significant improvements to our mobile offerings and trading platform and this is reflected in the positive feedback from our global clients since our app relaunch. We will continue to invest in innovative features to provide the most optimal trading experience for all our clients.”
The VT Markets trading app is available for download from the Apple App Store and Google Play Store.
Other Awards
VT Markets have received numerous awards this year that recognises it as the innovative market leader in the industry:
Best Forex Broker Europe 2022, International Business Magazine
Best Partnership Programme Global 2022, Global Business Review Magazine
Best Customer Support UK 2022, World Business Outlook Awards
US stock rallied on Wednesday, snapping a two-day loss since the beginning of this week, as earnings buoyed the market mood. Investors could clear their concerns about earnings disaster after 70% through the season, as more cheering data like a solid report from Moderna.Inc and Paypal Holding Inc. released.
However, Jerome Powell signalled that the pace of future rate increases may slow later this year, which boosted the speculations for cuts next year in market-implied measures, as even several Fed leaders said central banks still keep their eyes out for the hottest inflation in four decades. Moreover, after House Speaker Nancy Pelosi left Taiwan, the market is calmer amid the undermining relationship between China and the United States.
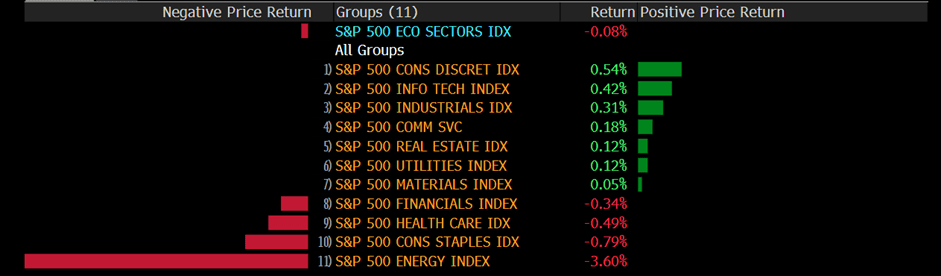
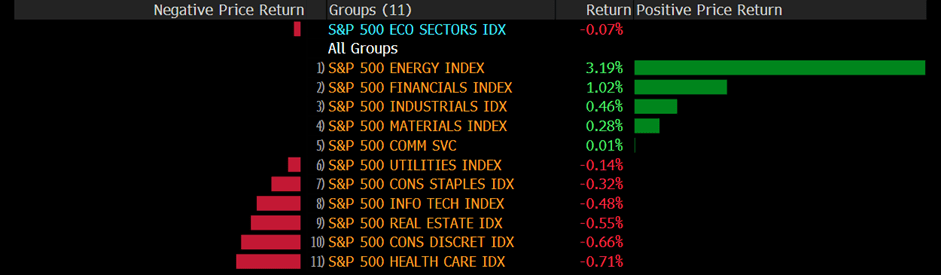
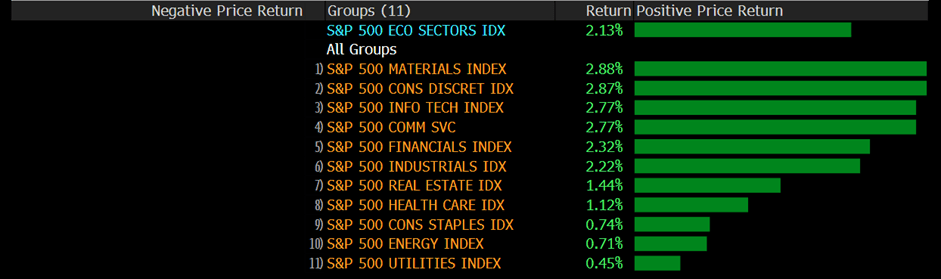
The benchmarks, S&P500 and Dow Jones Industrial Average both advanced on Wednesday as tech earnings performed better than expected. S&P500 rose with a 1.56 % gain on a daily basis, and ten out of eleven sectors stayed in positive territory, as Information Technology, Consumer Discretion, and Communication Service got the best performance, with a 2.69%, 2.52% and 2.48% growth rate respectively for the day. Besides, the Dow Jones Industrial Average rose 1.3%, Nasdaq 100 rose 2.7%, but the MSCI world index slid with a 0.8% loss on Wednesday.
Main Pairs Movement
US dollar rose on Wednesday, as the upbeat prints of US data and hawkish comments from the Fed mixed with recession fears put a firm floor for the safe-haven greenback. The DXY index surged at the beginning of the US trading session as stronger than forecast earnings were released, but lost bullish momentum and reversed from a weekly top to a depressed around 106.5 level. It’s worth noting that, US ISM Services PMI for July rose to 56.7 from 55.3, far above the market expectation of 53.5, and the Final reading of the US S&P Global Services PMI for July dropped to 47.3, which is the first contraction in two years.
The GBP/USD slid for the day, market amid a strong US dollar across the board and the expectation of a 50-bps rate hike by the Bank of England (BOE), however, the price pressure has risen up to 9.4%. The cables suffered selling during the selling pressure as upbeat US data and US stock and to a daily low level around 1.210. Meanwhile, EURUSD dropped to a daily low level below 1.013, then regain bullish momentum back to a 1.016 level. The pairs remained unchanged on Wednesday.
Gold advanced with a 0.28% gain on a daily basis and closed at $1765 marks for the day. However, investors put focused on upbeat US data and comments from Fed during the US trading session, which caused the XAUUSD to fall below $1755 marks. It’s also worth noting that WTI and BRENT oil dropped 3.74% and 3.98% respectively.
Technical Analysis
EURUSD (4-Hour Chart)
The EUR/USD pair declined on Wednesday, extending its previous day’s slide and refreshed its daily low below the 1.013 mark in the early US session after the release of upbeat US ISM Services PMI data. The pair is now trading at 1.01282, posting a 0.37% loss on a daily basis. EUR/USD stays in the negative territory amid a stronger US dollar across the board, as the tensions between the US and China still remain after US House Speaker Nancy Pelosi left Taiwan during the European morning. China has planned military exercises around Taiwan for the next three days. Meanwhile, the US ISM Services PMI also came in higher than expected at 56.7 in July, which lend support to the greenback. For the Euro, the dismal Eurozone Retail Sales data weighed on the shared currency, as the report showed that Eurozone’s Retail Sales fell by 1.2% MoM in June.
For the technical aspect, the RSI indicator is 38 figures as of writing, suggesting that downside is more favoured as the RSI stays below the mid-line. As for the Bollinger Bands, the price witnessed heavy selling and dropped toward the lower band, therefore the bearish momentum should persist. In conclusion, we think the market will be bearish as the pair is heading to test the 1.0111 support line. The falling RSI also reflects bear signals.
Resistance: 1.0221, 1.0287, 1.0438
Support: 1.0111, 0.9991
GBPUSD (4-Hour Chart)
The GBP/USD pair dropped on Wednesday, failing to preserve the upside traction that was witnessed in the first half of the day and touched a daily low near the 1.210 mark amid renewed US dollar strength. At the time of writing, the cable stays in negative territory with a 0.41% loss for the day. A combination of factors continued to help the safe-haven greenback to find demand, as recession fears and US-China tensions both undermined the market sentiment. For the British pound, the currency came under bearish pressure today as the data from the UK revealed that the business activity in the service sector expanded at its weakest pace in 17 months. The Services PMI declined to 52.6 in July and missed the market’s expectations.
For the technical aspect, the RSI indicator is 44 figures as of writing, suggesting that the pair is facing bearish pressure as the RSI indicator continues to move south. For the Bollinger Bands, the price also gained downside traction and touched the lower band, indicating that the pair is surrounded by bearish momentum. In conclusion, we think the market will be bearish as the pair tests the 1.2115 support line. On the upside, a break above the 1.2198 resistance line could favour the bulls and lead to additional gains toward 1.2277.
Resistance: 1.2198, 1.2217, 1.2317
Support: 1.2115, 1.2039, 1.1940
USDCAD (4-Hour Chart)
Despite the US dollar capitalising again on Wednesday versus G10 currencies amid rising US 10-year Treasury yield, the pair USD/CAD failed to climb higher and dropped to a daily low below 1.284 level in the late European session. USD/CAD is trading at 1.2869 at the time of writing, losing 0.09% on a daily basis. The market focus now shifts to July’s Nonfarm Payrolls report this Friday after the upbeat US Services PMI data showed that the business activity expanded at a more robust pace. On top of that, the falling crude oil prices failed to lift the USD/CAD pair higher as WTI slipped back towards the $92 per barrel area. The latest news showed that OPEC+ have agreed to raise the oil output by 100,000 barrels per day in September.
For the technical aspect, the RSI indicator is 54 figures as of writing, suggesting that the upside is more favoured as the RSI stays above the mid-line. For the Bollinger Bands, the price regained upside strength and rebounded from the moving average, therefore a continuation of the upside trend could be expected. In conclusion, we think the market will be bullish as the pair might head to re-test the 1.2891 resistance line. A break above that level could confirm the bullish bias and lift the pair higher toward 1.2944.
You hear these words a lot from traders—support and resistance. And if you’re new to trading, you’re probably wondering what they mean and how they can help you make the best trading decisions.
In its essence, support means that a downtrend may stop because of increased buying interest or demand. Resistance means that an uptrend is expected to pause due to an increased selling interest.
Here are some of the most important things that you need to know about support and resistance:
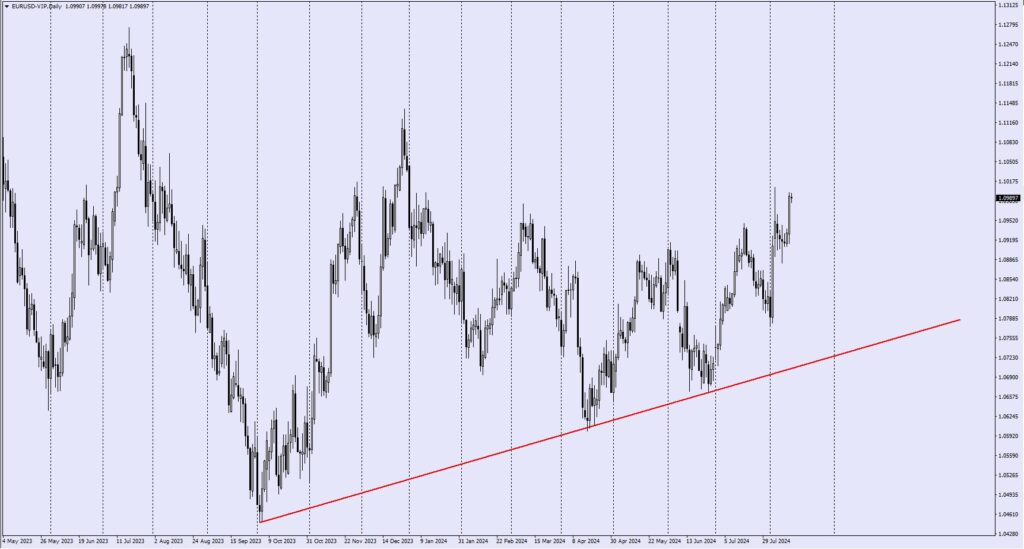
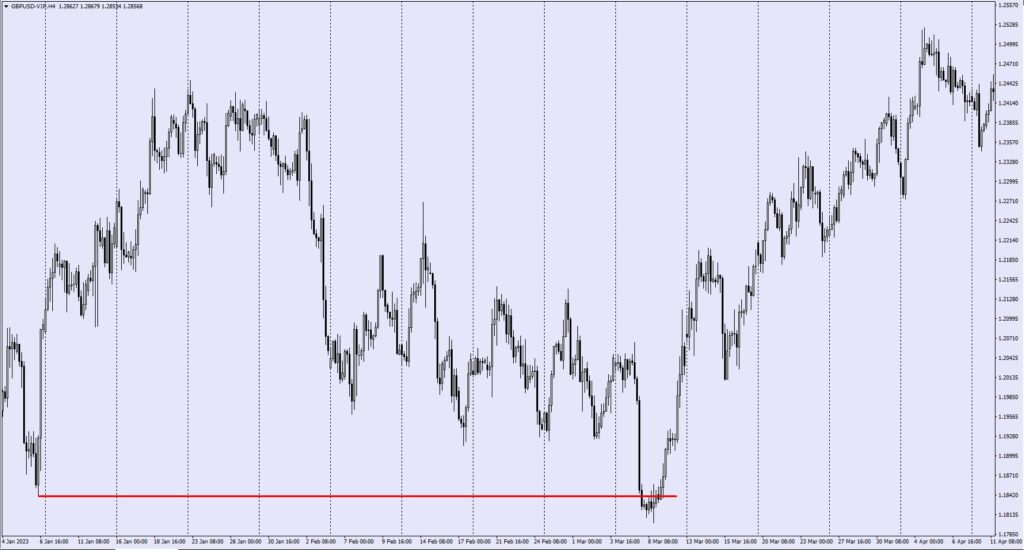
Trendlines.These are angled or horizontal lines highlighting support and resistance in a chart. If you’re in an uptrend, there are higher highs and higher lows, while in a downtrend, there are lower lows and lower highs. You need to connect those highs and lows during a trend and extend that line to the right of the chart to determine where the price may reach support or resistance at some point. Trendlines are very important because they help you decide when to buy or sell.
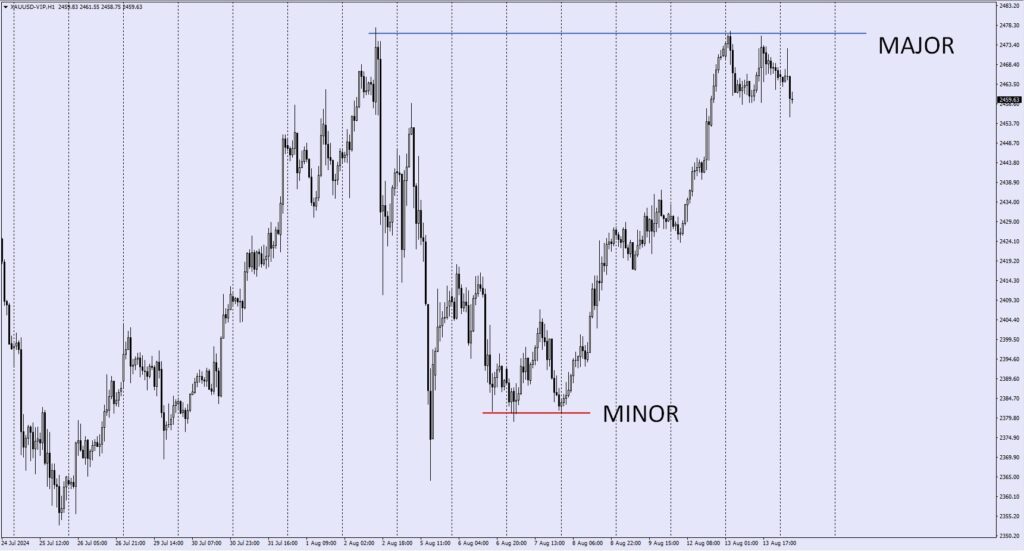
Major and minor. Support and resistance levels can be classified as major and minor, which means that a trend can fluctuate from going down low and suddenly bouncing up before going back down again. If this happens, you call it a minor support area. If the situation follows an uptrend, you call that a major resistance area. Knowing your major and minor support and resistance levels will allow you to see potential trading opportunities so you can take advantage of them and not get left behind by the pack.
False breakouts. Although support and resistance levels are highly reliable determinants for buying, selling, or sitting the market out, there are some instances when prices will move slightly further than expected—a phenomenon called a false breakout. Since support and resistance are not exact prices, you can expect that price analysis could be lower or higher than the real price. While this could cause some risks to you as a trader, some experts would say this is a great opportunity to trade. If you know how to identify a false breakout, you can wait for it to occur on the chart and only enter the market after it happens. That will help you ensure a better trade while still following your analysis based on support and resistance levels.
Trading decisions. The trick to taking advantage of opportunities based on support and resistance is to buy near them because you’ll never know when that trend will stop. Keep in mind that trends play a huge role in dictating where things will be for trading, so you need to be keen on looking for those support and resistance opportunities and take advantage of them before they’re gone. This is why it pays to trade in a platform where all the data you need is right in your hands, and you can also ask for expert advice from people who know these levels well.
At the end of the day, being a successful trader will boil down to how dynamic you are in making trading decisions. While there are no hard-and-fast rules to succeeding in trading, there are strategies and methods like support and resistance to guide you through your trading journey.
Learn all these concepts, talk to people within the trading community, and choose a platform where you can nurture yourself as a trader while building your portfolio and growing your investment.
Get in touch with our team at VT Markets to know more about what we can offer to traders like you.
VT Markets relaunches its secure and integrated trading app that offers a seamless online mobile experience. It is designed using the updated technologies to provide clients with the most optimal trading experience with real-time price alerts, performance analytics and smart signals newsletter. Clients benefit from in-depth information about their desired trading product with corresponding market analysis and economic news. They get a weekly summary which provides an analysis of their trading portfolio and performance.
The enhanced user interface offers excellent accessibility. They can easily access their trading positions, accounts, deposits, funds and coupons, place orders and gain access to over 80 payment methods in different countries. Clients can trade on the move and never miss a trading opportunity.
An exciting new feature is “Big Movers” which alerts clients on major market shifts, economic news highlights and trading opportunities in the previous 24 hours. This gives key market insights and analysis to a tech savvy audience to empower them to make more informed and timely trading decisions. VT Markets invests in the success and learning journey of its clients by developing an extensive “Learn” feature in the app to provide valuable educational content to continuously expand their trading knowledge and expertise.
Timothy Lee, Integrated App Marketing Manager comments: “VT Markets has made tremendous investments to bring significant improvements to our mobile offerings and trading platform and this is reflected in the positive feedback from our global clients since our app relaunch. We are delighted to receive Best Mobile App Europe 2022 and will continue to invest in innovative new features to deliver top-class customer service to our clients allowing them to trade with ease wherever they are. With a clear vision of a multi-asset global trading app and more exciting features like in-app promotions and educational videos planned for the upcoming months, we strive to provide the most optimal trading experience and make trading easy for all our clients.”
The VT Markets trading app is available for download from the Apple App Store and Google Play Store.
VT Markets is a global, regulated, multi-asset broker with experience and expertise in financial markets in over 160 countries. It believes that trading should be accessible and easy and aims to provide their clients with a superior and trusted trading environment, offering true ECN accounts with raw spreads, a powerful client portal, and a 24/7 award-winning customer service.
Its next generation platform makes it effortless to invest in more than 1000 assets, including forex, commodities, indices, and CFD shares with transparency and safety. From gold to FX currencies, trades are executed with lightning-fast speed to guarantee low latency orders and improve chances of profitability. It strives to establish its international branding as the innovative market leader in the trading industry.
US stock little declined on Tuesday, as Federal Reserve officials implied the next move of the central bank will be more hawkish to calm runaway inflation. Investors are keeping their eyes out for comments from Fed officials about the necessity of a more aggressive interest rate policy. It’s also worth noting that, Pelosi’s trip has created new geopolitical tensions for investors already consuming the prospects of the US recession, global interest rate hikes and Russia’s war in Ukraine. Fresh economic data also showed that US openings in June fell to a nine-month low, which is a signal to tell investors that demand for the labour market is moderating as higher economic pressure.
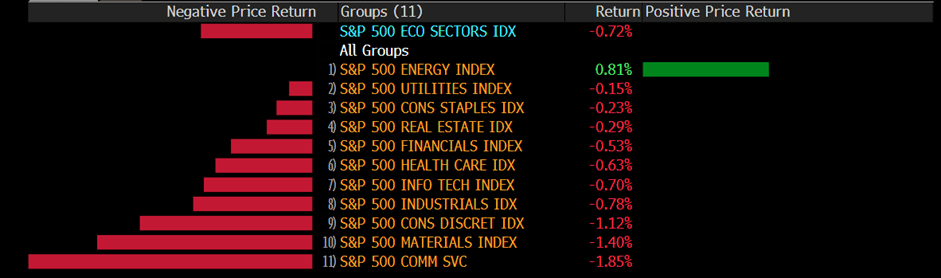
The benchmarks, S&P500 and Dow Jones Industrial Average both slid on Tuesday. S&P 500 fell with a 0.67 % losses on a daily basis as Nancy Pelosi’s arrival in Taiwan prompted China to do missile test, undermined the geopolitical tensions, and all eleven sectors stayed in negative territory as Real Estate and Financial sectors performed worst among all groups, falling 1.3% and 1.07% respectively. Moreover, the Dow Jones Industrial Average dropped 1.1% for the day, Nasdaq has little changed with 0.3% losses and the MSCI world index rose 0.1% on Tuesday.
Main Pairs Movement
US dollar surged with a 0.85% gain on Tuesday, the market is surrounded by a risk-aversion mood as tensions caused by the news of US House Speaker Nancy Pelosi’s visit to Taiwan. The DXY index eased at the beginning of Tuesday, but regain bullish momentum after the hawkish comments from Federal Reserve officials, which resumed the consecutive days’ losses and back to the level above 106.1.
The GBP/USD dropped 0.65% for the day, as the market amid a risk-aversion mood and a strong save greenback across the board. The cables slip almost all day on Tuesday, as a huge selling pressure caused by Pelosi’s trip may undermine the relationship between US and China. The GBPUSD touched a daily low level during the US trading session around 1.218. Meanwhile, EURUSD also lost the previous day’s gain and fell back to a level under 1.018 at end of the day. The pairs dropped 0.94% on Tuesday.
The Gold declined by 0.66% daily as the risk aversion market makes a save greenback strong across the board and US yields have rallied recently weighing on the gold price. WTI and Brent oil rose 0.56% and 0.51% on Tuesday.
Technical Analysis
EURUSD (4-Hour Chart)
The EUR/USD pair declined on Tuesday, remaining under bearish pressure and dropped to a daily low below 1.019 level amid the risk-averse environment. The pair is now trading at 1.0203, posting a 0.58% loss daily. EUR/USD stays in the negative territory amid a stronger US dollar across the board, as the risk-off market mood underpinned the safe-haven greenback and acted as a headwind for the EUR/USD pair. Tensions between the US and China have escalated as Nancy Pelosi, the speaker of the US House of Representatives is expected to meet Taiwan’s President on Wednesday. News also reported that several Chinese warplanes fly close to the median line of the Taiwan strait this morning. For the Euro, investors await the PMI and the Retail Sales data that will release on Wednesday.
For the technical aspect, the RSI indicator is 47 figures as of writing, suggesting that the downside is more favoured as the RSI stays below the mid-line. As for the Bollinger Bands, the price preserved its downside traction and dropped below the moving average, therefore the bearish momentum should persist. In conclusion, we think the market will be bearish as the pair tests the 1.0175 support line. The bearish case is clear as the technical indicators head firmly lower crossing their midlines into negative territory.
Resistance: 1.0245, 1.0289, 1.0438
Support: 1.0175, 1.0111, 0.9991
GBPUSD (4-Hour Chart)
The GBP/USD pair slipped on Tuesday, retreating from a multi-week high and dropping below the 1.2200 mark in the early US session amid renewed strength witnessed in the US dollar. At the time of writing, the cable stays in negative territory with a 0.20% loss for the day. The concerns about a global economic downturn and escalating US-China tensions ahead of US House Speaker Pelosi’s arrival in Taiwan both weighed on market sentiment, helping the greenback to find demand. For the British pound, the Bank of England is scheduled to announce its monetary policy decision on Thursday, which could be a main driver for the cable and market participants are also rising their bets for a 50 bps rate hike by the BoE.
For the technical aspect, the RSI indicator is 57 figures as of writing, suggesting that the near-term bullish bias stays intact with the RSI indicator holding above 50. For the Bollinger Bands, the price regained upside strength and rebounded from the moving average, so a continuation of the upside trend can be expected. In conclusion, we think the market will be slightly bullish as long as the 1.2178 support line holds. On the upside, a break above the 1.2277 resistance line could favour the bulls and lead to additional gains for the pair.
Resistance: 1.2277, 1.2317, 1.2381
Support: 1.2178, 1.2115, 1.2039
USDCAD (4-Hour Chart)
As the recession fears and US-China tensions over Taiwan drive safe-haven flows toward the US dollar, the pair USD/CAD witnessed some buying and touched a daily high near 1.2880 level during the US trading session. USD/CAD is trading at 1.2843 at the time of writing, rising 0.03% daily. The latest news showed that the plane of US House speaker Pelosi have landed in Taiwan, which increases tensions between the US and China. On top of that, the surging crude oil prices have provided stronger support to the commodity-linked loonie and capped gains for the USD/CAD pair as WTI rebounded towards the $96 per barrel area. The markets expect a further gradual increase of the production targets from the OPEC+ meeting on Wednesday.
For the technical aspect, the RSI indicator is 50 figures as of writing, suggesting that the upside is losing momentum as the RSI indicator drops toward the mid-line. For the Bollinger Bands, the price failed to preserve the upside strength and retreated toward the moving average, therefore some downside tractions could be expected. In conclusion, we think the market will be slightly bearish as the pair failed to break above the 1.2891 resistance line. The falling RSI also reflects bear signals.