US stock advanced on Wednesday, which is the first back-to-back gain in almost two weeks. Risk sentiment remains fragile, any upbeat surprises may lead to dramatic gains for markets amid investors’ expectations for potential disappointments. Tesla briefly jumped in extended trading after its earnings beat estimates. Besides the war in Ukraine, a slowdown in China and the prospect of the US recession, are all adding to investors’ skittishness. The European Union is preparing for a situation where Russia halts gas export to retaliate against sanctions over its invasion of Ukraine. It is worth noting that the rate decision made by the Bank of Japan and Bank of England this week. Overall, the market is still in fear of uncertainty, investors tend to wait for more information to plan their next moves.

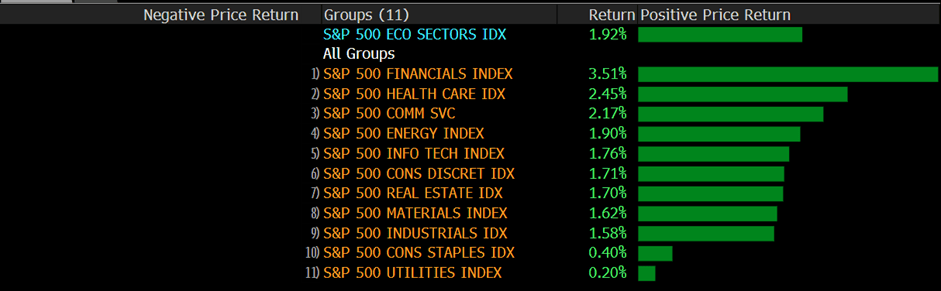
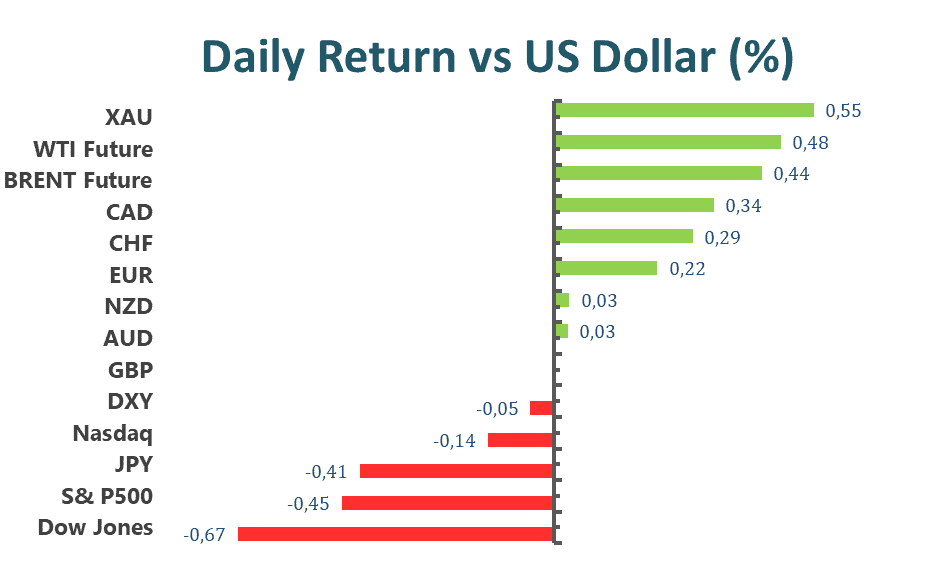
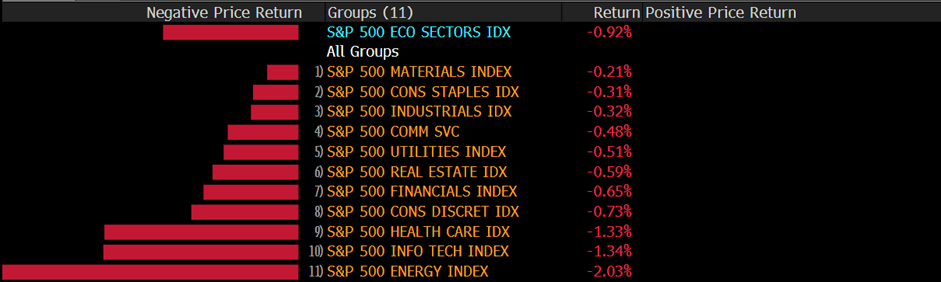
The benchmarks, S&P 500 and Dow Jones Industrial Average both advanced for a second straight training session, as the US dollar remained under selling pressure. The S&P 500 increased 0.59% daily and Dow Jones Industrial Average was up 0.15% for the day, seven of eleven sectors get in positive territory as the Consumer Discretionary and Information Technology sectors performed the best among all groups, rising 1.77% and 1.56% respectively. Meanwhile, the Nasdaq 100 also rose 1.6% on Wednesday.

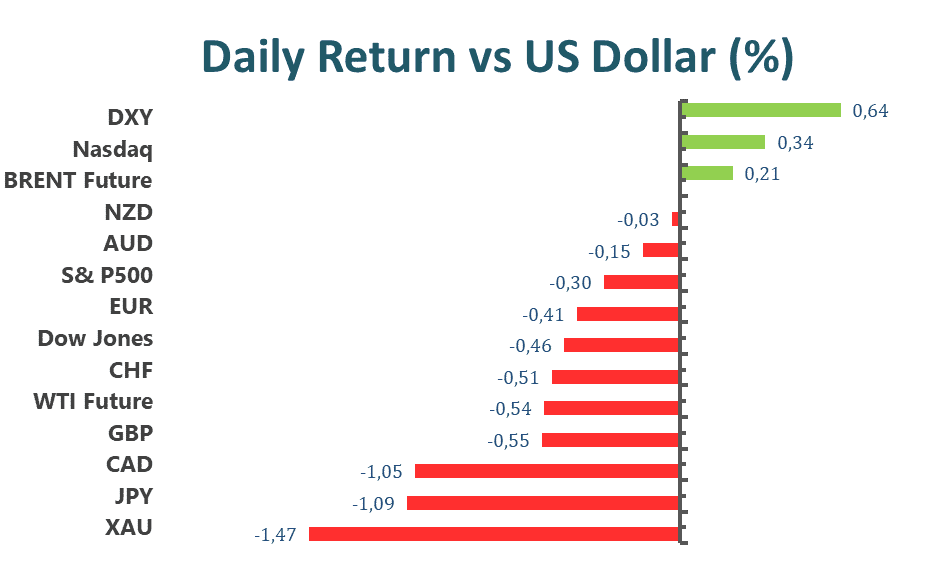
Main Pairs Movement
The US dollar advanced on Wednesday, ending its previous slide and rebounded toward the 107 area amid recession fears and a cautious market mood ahead of the European Central Bank monetary policy announcement. The DXY index was surrounded by bullish momentum during the first half of the day, then preserved its upside traction to touch a daily high above 107.2 level in the US session. The US dollar has benefitted from its haven status as investors are awaiting the outcome of the ECB meeting on Thursday, which is expected to hike the rate by 25 bps in July or even a potential 50 bps move.
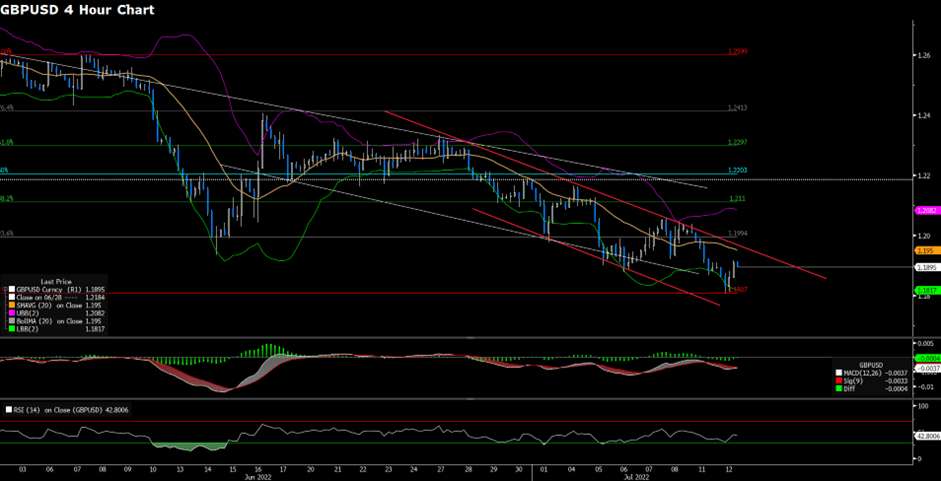
GBP/USD declined with a 0.27% loss on Wednesday amid the stronger US dollar across the board. The worse-than-anticipated UK inflation data exerted bearish pressure on the cable as the UK Consumer Price Index (CPI) jumped to 9.4% yearly in June. The GBP/USD climbed to a daily high above the 1.203 mark in the Asian session, but then witnessed heavy selling to surrender all of its daily gains. Meanwhile, EUR/USD remained under downside momentum and dropped to a daily low below 1.016 level during the US trading session. The pair was down almost 0.50% for the day.
Gold tumbled with a 0.85% loss for the day after dropping to a daily low below the $1694 mark in the late US trading session, as the rising US bond yields and stronger greenback yesterday both weighed on the precious metal. Meanwhile, WTI oil failed to preserve its upside traction and dropped to the $99 area during the US session, as the recession fears escalated amid central banks’ rate hikes.
Technical Analysis
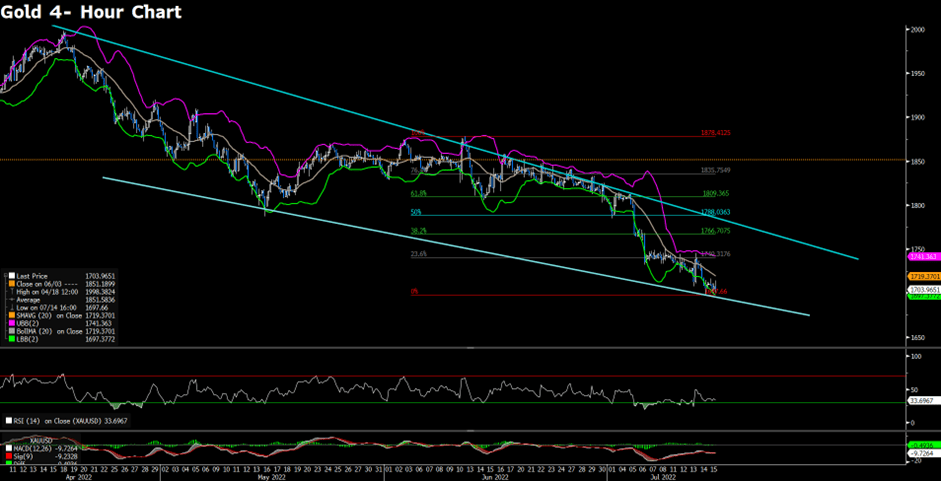
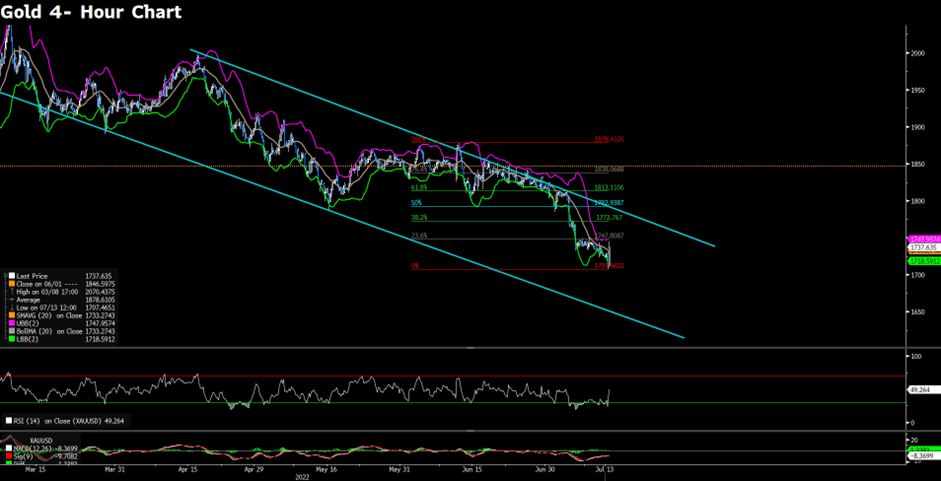
XAUUSD(4-Hour Chart)

Gold seems to consolidate along the descending channel on Wednesday. The outlook of the metal, gold, stays bearish as long as it trades within the bearish channel. On the upside, To regain upside traction, gold needs to at least climb above the descending channel onto the downside, the RSI indicator stays within the negative territory, suggesting that gold buyers are still on the sidelines. The breakout of the immediate support of 1697.66 would confirm another decline.
Resistance: 1,740.31, 1,766.70, 1,788.03
Support: 1,697.66
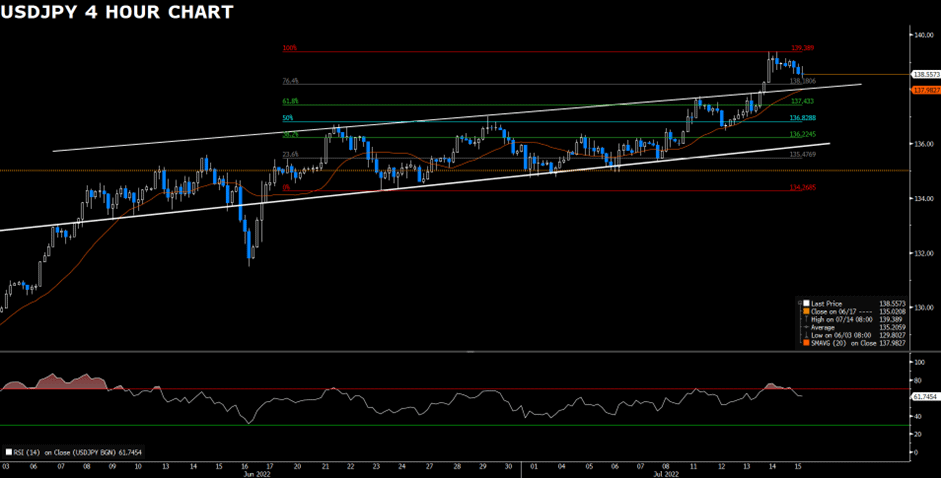
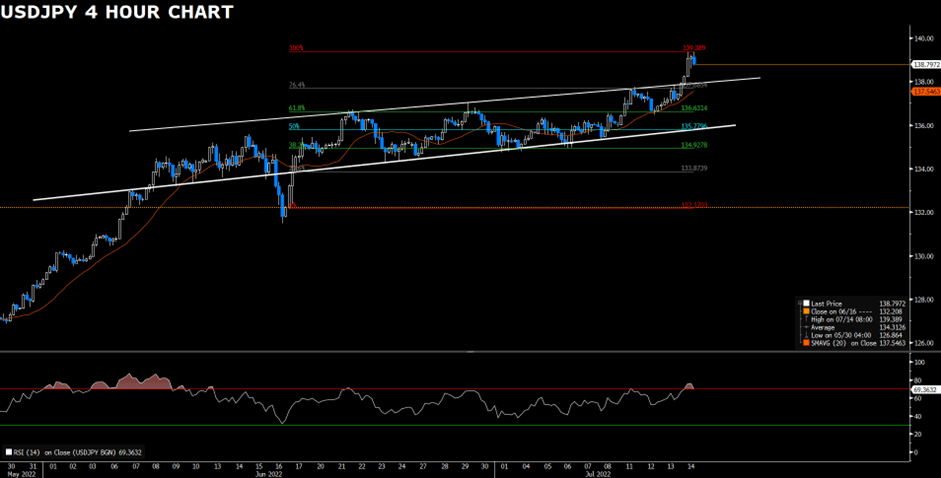
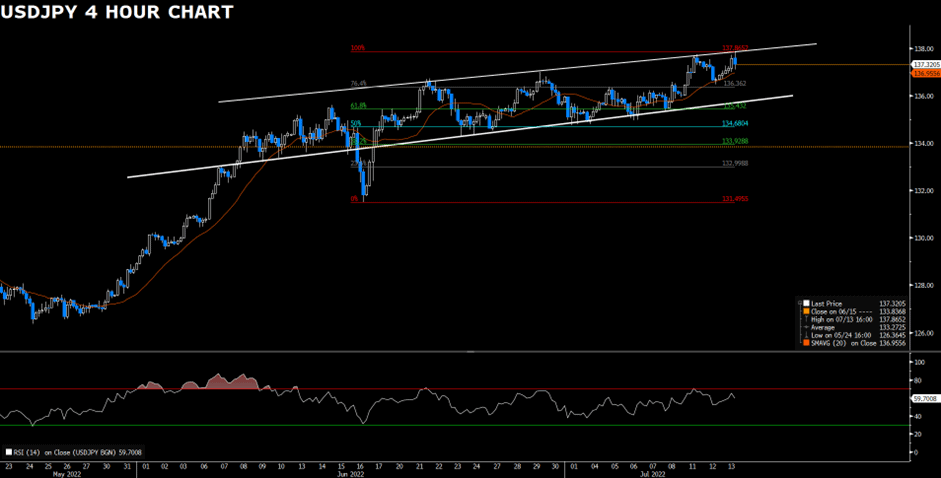
USDJPY (4-Hour Chart)

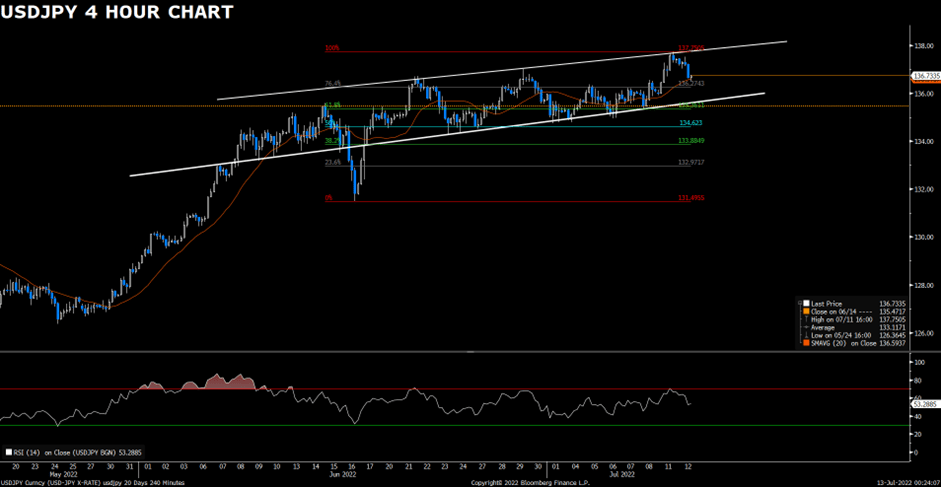
USDJPY rebounds after hitting the support level of 137.43. The intraday bias remains upside as it continues to trade within the strong bullish channel. At the time of writing, USDJPY is clinging to the upper bound of the bullish channel; a break of 138.18 will resume a larger up trend to its next resistance of 139.38. The break would be significantly important for USDJPY’s bulls as it is where the upper band of the channel and the 20 Simple Moving Average intersect. On the flip side, USDJPY’s bears need to decline below 136.22 to claim the downside momentum. Further price action eyes on the BOJ Press Conference and the FOMC meeting next week.
Resistance: 138.18, 139.38
Support: 137.43, 136.82, 136.22
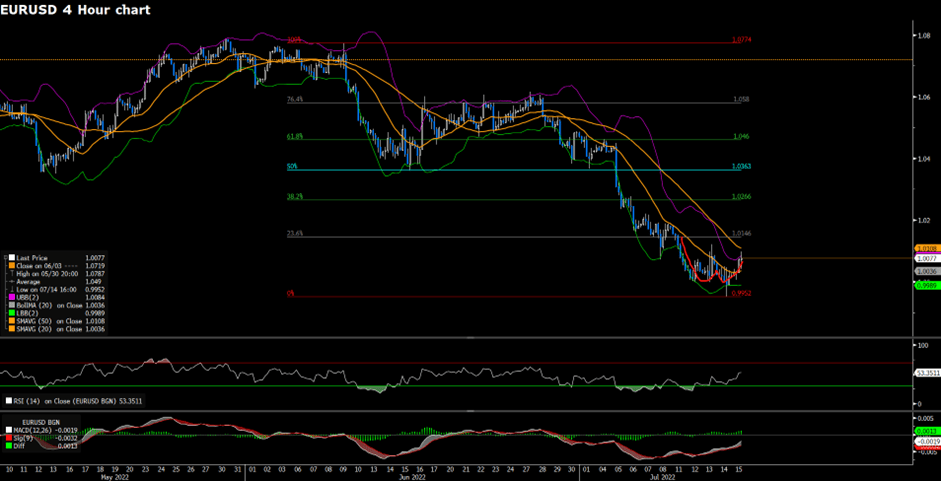
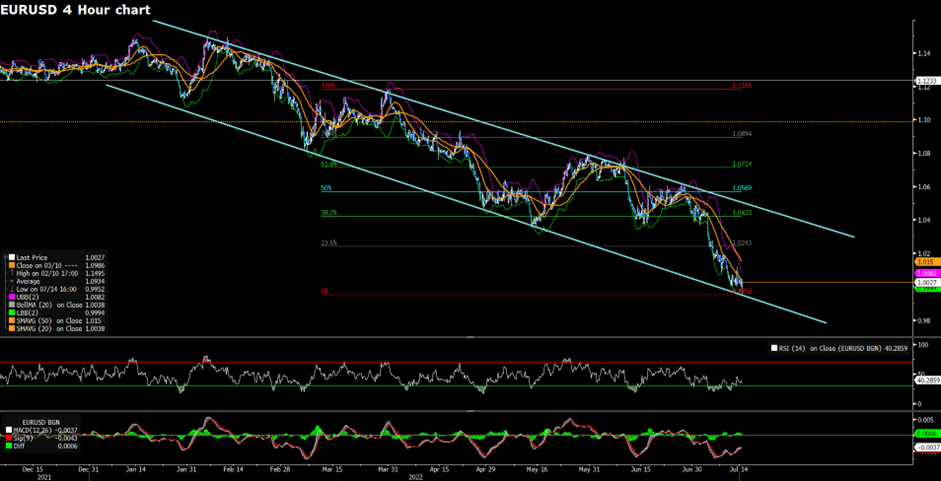
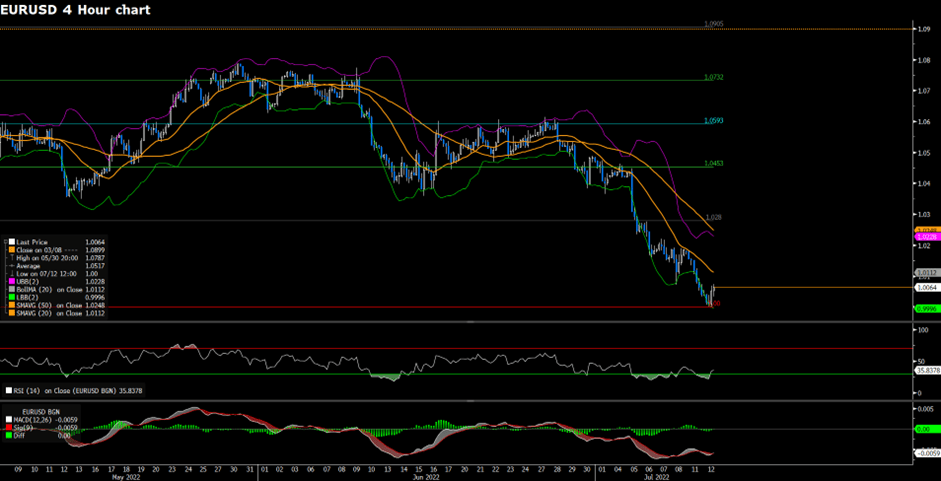
EURUSD (4-Hour Chart)

EURUSD edges lower but steadily stays above 1.0200 after US data, Existing Home Sales fell sharply in June. Investors stay on the sidelines, waiting for the ECB meeting.
From the technical perspective, bulls of the EURUSD face rejections after hitting the resistance of 1.0266; however, the short-term outlook remains upside as the EURUSD still trades above the 20 SMA and within the upper band of the Bollinger band. The upside momentum holds as long as the RSI indicator does not fall towards the negative levels and the MACD does not become bearish. On the flip side, the decline will likely pick up the pace on a break below the support level of 1.0146.
Resistance: 1.0266, 1.0363, 1.046
Support: 1.0146, 0.9952
Economic Data
| Currency | Data | Time (GMT + 8) | Forecast |
| JPY | BoJ Outlook Report (YoY) | 11:00 | N/A |
| EUR | BoJ Press Conference | Tentative | N/A |
| EUR | Deposit Facility Rate (Jul) | 20:15 | -0.25% |
| EUR | ECB Marginal Lending Facility | 20:15 | N/A |
| EUR | ECB Monetary Policy Statement | 20:15 | N/A |
| EUR | ECB Interest Rate Decision (Jul) | 20:15 | 0.25% |
| USD | Initial Jobless Claims | 20:30 | 240K |
| EUR | Philadelphia Fed Manufacturing Index (Jul) | 20:30 | -22.5 |
| EUR | ECB Press Conference | 20:45 | N/A |
| EUR | ECB President Lagarde Speaks | 22:15 | N/A |