The right-wing National Rally (NR) party secured nearly 34% of the vote.
The left-wing New Popular Front garnered just over 28%.
President Macron’s alliance came third with around 21%.
NR is close to the 289 seats needed to form a government but is projected to fall short by about 10 seats in the second round.
Market response:
Both the Euro and CAC 40 started the week strong.
CAC 40 rose by 2.5%, now at 7,685, yet still below the May 10th peak of 8,262.
The Euro increased, but further gains may be limited before next week’s elections.
EUR/USD is trading around 1.0765, near a three-week high.
Market conditions:
Anticipated tactical voting in France could heighten CAC 40 volatility.
Important upcoming US data, particularly Friday’s US Jobs Report (NFP), will impact EUR/USD movements.
Trader sentiment:
Retail trader data indicates 50.39% of traders are net-long.
The ratio of long to short traders is 1.02 to 1.
The number of net-long traders decreased by 10.75% since yesterday and 25.08% since last week.
Net-short traders increased by 21.60% since yesterday and 30.87% since last week.
A contrarian view suggests EUR/USD might fall, but recent sentiment shifts hint at a potential upward reversal despite current net-long positions.
STOCK MARKET
Market reaction:
European stocks and the euro surged on speculation that Marine Le Pen’s far-right party will struggle to secure an outright majority in the French elections, reducing investor concerns about a radical policy shift in France.
Election impact:
France’s CAC 40 Index jumped 2.8%, the largest gain since November 2022, as Le Pen’s National Rally led President Macron’s centrist alliance by a smaller margin than expected.
The Euro reached its strongest level since mid-June.
The yield spread between French 10-year bonds and German bonds narrowed, indicating reduced risk perceptions.
Market performance:
Europe’s Stoxx 600 Index rose by 1%, with banking stocks leading the gains.
Societe Generale SA, BNP Paribas SA, and Credit Agricole SA surged over 5%.
US equity futures trimmed earlier gains.
Market sentiment:
Investors showed relief as neither far-right nor far-left parties are expected to implement extreme policies.
Corporate news:
Boeing Co. agreed to buy back Spirit AeroSystems Holdings Inc. for $37.25 per share in an all-stock deal.
The US Justice Department will charge Boeing with criminal fraud.
US economic data:
Indicators suggest the US economy is cooling without lasting consumer damage.
US consumer sentiment declined less than expected, with inflationary pressures predicted to moderate.
Treasury 10-year notes showed little change.
Global market dynamics:
The South African rand led gains among emerging market currencies after President Cyril Ramaphosa announced a new business-friendly cabinet.
Oil prices edged higher amidst economic and geopolitical assessments.
Iron ore prices rose on signs of recovery in China’s property market and potential further support from Beijing.
Football and trading aren’t dissimilar – plenty of lessons to learn from the pros
We’ve all seen the news, football season is here. The excitement is building up as this year’s UEFA Champions League draws closer.
Happening at London’s Wembley Stadium, this year’s event marks the 69th season of Europe’s top club competition and the 32nd as the UEFA Champions League. Big teams like Manchester City, Real Madrid, and Bayern Munich are the ones to watch this year.
Top athletes are always inspiring, and often in ways that aren’t directly in the sport itself. Take for instance the story of someone like Manny Pacquiao – a man who overcame the odds stacked against him to become the only eight-division world champion in the history of boxing.
There is much to learn from Pacquiao about discipline, about familial bonds, and about the importance of being grateful.
Learning when to act is an art form. It’s true—there is an almost artistic quality to identifying the perfect time to get things done. This applies to all things, from business, to racing, to even cooking.
For the uninitiated, market behaviour can seem erratic and meaningless. For masters of identifying opportunity, market behaviour manifests as signals; signals that tell them how they should act in any given circumstance.
Like a star player in front of a penalty shootout, it’s about reading the often subtle signals given by the goalkeeper before striking the ball into the net.
For such master readers, swing trading is perfect. Contrary to day trading, it’s not about making rapid trades that make small differentials, but rather good, decisive trades that make a significant difference in your portfolio.
Swing trading comes with some pretty cool advantages:
You can trade without having to stare at your screen for hours on end, especially if your trades last for days or even weeks.
It’s great for people with full-time jobs (and for those who want to touch grass on a semi-regular basis)
Plus, it’s way less stressful than day trading.
Just like in football, think of swing trading as knowing when to make your move to score a goal.
To create a winning game plan, swing traders look to different tactics and setups to win. They use Trend Catching strategies and mix patterns, indicators, and strategies.
It’s kind of like how football teams have their plays and strategies. There isn’t one sure-fire winning strategy—anything can happen in the markets (or in this case, the field).
Let me indulge the football fan in me. Consider the 4-4-2 formation that consists of 3 lines: one back four, one midfield four and two strikers.
In this formation, the combination is quick, followed by a striker making a precise pass and taking a shot on goal. It’s all about timing and making sure the attackers don’t go offside.
Swing trading works the same way. When looking at the trading charts, there are 2 lines to keep an eye on.
Support: A spot on your chart where buyers are likely to jump in.
Resistance: A spot on your chart where sellers are likely to step in.
Stick close to the support and resistance levels on the candlesticks, and aim to exit at a good position, ideally after taking some profits.
In a fast-paced 90-minute football match, scoring opportunities often arise, much like the role of the Moving Average (MA) in swing trading.
While prices can be volatile and challenging to interpret, the 50 MA acts as a reliable guide for swing traders, offering a balance between short-term and long-term trends and making it a favoured tool for trend riding.
How do you choose the perfect moment to enter a swing trade?
Mastering this skill is essential for making the most of these momentum shifts in asset prices.
Using a parallel in football–while many may think Christiano Ronaldo was goal-shy between the 11th to 20th minutes in his match with Portugal, some believe that this time was used by him to strategise on how to score international goals.
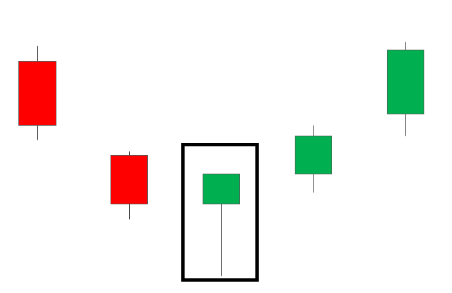
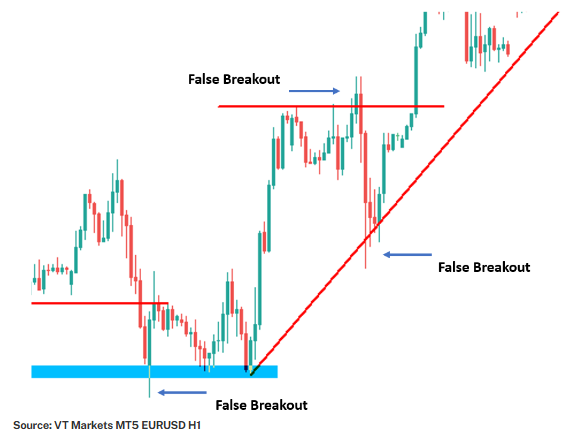
The breakout swing strategy is all about having the keen eye to spot breakouts that go beyond the usual support and resistance levels.
Let’s talk about a swing trading entry strategy that targets breakout traders who get “trapped.” These breakout traders go long when the market breaks above its highs.
But what if the market breaks out and then reverses downward? Now, these traders are “trapped” with their long positions losing value. As the market keeps dropping, it hits their stop losses, pushing prices down even more.
And this is how the False Breakout can serve as an entry trigger into a trade.
How to set your stop loss so you don’t get stopped out prematurely
In terms of positioning to make effective plays, players must create space, often passing and spreading the ball across pitch; cue Paul Scholes, master of the long pass.
Similarly, a stop loss needs a bit of “buffer” to allow the market to move in your favour. Otherwise, even if your analysis is correct, you might exit early without giving your trade enough room to breathe.
Take profits before the market reverse against you
Place your Stop Loss just below the next Fibonacci level when buying or just above when selling. This way, if the trend reverses, your losses are minimised.
· If you’re long, take profits at potential selling points like swing highs or resistance.
· If you’re short, take profits at potential buying points like swing lows or support.
But remember, past wins don’t necessarily guarantee future success. It’s up to you to assess the risk/reward ratio and choose the strategies that work best for you, keeping in mind that most trades, like plays, might not always lead to a touchdown. Stay agile, learn from each trade, and keep pushing for your goals.
Guess the 2024 Euro Cup Champion and win a prize pool of USD 1,000 this football season
Got football fever? It has its upside—VT Markets is kicking off a limited-time campaign and your football fantasy could reward you big time!
Guess the winning team, join the lucky draw, and you could walk away with a share of the prize pool. It’s just like playing the EURO Match Predictor.
Making thousands of dollars within a few clicks? Yes please!
That is the social appeal of forex trading. The instant gratification and the adrenalin rush can often blur the line between strategically trading the markets and gambling.
To sustain as a profitable forex trader long term, however, is beyond clicking the “trade” button in seeking the jackpot trade to financial freedom. The reality is successful traders maintain the discipline in risk management every single trade they take.
Only trade when the odds are in your favour
As a start, it is important to understand the dynamics of the market being traded. Every asset class has its own patterns and psychological price trigger points. But in general, most traders analyse the market with two common approaches: Technical analysis and fundamental analysis.
Technical analysis
Primarily, technical analysis is chart reading. By relying on past data in the form of indicators and price actions, one can plan a trade with the belief that the buying and selling actions of the market reflect the sentiment tied to a particular financial instrument. Indicators such as chart patterns, support and resistance levels, price trends, moving averages as well as volume and momentum indicators all fall under technical analysis.
Another aspect of analysing a market is by looking at the intrinsic value of an underlying asset via related economic and financial factors. These include macroeconomic factors, such as the state of the economy and industry conditions; to microeconomic factors, like the effectiveness of the management of a company.
Fundamental analysis tends to point to the long-term direction of an asset class. However, majority of CFD trading are short term in nature, and as such fundamental analysis tends to receive less attention.
Developing your own trading plan, and sticking to it
A trader can decide based on technical and/or fundamental analysis whether the odds favour opening a trade position in the market. However, a trading strategy must entail the level of risk exposure undertaken, and the trader must psychologically accept the risk level as planned.
Without a proper risk management strategy, opening any position in the financial markets is no different from gambling. This is how most traders have their accounts wiped out and never trade again in their lives.
The 2% rule
A good way to start is by looking at the trading capital of any given account. The common practice among traders is to risk no more than 2% of trading capital per transaction. This is also known as “the 2% rule”.
For example, in a $500 account, the maximum loss should be limited to:
2% x $500 = $10 per trade
The rationale behind this rule is founded in the possibility that a trader can be wrong fifty (50) times in a row before the account is wiped out. This greatly improves the chances of survival for a trader in the long run.
To make the execution of a trading strategy more effective, a trader can use the Stop Loss and Take Profit feature to ensure that the risk level initially planned will be adhered to. By setting a stop loss or take profit order, not only a trader can relax without staring at the screen all the time, but also remove the possibility of making an emotional decision.
Is the risk worth the reward?
The risk to reward ratio marks the potential profit a trader can earn for every dollar risked on a trade. This is used to justify if the risk is worth taking for the reward one can potential. A trade with a risk to reward ratio of 1:7 would mean that that a trader is risking $1 for the chance of earning $7.
Obviously, the higher the reward makes a trade more attractive to take, and this is how traders often plan which trades to take. The more experienced a trader is, the more he knows being selective in opening trade positions would help in surviving the markets.
Leverage: The double-edge sword
Put simply, leverage is the use of money of the broker rather than the strict use of your own, which is very common in the CFD trading industry. A trader could put down a deposit of just $500 to open trade positions up to $250,000 with 500:1 leverage.
What does that mean?
With every $1 profit you make using your own money, you can make up to 500 times of that. However, the reverse also holds true.
With every $1 profit paper loss you are holding, you will also be holding 500 times of that if your position has not been closed yet.
This is why it is important to balance the use of leverage against the 2% rule. While maxing out on leverage can lead you to the Lambo dream, it often wipes trading account out fast.
Staying cool and calm is the trick
Of all the risks, the hardest risk to manage is the emotion of the trader himself. Learning the details of how to plan a trade is nowhere as challenging as executing the trade without emotion. Often, traders stray away when the market move in a certain direction, not taking profits or stopping losses as planned.
All traders must take responsibility for their own decisions, whether this is a result of failure to plan, unexpected event or just because the trader got emotional himself.
While automation can help to negate emotional decision making, the best way to objectify this is to maintain a trading journal, jotting down the details leading to the success or failure of each trade.
Copy how others manage trading risk
If you are unsure how to manage your trading risk, consider using the Copy trading feature for a start. Copy trading is a form of social trading where new traders can replicate the trades from the seasoned traders. By doing so, you can benefit from the expertise of others as you keep learning about the financial markets.
Profits will follow if risk is managed well
Risk management is one of the most overlooked areas in trading. With a disciplined approach and good trading habits, losses can stay under control and any trader will have a chance of being profitable. Explore 1000+ assets being offered by VT Markets and tart your financial trading journey today!


