The Reserve Bank of Australia keeps interest rate steady at 3.6%, meeting expectations
The Reserve Bank of Australia (RBA) has kept the interest rate steady at 3.6%, as expected by the market. This decision comes during ongoing discussions about inflation and economic growth in Australia.
With steady economic growth and rising inflation, the RBA has chosen to maintain stable rates. Analysts are closely monitoring how this choice might impact the Australian dollar and the overall economy.
People will pay attention to the RBA’s future monetary policy updates. As conditions evolve, market participants will watch for any changes from the RBA that could influence market trends.
After remarks from RBA officials, the Australian dollar has shown strong performance, suggesting it could gain even more value. Commodity prices, particularly gold, are fluctuating due to changes in market sentiment and international economic signals.
Currency pairs like AUD/USD will be affected by upcoming economic data and global financial trends. Central banks around the world are facing similar challenges, highlighting how interconnected global markets are, which traders and analysts need to consider.
Now, looking back from December 2025, the decision to hold interest rates at 3.6% in early 2023 was just a temporary pause in a larger fight. The RBA later raised the cash rate to a peak of 4.35% that year to control inflation. After several cuts in 2024 and early 2025, the rate is now at a more neutral 3.10%, but the RBA is still holding steady.
The central bank’s cautious approach makes sense, as recent data shows inflation has been stubbornly high, rising to 3.2% in the last quarter. This rate is just above the RBA’s target range of 2-3%, creating uncertainty about whether the next move will be a rate hike or a cut. This uncertainty is causing tension in the market, presenting opportunities for derivative traders.
In the next few weeks, we expect increased market volatility ahead of the RBA’s first meeting of 2026. One strategy to consider is buying straddles on ASX 200 index futures. This allows us to profit from a significant market move in either direction, no matter what the RBA decides. This method lets us take advantage of the current uncertainty without betting on a specific outcome.
For the Australian dollar, the strong remarks from RBA officials provide solid support, especially since commodity prices remain strong, with iron ore consistently trading above $110 per tonne. With the US Federal Reserve discussing potential rate cuts for mid-2026, it appears that the AUD/USD might have an upward trend. We could consider using call options on the currency to take advantage of this potential increase while managing our risk effectively.
The Dow Jones Industrial Average appears to be forming Intermediate Wave (iv) of Primary Degree Wave 3.
The Dow Jones Industrial Average is currently forming a contracting symmetrical triangle as part of a bigger Primary Degree Wave 3, indicating a bullish trend ahead. A key support level to watch is 45,728; staying above it keeps this positive outlook intact.
The current pattern suggests a potential sharp price increase once the triangle is finished, with target prices between 49,347 and 51,726 based on Fibonacci extensions. This breakout is expected after Intermediate Wave (iv) wraps up, paving the way for Wave (v).
RSI divergence shows a decrease in momentum during this sideways movement, which often happens in fourth-wave triangles. Typically, this pattern leads to a strong price movement matching the widest part of the triangle.
As long as the Dow remains above 45,728, the preferred Elliott Wave count supports a rise into Wave (v) with a potential reaching between 49,000 and 51,000. If the Dow drops below 45,728, it may signal deeper corrections in the market.
The Dow Jones Industrial Average appears to be consolidating within a developing triangle pattern, hinting that a significant move is on the horizon. This sideways price action is supported by decreasing trade volumes as we approach the holiday season. Key support remains at 45,728.
For those looking to profit from the potential upward move, using long call options or bull call spreads on the DIA exchange-traded fund is a sensible strategy. The entry point would be a clear break above the triangle’s upper trendline, which is currently around 47,000. This optimistic view is bolstered by last week’s November CPI report, showing core inflation easing to 2.8%, nearing the Fed’s target.
A disciplined strategy includes recognizing the key point for this bullish setup. A daily close below 45,728 would invalidate the triangle pattern and potentially lead to a deeper market correction. In such a case, traders would need to quickly exit bullish positions and might consider bearish strategies like long put options.
The Federal Reserve’s choice to hold rates steady at their early December meeting supports risk assets. Additionally, we are entering a time that historically favors stocks, as the “Santa Claus Rally” often provides a seasonal boost in late December. This timing aligns well with the possibility of an upcoming breakout.
We’ve also noticed the CBOE Volatility Index (VIX) compressing to around 14, pointing to a lack of immediate concern. Such low volatility levels often precede sharp price movements, suggesting that the market is gearing up for a significant shift. This means even small, out-of-the-money options could provide great returns if the anticipated breakout occurs.
In November, Indonesia’s consumer confidence increased from 121.2 to 124, indicating improved public sentiment.
Consumer confidence in Indonesia increased from 121.2 to 124 in November, showing that people are feeling more positive about the country’s economy.
This boost can be connected to steady economic growth and stable indicators. As confidence affects spending, this trend could lead to higher consumer spending, which would help the economy grow.
Economic Implications Of Rising Consumer Confidence
Economists are paying close attention to this trend because consumer confidence drives economic growth. If confidence continues to rise, it could influence policies and market behaviors. This increase represents a hopeful change in Indonesia’s economic environment, which would benefit both businesses and investors. The jump in consumer confidence to 124 in November is a strong positive sign. It indicates that domestic demand, the foundation of Indonesia’s economy, is gaining strength as we approach the new year. We can expect more activity in consumer-focused sectors.Impact On Financial Markets
This renewed optimism is likely to boost the Jakarta Composite Index (JCI). This is supported by the solid 4.9% GDP growth seen in the third quarter of 2025, demonstrating that the economy is on stable ground. We are considering buying call options on the JCI, with expirations slated for the first quarter of 2026. For the currency market, this strong domestic outlook means that Bank Indonesia is unlikely to cut its benchmark interest rate from the current 6.25%. With inflation in November steady at a manageable 2.8%, the central bank can maintain a stable or cautious approach, which supports the Rupiah. Thus, shorting USD/IDR futures or purchasing put options on the pair could be a smart strategy. We remember a similar situation during the post-pandemic recovery in 2022-2023, where rising consumer confidence led to significant market gains. However, we also need to be aware of the potential volatility in global energy prices, which may unexpectedly affect currency and inflation. Therefore, using options to manage risk on these trades could be a more sensible approach in the coming weeks. Create your live VT Markets account and start trading now.The USD/CAD pair declines to the mid-1.3800s due to Trump’s tariff threats
The USD/CAD pair dipped a bit during the Asian session, trading between 1.3845 and 1.3850. Positive Canadian employment numbers helped the Canadian Dollar, but concerns about new US tariffs and falling oil prices limited its gains.
Crude oil’s recent price stabilization after losses negatively affected the CAD, boosting the USD/CAD pair. Optimism was tempered by rumors of potential rate cuts by the Fed. Traders are cautious, waiting for important announcements from both the Bank of Canada and the US Federal Reserve.
Factors Influencing the Canadian Dollar
The Canadian Dollar is affected by several factors, such as interest rates from the Bank of Canada, oil prices, and overall economic health. Typically, higher oil prices and strong economic data strengthen the CAD, while lower oil prices and weak economic signs can weaken it. Decisions by the Bank of Canada, like changes in interest rates, directly influence the CAD’s value. Higher interest rates usually attract foreign investment, boosting the currency’s strength. Additionally, inflation data plays a role; if inflation is high, it may lead to interest rate increases, raising demand for the currency. Economic indicators like GDP growth and employment statistics offer insights into how well the CAD might perform in the future. A strong economy tends to support a stronger Canadian Dollar, while weak economic data may cause it to decline.Struggles and Reinforcements
The USD/CAD pair is currently struggling to find its direction near the 1.3850 level, which has been a resistance point for the last two years. The market is assessing the Bank of Canada’s likely hawkish stance against expectations that the Federal Reserve may cut rates next year. This difference in outlook suggests caution before making big bets on the US dollar. The latest Canadian jobs report showed the unemployment rate dropping to 5.5%, supporting our view that the Bank of Canada will keep interest rates steady. With Canadian inflation remaining slightly above the 3% target, the Bank has little reason to suggest rate cuts soon. This fundamental strength continues to support the Canadian Dollar. Conversely, worries about the US dollar arise from forecasts of Federal Reserve rate cuts, especially as US inflation recently cooled to 2.8%. However, potential political risks from new US tariffs could create significant market volatility, reminiscent of tactics from 2017 to 2021. These tariff threats on Canadian goods pose a significant challenge for the loonie, limiting its chances for growth. The commodity sector also dampens the appeal of the Canadian Dollar, as WTI crude prices hold around $72 a barrel. This weakness in oil is tied to broader concerns about slowing global economic growth, which might reduce demand as we approach 2026. Given that oil is Canada’s largest export, ongoing low prices will likely prevent any substantial rise in the loonie. Create your live VT Markets account and start trading now.WTI oil price falls to $58.65 as Iraq boosts production at an oilfield
WTI Oil prices fell to around $58.65 in early Asian trading on Tuesday. This drop is due to Iraq restarting production at the West Qurna 2 oilfield, which increases the global oil supply.
The West Qurna 2 oilfield contributes over 460,000 barrels per day, making up about 0.5% of the worldwide oil supply. Ongoing geopolitical tensions, like the unresolved issues in Ukraine, might offer some support to oil prices.
Federal Reserve Rate Cut Expectations
The US Federal Reserve is likely to reduce rates by a quarter point in December. This could weaken the US Dollar, making oil cheaper for foreign buyers and potentially increasing demand. WTI Oil is a crude oil recognized for its low gravity and low sulfur content. It is produced in the US and traded in US Dollars, which makes its price susceptible to currency changes. Reports from the American Petroleum Institute and the Energy Information Agency weekly influence WTI prices by showing shifts in supply and demand. OPEC also plays a role by adjusting production quotas, affecting the global supply. Understanding these factors reveals the dynamics affecting WTI Oil prices worldwide.Current Market Trends and Strategies
WTI crude has dropped to about $58.50, down significantly from the $75-$80 range seen earlier this year. This decline follows Iraq’s full production restart at the West Qurna 2 oilfield, adding over 460,000 barrels per day. Traders should monitor this week’s EIA inventory report; another surprise increase, similar to last week’s 3.1 million barrel rise, would confirm the supply pressure. However, some factors may prevent further losses in the upcoming weeks. The conflict in Ukraine, which has impacted energy markets since 2022, continues to restrict Russian exports due to sanctions. Any new supply disruptions or increased conflict could quickly reverse the current price decline. The broader economic landscape is also supporting oil prices. Recent US inflation data shows a cooling trend down to 2.8%, leading markets to expect an interest rate cut from the Federal Reserve in early 2026. A weaker US dollar from this rate cut would make oil cheaper for foreign buyers and likely boost demand. Given these mixed influences, derivative traders should consider strategies for potential price swings. This dip could be a chance to buy call options for February and March contracts, anticipating a rebound driven by easing economic conditions. For those with a more bearish outlook in the short term, selling call spreads could be a defined-risk way to navigate the immediate oversupply. Create your live VT Markets account and start trading now.Trump threatened a 5% tariff on Mexico related to a water supply agreement.
US President Donald Trump has warned that Mexico might face a 5% tariff if it does not supply enough water to US farmers. This warning stems from a potential violation of a 1944 treaty that guarantees US access to water from the Rio Grande. Trump claims that Mexico owes the US 800,000 acre-feet of water under this treaty.
Currently, the USD/MXN exchange rate has risen slightly by 0.07%, reaching 18.27. Tariffs are fees on certain imports, aimed at making domestic products cheaper compared to foreign goods.
Tariffs differ from taxes in that they are paid when goods enter the country, while taxes are paid at the time of purchase. Tariffs affect importers, while taxes apply to individuals and businesses.
Economists have different views on tariffs. Some believe they protect local industries, while others argue they can lead to higher prices and trade conflicts. As the 2024 presidential election approaches, Trump plans to use tariffs to strengthen the US economy. In 2024, Mexico, China, and Canada made up 42% of total US imports, with Mexico being the largest at $466.6 billion. Revenue from tariffs might be used to lower personal income taxes.
With the potential 5% tariff on Mexico, currency markets are reacting. If this situation continues, the peso may weaken further. We should think about buying call options on the USD/MXN to benefit from a possible rise above 18.50 or even 19.00 in the coming weeks.
We’ve seen similar situations before, particularly during the trade disputes of 2018-2019. Those events showed us that tariff announcements or even threats create significant market fluctuations. Therefore, buying call options on the VIX index could be a smart move to profit from increased market uncertainty.
The automotive sector is particularly at risk due to interconnected supply chains. Recent data from the Commerce Department indicates that automotive parts trade between the two countries is set to exceed $150 billion this year. We should consider buying put options on US automakers and parts suppliers with major production operations in Mexico, as their costs are likely to rise.
This situation also threatens the larger Mexican economy, as the US is its biggest export market. By purchasing put options on a broad Mexico-focused ETF like EWW, we can express a bearish outlook on the Mexican market. A larger trade dispute could lead to a 5-10% drop in the Mexican stock index in the short run.
Finally, we need to be alert for possible retaliation from Mexico, which could involve targeting US agricultural exports. In 2018, Mexico enacted retaliatory tariffs on products such as pork and bourbon, causing prices to plummet. It would be wise to monitor futures contracts for agricultural commodities heavily exported to Mexico and be prepared to take short positions if retaliation seems imminent.
PBOC sets USD/CNY reference rate at 7.0773, an increase from 7.0764
The People’s Bank of China has set the USD/CNY exchange rate at 7.0773 for the next trading session, a small change from the previous 7.0764. The bank’s main goals are to keep prices stable and boost economic growth while pushing for financial reforms.
The People’s Bank of China is state-owned and led by the Committee Secretary of the Chinese Communist Party. Currently, Mr. Pan Gongsheng serves as both the Committee Secretary and the Governor.
Distinct Policy Tools
The central bank employs several unique policy tools unlike those in Western countries. Key tools include the seven-day Reverse Repo Rate, the Medium-term Lending Facility, foreign exchange interventions, and the Reserve Requirement Ratio. The Loan Prime Rate is the key interest rate that affects loans and mortgages. In China, there are 19 private banks, including well-known digital lenders WeBank and MYbank, which are linked to tech companies Tencent and Ant Group. In 2014, China allowed private capital to enter the mostly state-owned financial sector. The slight drop in the Yuan to 7.0773 indicates that the central bank is okay with a slow depreciation versus the dollar. This small adjustment suggests a policy that may help exports, given recent economic data. For derivative traders, it hints that the PBOC is not trying to defend a specific exchange rate aggressively right now. It’s important to note that this adjustment follows last week’s trade data from November 2025, showing export growth slowing to just 1.5%, much lower than expected. Added to this, a Caixin Manufacturing PMI dipped to 49.8, giving strong reasons for policymakers to guide the currency lower. These figures suggest a likelihood of further managed depreciation in the weeks ahead.Historical Precedent
This situation brings to mind 2023, when fears over the economy and a strong US dollar pushed the USD/CNY rate above 7.30. While we are not at that level now, history indicates that the PBOC will manage any decline gradually instead of making sudden changes. This makes buying options on USD/CNY calls appealing for those wanting to bet on a similar trend while minimizing risk. Given that the central bank aims for stability, we do not anticipate an abrupt devaluation, keeping implied volatility on USD/CNY options relatively low. Currently, implied volatility for 1-month options is around 4.5%, which is low considering the economic pressures. This situation could make selling out-of-the-money USD/CNY puts or using call spreads a smart strategy for collecting premium while maintaining a bullish stance on the USD. Create your live VT Markets account and start trading now.NZD/USD drops to about 0.5775 as markets expect a hawkish Fed decision
The NZD/USD pair dropped to around 0.5775 early Tuesday as the US Dollar strengthened. Traders expect a hawkish rate cut from the US Federal Reserve on Wednesday and are closely watching the delayed employment data for more information.
The Federal Reserve is anticipated to lower its rate by a quarter point at this meeting. This would be the third cut this year, bringing the federal funds rate between 3.50% and 3.75%, consistent with decisions made in September and October.
China’s Trade Surplus Effect
China’s trade surplus reached a five-month high at 111.68 billion, up from 90.07 billion the previous month. This surge provides support for the New Zealand Dollar, as China is a major trading partner of New Zealand. Upcoming data reports include the US ADP Employment Change average and JOLTS Job Openings for September and October. A surprising increase in these numbers could help limit losses for the US Dollar. The New Zealand Dollar’s value is influenced by several factors, including the health of the New Zealand economy, trade with China, dairy prices, and central bank policies. These elements can cause fluctuations in its value. Currently, with the NZD/USD pair dropping below 0.5800 on December 9, 2025, this week is crucial due to the Federal Reserve’s decisions. The market is expecting a 25-basis-point rate cut, but the focus will be on Fed Chair Powell’s “hawkish” remarks. This indicates that while a cut is coming, the Fed will not rush to make more cuts, which is boosting the US Dollar.Market Response and Strategies
Traders should brace for significant volatility around tomorrow’s Fed announcement, making options strategies appealing. A long straddle, where you buy both a call and a put option at the same strike price and expiration, could be a successful way to profit from major price swings in either direction. We saw similar market movements in late 2023 when uncertainty about the Fed’s decisions led to sharp changes in currency values. Before the Fed meeting, today’s US JOLTS Job Openings and ADP employment data will set the tone. Strong job numbers could support the Fed’s cautious approach, likely pushing the NZD/USD lower. Conversely, disappointing employment figures might challenge the hawkish perspective and trigger a significant rally for the Kiwi dollar. Additionally, China’s trade surplus hitting a five-month high provides solid support for the New Zealand Dollar. A strong Chinese economy benefits New Zealand, which may encourage some traders to sell out-of-the-money puts, believing this strong economic link will prevent the pair from falling below critical support levels. We also need to consider the rate difference between the US and New Zealand, which is a key factor. While the Fed is reducing rates to a range of 3.50%-3.75%, the Reserve Bank of New Zealand (RBNZ) kept its rate at a much higher 5.50% for most of 2024 to combat inflation. This significant yield advantage could attract buyers during major dips, especially if the Fed suggests a long pause after this week’s cut. Create your live VT Markets account and start trading now.Nasdaq futures hold key structure after rejecting 25,855, as intraday projections align within zones
Nasdaq futures hit a roadblock at 25,855, which has become a solid resistance level. During Monday’s U.S. session, attempts to break through this level were unsuccessful, confirming its role as a ceiling.
The market then reversed and fell below 25,805, resulting in a 214-point drop to the lower edge of a 6-day price channel and close to the Monthly Point of Control (POC) at around 25,591. Currently, the Index is above the important pivot level of 25,677, which is crucial for short-term trend analysis.
Intraday Trend
The intraday trend is still technically sound, with prices holding above the lower boundary of the rising channel. As of early Tuesday, the Index is trading around 25,719, focusing on a key area that will help decide future movements. Important structural zones will guide the market’s next steps. The middle structure (25,560–25,677) will be critical for market direction, while the upper structure (25,805–25,936) challenges bullish momentum. If the middle structure fails, the lower zone (25,428–25,297) will become the next support level. The daily chart reflects this trend, showing resistance at 25,855. A drop below 25,560–25,677 could significantly change the trend. The market’s path is clear: holding or breaking these key levels will determine the next significant move.Critical Decision Point
Nasdaq futures signal a crucial moment after failing to break the 25,855 barrier twice. This repeated resistance has formed a strong upper limit, and prices are now consolidating just above the important pivot at 25,677. The Volatility Index (VIX) is hovering around 16, showing market calmness but also potential complacency before the next significant movement. The market seems to be coiling within a narrow range as traders wait for final inflation data coming out next week, just ahead of the Federal Reserve’s last policy meeting of the year. The middle structure between 25,560 and 25,677 is where this tension is building. Until something prompts a breakout, prices will likely stay within this range. For a bullish scenario to emerge, we need a clear break and hold above 25,805. Such a move would likely be supported by a dovish Fed outlook and could spark a “Santa Claus rally,” where the Nasdaq 100 has often gained in December. This would lead to targets near 26,000. On the flip side, if we can’t maintain the 25,560 support level, it would signal that the recent upward momentum has faded. The developing bearish divergence on the daily RSI suggests weakening buying power, and a drop below this pivot could quickly lead to a downturn to the 25,428–25,297 support zone as traders cash in profits. This could be intensified if upcoming jobs data shows any surprises. From an options perspective, this clearly defined range makes strategies like straddles or strangles around the 25,677 pivot particularly effective for the expected volatility. For futures traders, these structural levels offer clear lines for managing risk in short-term plays. The current structure provides well-defined entry and exit points. This price behavior reminds us of the consolidation from late 2023, which preceded a breakout to new highs after the Fed’s dovish turn. The present structure suggests we are in a similar holding phase, waiting for a fundamental trigger to define the trend into early 2026. How the market resolves the situation around the 25,677 pivot in the upcoming sessions will be crucial. Create your live VT Markets account and start trading now.Week Ahead: The Fed’s Rate Cut In Focus

The quiet appearance on the charts hides a growing risk. Should BOJ officials hint at even a slight change in tone, the yen carry trade, one of the major engines behind global market performance could unwind sharply.
With the Fed now in its blackout period, policymakers are unable to guide expectations, leaving markets to lean on a single assumption: easing is coming. Although a policy rate of 3.75% is largely priced in, the Summary of Economic Projections and Powell’s delivery will decide how confidently markets extend their easing outlook into 2026.
The dot plot will be the centrepiece. Traders are looking for clear confirmation that the Fed’s projected path is aligned with what markets have already priced. Any sign of reluctance could trigger a broad repricing across FX and risk-sensitive assets.
QT Ends And Liquidity Shifts
The end of quantitative tightening marks a return to more supportive liquidity dynamics. The Fed’s recent $13.5 billion repo injection, its second-largest since the pandemic, signals strain within the funding system. Historically, when QT concludes during such periods of stress, QE often follows not long after. Although consensus expects a formal move back to QE in 2026, much may hinge on upcoming leadership changes, with Powell’s term ending in May next year.
Prediction markets currently assign Kevin Hassett a 74% chance of becoming the next Fed Chair. Should an early nomination emerge, markets may begin responding more to the anticipated stance of the incoming Chair than to Powell’s current guidance. This shift could pull forward expectations for deeper and earlier easing.
Central Bank Highlights: BOJ, RBA, And BOC
While the US is moving toward a more accommodative stance, several overseas central banks introduce their own layers of uncertainty, with the BOJ representing the most significant swing factor, supported by key signals from Australia’s RBA and Canada’s BOC this week.
If the BOJ raises rates from 0.5% to 0.75% on 19 December, a narrowing yield spread between Japan and the US would make yen-funded carry trades far more expensive to maintain or unwind.
This could force investors to liquidate US assets to settle yen liabilities, potentially triggering a swift, disorderly correction.
Such a scenario would echo previous episodes where carry-trade squeezes produced heightened volatility.
A BOJ-induced shock, however, might also push the Fed towards even more accommodative measures or an earlier re-initiation of QE to stabilise liquidity. Any near-term turbulence could therefore contrast with a more supportive longer-term environment for risk assets.
Beyond Japan, traders should also pay attention to the RBA’s policy messaging and the BOC’s rate decision, as either could influence cross-asset sentiment, particularly if they affirm or challenge the broader global easing trend.
Market Movements Of The Week
USDX
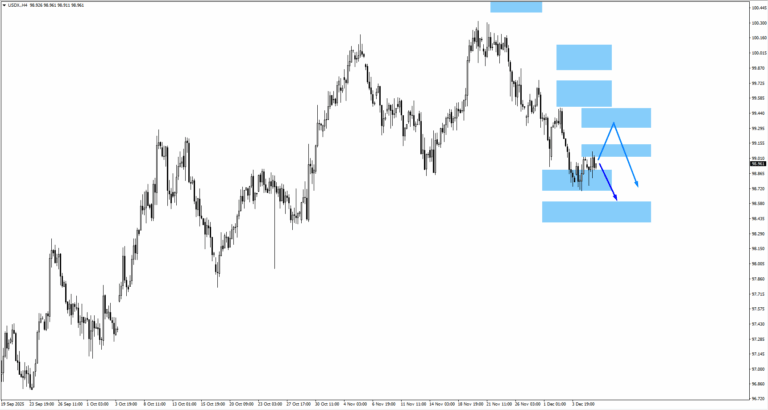
– USDX trades around the 99.10 monitored area where bearish price action is expected.
– If price moves higher, traders should watch 99.40 for renewed bearish structure.
– Downside continuation opens interest at 98.50.
EURUSD
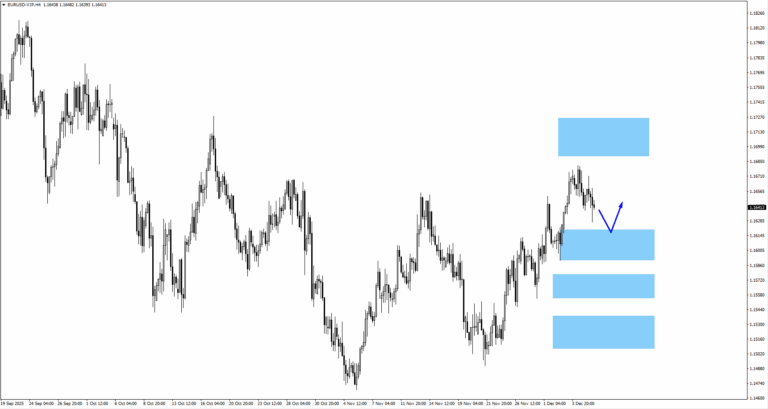
– A move lower into 1.1605 offers a zone to watch for bullish reactions.
– Upside structure may encounter resistance at 1.1710.
GBPUSD
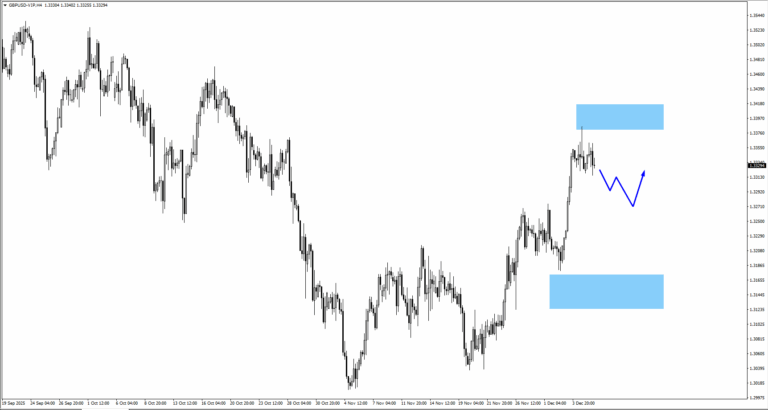
– GBPUSD rejected the 1.3405 monitored area.
– Continued consolidation lower may target 1.3250 for bullish price action.
USDJPY

– USDJPY has traded above the descending trendline.
– If price moves higher, traders should monitor 156.00 for a potential bearish reaction.
Gold (XAUUSD)
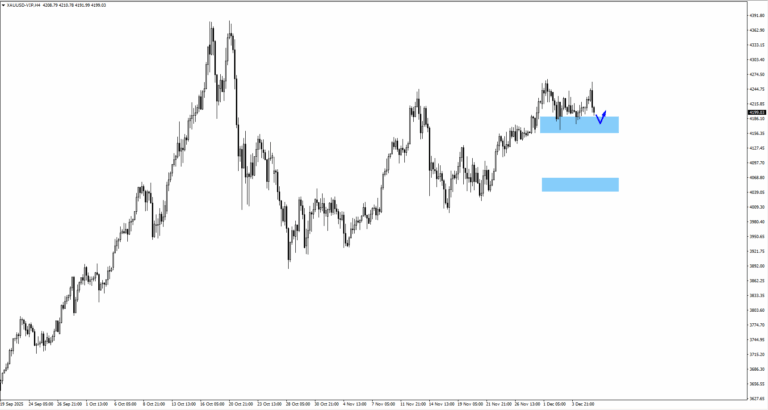
– Gold moved higher before reversing lower.
– Key level remains 4175 for near-term reactions.
– If consolidation deepens, the next bullish zone sits near 4070.
SP500

– SP500 broke above the 6888 swing high.
– Traders should monitor how the price behaves within the ascending channel.
Bitcoin (BTCUSD)
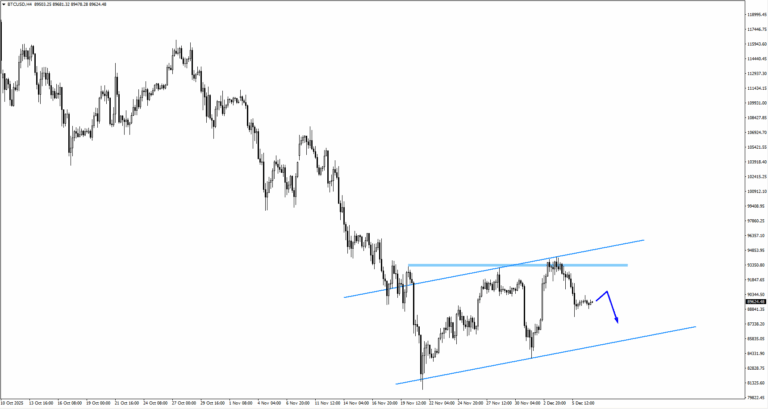
– Bitcoin turned lower after breaching the 93156 swing high.
– If consolidation continues, upside structure is monitored once price retakes 90277.
Key Events Of The Week
9 December
1. JP BOJ Gov Ueda speaks
If BOJ signals continuous hiking or a rate increase beyond expectations, USDJPY could trade lower.
2. US JOLTS Job Openings
A weak reading could spur the Fed to act beyond December and weaken USD.
11 December
1. US Federal Funds Rate, Forecast: 3.75%, Previous: 4.00%
Market has priced in the cut. Powell’s statement will likely move markets.
12 December
1. UK GDP m/m, Forecast: 0.10%, Previous: -0.10%
A rebound from negative growth. Refer to the structure.
Bottom Line
The week ahead lies at the intersection of shifting US policy and a rising wave of overseas risk factors. The anticipated Fed rate cut, combined with the end of QT, places liquidity back at the centre of market dynamics, while the BOJ’s upcoming decision may unsettle positions that have relied for years on cheap yen funding.
As these forces interact, trading conditions could tighten abruptly or open up just as quickly.
With this backdrop, attention turns to the Fed’s communication, signals from deep within the financial system, and market reactions around the key levels mapped across USD pairs, equities, commodities, and cryptocurrencies.


