NZD/USD drops to about 0.5775 as markets expect a hawkish Fed decision
The NZD/USD pair dropped to around 0.5775 early Tuesday as the US Dollar strengthened. Traders expect a hawkish rate cut from the US Federal Reserve on Wednesday and are closely watching the delayed employment data for more information.
The Federal Reserve is anticipated to lower its rate by a quarter point at this meeting. This would be the third cut this year, bringing the federal funds rate between 3.50% and 3.75%, consistent with decisions made in September and October.
Nasdaq futures hold key structure after rejecting 25,855, as intraday projections align within zones
Nasdaq futures hit a roadblock at 25,855, which has become a solid resistance level. During Monday’s U.S. session, attempts to break through this level were unsuccessful, confirming its role as a ceiling.
The market then reversed and fell below 25,805, resulting in a 214-point drop to the lower edge of a 6-day price channel and close to the Monthly Point of Control (POC) at around 25,591. Currently, the Index is above the important pivot level of 25,677, which is crucial for short-term trend analysis.
Intraday Trend
The intraday trend is still technically sound, with prices holding above the lower boundary of the rising channel. As of early Tuesday, the Index is trading around 25,719, focusing on a key area that will help decide future movements. Important structural zones will guide the market’s next steps. The middle structure (25,560–25,677) will be critical for market direction, while the upper structure (25,805–25,936) challenges bullish momentum. If the middle structure fails, the lower zone (25,428–25,297) will become the next support level. The daily chart reflects this trend, showing resistance at 25,855. A drop below 25,560–25,677 could significantly change the trend. The market’s path is clear: holding or breaking these key levels will determine the next significant move.Critical Decision Point
Nasdaq futures signal a crucial moment after failing to break the 25,855 barrier twice. This repeated resistance has formed a strong upper limit, and prices are now consolidating just above the important pivot at 25,677. The Volatility Index (VIX) is hovering around 16, showing market calmness but also potential complacency before the next significant movement. The market seems to be coiling within a narrow range as traders wait for final inflation data coming out next week, just ahead of the Federal Reserve’s last policy meeting of the year. The middle structure between 25,560 and 25,677 is where this tension is building. Until something prompts a breakout, prices will likely stay within this range. For a bullish scenario to emerge, we need a clear break and hold above 25,805. Such a move would likely be supported by a dovish Fed outlook and could spark a “Santa Claus rally,” where the Nasdaq 100 has often gained in December. This would lead to targets near 26,000. On the flip side, if we can’t maintain the 25,560 support level, it would signal that the recent upward momentum has faded. The developing bearish divergence on the daily RSI suggests weakening buying power, and a drop below this pivot could quickly lead to a downturn to the 25,428–25,297 support zone as traders cash in profits. This could be intensified if upcoming jobs data shows any surprises. From an options perspective, this clearly defined range makes strategies like straddles or strangles around the 25,677 pivot particularly effective for the expected volatility. For futures traders, these structural levels offer clear lines for managing risk in short-term plays. The current structure provides well-defined entry and exit points. This price behavior reminds us of the consolidation from late 2023, which preceded a breakout to new highs after the Fed’s dovish turn. The present structure suggests we are in a similar holding phase, waiting for a fundamental trigger to define the trend into early 2026. How the market resolves the situation around the 25,677 pivot in the upcoming sessions will be crucial. Create your live VT Markets account and start trading now.Week Ahead: The Fed’s Rate Cut In Focus

The quiet appearance on the charts hides a growing risk. Should BOJ officials hint at even a slight change in tone, the yen carry trade, one of the major engines behind global market performance could unwind sharply.
With the Fed now in its blackout period, policymakers are unable to guide expectations, leaving markets to lean on a single assumption: easing is coming. Although a policy rate of 3.75% is largely priced in, the Summary of Economic Projections and Powell’s delivery will decide how confidently markets extend their easing outlook into 2026.
The dot plot will be the centrepiece. Traders are looking for clear confirmation that the Fed’s projected path is aligned with what markets have already priced. Any sign of reluctance could trigger a broad repricing across FX and risk-sensitive assets.
QT Ends And Liquidity Shifts
The end of quantitative tightening marks a return to more supportive liquidity dynamics. The Fed’s recent $13.5 billion repo injection, its second-largest since the pandemic, signals strain within the funding system. Historically, when QT concludes during such periods of stress, QE often follows not long after. Although consensus expects a formal move back to QE in 2026, much may hinge on upcoming leadership changes, with Powell’s term ending in May next year.
Prediction markets currently assign Kevin Hassett a 74% chance of becoming the next Fed Chair. Should an early nomination emerge, markets may begin responding more to the anticipated stance of the incoming Chair than to Powell’s current guidance. This shift could pull forward expectations for deeper and earlier easing.
Central Bank Highlights: BOJ, RBA, And BOC
While the US is moving toward a more accommodative stance, several overseas central banks introduce their own layers of uncertainty, with the BOJ representing the most significant swing factor, supported by key signals from Australia’s RBA and Canada’s BOC this week.
If the BOJ raises rates from 0.5% to 0.75% on 19 December, a narrowing yield spread between Japan and the US would make yen-funded carry trades far more expensive to maintain or unwind.
This could force investors to liquidate US assets to settle yen liabilities, potentially triggering a swift, disorderly correction.
Such a scenario would echo previous episodes where carry-trade squeezes produced heightened volatility.
A BOJ-induced shock, however, might also push the Fed towards even more accommodative measures or an earlier re-initiation of QE to stabilise liquidity. Any near-term turbulence could therefore contrast with a more supportive longer-term environment for risk assets.
Beyond Japan, traders should also pay attention to the RBA’s policy messaging and the BOC’s rate decision, as either could influence cross-asset sentiment, particularly if they affirm or challenge the broader global easing trend.
Market Movements Of The Week
USDX
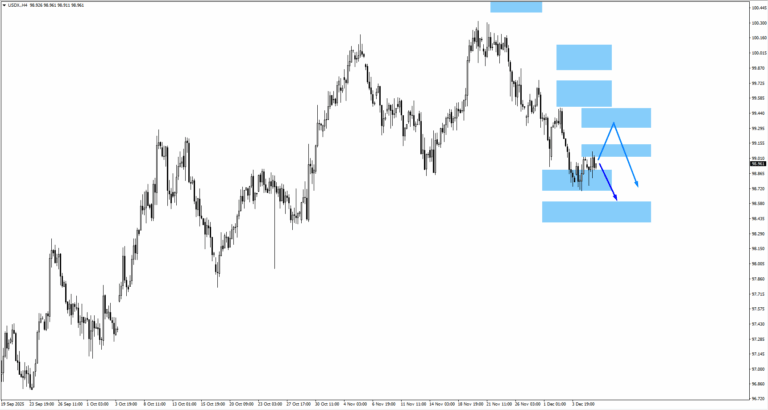
– USDX trades around the 99.10 monitored area where bearish price action is expected.
– If price moves higher, traders should watch 99.40 for renewed bearish structure.
– Downside continuation opens interest at 98.50.
EURUSD
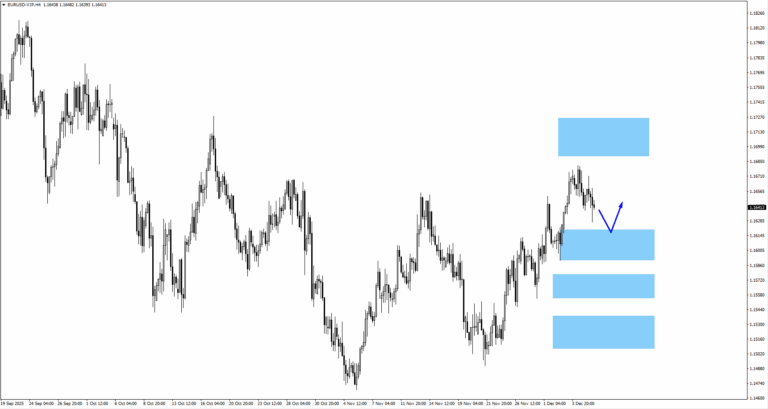
– A move lower into 1.1605 offers a zone to watch for bullish reactions.
– Upside structure may encounter resistance at 1.1710.
GBPUSD
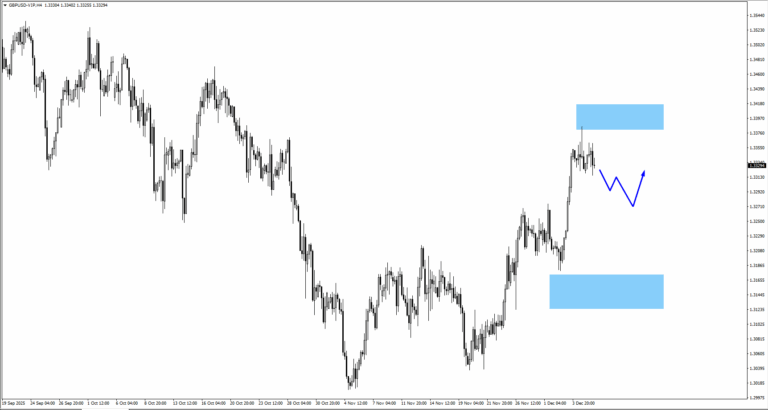
– GBPUSD rejected the 1.3405 monitored area.
– Continued consolidation lower may target 1.3250 for bullish price action.
USDJPY

– USDJPY has traded above the descending trendline.
– If price moves higher, traders should monitor 156.00 for a potential bearish reaction.
Gold (XAUUSD)
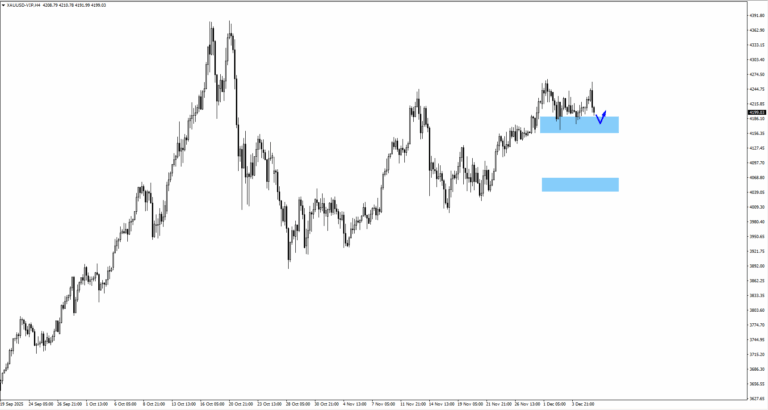
– Gold moved higher before reversing lower.
– Key level remains 4175 for near-term reactions.
– If consolidation deepens, the next bullish zone sits near 4070.
SP500

– SP500 broke above the 6888 swing high.
– Traders should monitor how the price behaves within the ascending channel.
Bitcoin (BTCUSD)
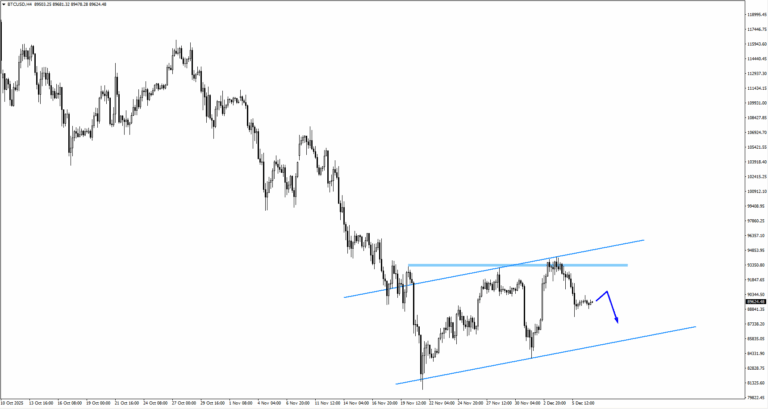
– Bitcoin turned lower after breaching the 93156 swing high.
– If consolidation continues, upside structure is monitored once price retakes 90277.
Key Events Of The Week
9 December
1. JP BOJ Gov Ueda speaks
If BOJ signals continuous hiking or a rate increase beyond expectations, USDJPY could trade lower.
2. US JOLTS Job Openings
A weak reading could spur the Fed to act beyond December and weaken USD.
11 December
1. US Federal Funds Rate, Forecast: 3.75%, Previous: 4.00%
Market has priced in the cut. Powell’s statement will likely move markets.
12 December
1. UK GDP m/m, Forecast: 0.10%, Previous: -0.10%
A rebound from negative growth. Refer to the structure.
Bottom Line
The week ahead lies at the intersection of shifting US policy and a rising wave of overseas risk factors. The anticipated Fed rate cut, combined with the end of QT, places liquidity back at the centre of market dynamics, while the BOJ’s upcoming decision may unsettle positions that have relied for years on cheap yen funding.
As these forces interact, trading conditions could tighten abruptly or open up just as quickly.
With this backdrop, attention turns to the Fed’s communication, signals from deep within the financial system, and market reactions around the key levels mapped across USD pairs, equities, commodities, and cryptocurrencies.
In November, business confidence in Australia dropped to 1, down from the previous 6.
The National Australia Bank’s business confidence index fell to 1 in November, down from 6. This drop shows that Australian businesses are feeling less optimistic about the economy. They have a more cautious view on growth and economic conditions.
Several factors may have caused this decrease, including rising inflation, changes in monetary policy, and global market uncertainties. Lower confidence can affect investment decisions and hiring plans in the near future.
As businesses adjust to changing economic times, this decline could influence Australia’s overall economic performance and growth.
With business confidence dropping sharply, we expect more volatility in the Australian market as we approach the new year. The fall to a reading of 1 indicates significant concern among businesses about the economic conditions expected in early 2026. This suggests preparation for greater volatility in the ASX 200, likely using options strategies designed to benefit from larger price movements.
This weak data makes it unlikely for the Reserve Bank of Australia to raise interest rates anytime soon. After the RBA kept rates steady at 4.60% last week, this report strengthens the belief that the tightening cycle has paused for now. We will be monitoring interest rate futures to see if the market starts to anticipate rate cuts in the second half of 2026.
The outlook is also affecting the Australian dollar, which has struggled to maintain value above 0.6500 against the US dollar. A less aggressive RBA, compared to other central banks, tends to make the currency less attractive. We see this as a chance to consider put options on the AUD/USD, betting on further declines.
We recall similar drops in confidence leading to the economic slowdown seen in late 2022 and early 2023. During that time, cyclical sectors like banking and mining performed poorly. This trend suggests it may be wise to take defensive positions or buy puts on major resource stocks like BHP.
In November, the National Australia Bank’s business conditions in Australia dropped from 9 to 7.
The National Australia Bank (NAB) reported that business conditions have decreased, dropping the index from 9 to 7 in November. This change points to less business activity and lower confidence in the Australian economy.
The survey shows a drop in demand, lower sales, and shrinking profit margins. Reasons for this decline include rising operational costs, supply chain problems, and uncertainty in economic policies.
Potential Challenges Amid Rising Inflation
We need to keep an eye on this trend due to possible challenges for the Australian economy, especially with inflation rising and global uncertainties. This situation raises concerns about the strength of Australia’s economic recovery after the pandemic, which could affect monetary policies and support measures. With business conditions at 7 in November, it appears that the Australian economy is losing momentum as we approach the new year. Recent data shows quarterly inflation has eased to 3.1%, and retail sales growth in October was just 0.1%, suggesting consumers are slowing down. This trend makes it more likely that the Reserve Bank of Australia may adopt a more cautious approach early in 2026. We suggest that traders take defensive positions on the ASX 200 index. Buying put options on the XJO or taking short positions with SPI 200 futures could help protect against a potential market decline. This approach is based on the expectation that weaker business activity will eventually impact corporate earnings and investor confidence.Market Volatility And Currency Strategies
Economic uncertainty often leads to market volatility. Australia’s volatility index, the A-VIX, has increased to 15, and it could rise even more in the coming weeks. For comparison, it shot up above 20 during uncertain economic times in 2023. Therefore, options that benefit from rising volatility may be appealing now. The weakening economic outlook is also affecting the Australian dollar. The AUD/USD currency pair has already dropped to around 0.65, and we expect it to weaken further if the market continues to anticipate future rate cuts by the RBA. Traders might consider using currency options, such as buying AUD/USD puts, to prepare for further declines. In the interest rate market, the possibility of a rate cut by mid-2026 is now being taken more seriously than a few months ago. This is evident in the rise of Australian 3-year government bond futures. Positioning for lower rates via interest rate derivatives could be a key trading strategy as we move through the first quarter of 2026. Create your live VT Markets account and start trading now.Japan’s Money Supply M2+CD increases to 1.8% (YoY) from 1.6%
Japan’s money supply, which includes currency in circulation and various deposits (M2+CD), grew by 1.8% in November compared to last year, up from 1.6% in October. This growth shows that there is a steady demand for money within the economy.
The Bank of Japan is maintaining a supportive monetary policy aimed at fostering economic growth and tackling low inflation. Meanwhile, market activity is fluctuating as investors keep an eye on global economic trends and upcoming decisions from major central banks.
Japan’s Economic Policy
The increase in Japan’s M2 money supply to 1.8% suggests that the Bank of Japan will continue its easy-money approach. This indicates that Japanese interest rates are likely to stay close to zero for a while. Traders should prepare for this ongoing policy into the next year. In contrast, the United States Federal Reserve is keeping its key interest rate around 4.5% to control inflation, which was last reported at 3.1% in November 2025. This big difference in yield is putting pressure on the Japanese Yen. There are opportunities in strategies that profit from a strong dollar against the yen, like buying USD/JPY call options or futures contracts. For stock traders, the Bank of Japan’s relaxed stance is beneficial for Japanese shares. The Nikkei 225 has already increased by over 15% this year, and the continued availability of money suggests this trend may continue. We are looking at buying call options on the Nikkei 225 index to take advantage of further potential gains.Monitoring Economic Indicators
The Bank of Japan’s caution is evident from recent data. Japan’s GDP growth in Q3 2025 was a modest 0.4%, and core inflation remains just below the 2% target. This weak economic landscape makes it unlikely for any tightening of policy in the near future. The steady policies help make long equity and short yen positions more predictable. However, we need to stay alert for volatility, particularly with the USD/JPY pair testing multi-decade highs around 158 throughout the autumn of 2025. While the underlying reasons are strong, there is a heightened risk of intervention from Japanese authorities to support the yen. This suggests that using options to manage risk could be a wise strategy for these trades. Create your live VT Markets account and start trading now.Concerns about the Fed’s hawkish stance lead to gold prices falling below $4,200
Gold prices are currently around $4,195 during the early Asian trading session. This reflects concerns about a more aggressive stance from the US Federal Reserve, even though a rate cut is expected. Markets see a 90% chance of a 25-basis point rate cut at the December FOMC meeting, up from 66% in November. Upcoming reports from ADP Employment Change and JOLTS Job Openings could affect these expectations.
Gold’s value moves inversely to the US Dollar and US Treasuries, which are major reserve assets. In 2022, central banks added 1,136 tonnes of gold, worth $70 billion, to their reserves, marking their highest annual purchase ever. Gold is often viewed as a safe asset during times of geopolitical tension or recession, typically rising as interest rates fall. Heightened tensions between the US and Ukraine may further drive interest in gold as a safe haven.
Gold Price Movements and Economic Influences
Gold prices are heavily influenced by the US Dollar, as it is traded in dollars on the global market (XAU/USD). Lower interest rates make holding gold cheaper, which usually supports its price. The current economic environment and fiscal decisions will continue to shape gold prices. Gold is pulling back to around $4,195 as the market anticipates a 25 basis point rate cut from the Federal Reserve this week. The uncertainty lies not in the cut itself but in the nature of the announcement and updated economic projections. If the Fed takes a “hawkish cut,” indicating this might be the last cut for a while, it could strengthen the US Dollar and put more pressure on gold prices. Inflation is complicating the Fed’s decision. After decreasing from 2023’s peak, inflation data has remained sticky, staying just above 3% for several months. This persistent inflation makes us believe the Fed will be cautious in its forward guidance, even while delivering the anticipated rate cut. While the headline news may seem positive for gold, the underlying details may not be. Adding to this complexity, the latest JOLTS Job Openings report was lower than expected at 8.45 million, continuing a cooling trend since late 2024. This weak labor market data suggests a slowing economy, which typically favors a more dovish Fed and supports gold. However, this creates a conflict with the persistent inflation, making the Fed’s statement on Wednesday critical for market direction.Trade Strategy Considerations
For derivative traders, this situation indicates a likely spike in implied volatility around the FOMC press conference. Strategies that profit from significant price movements—like long straddles or strangles on gold futures options—could be effective. These positions would benefit from a decisive move above $4,250 or below $4,150, regardless of the direction. If we must take a directional stance, call options would be a sensible way to bet on a surprisingly dovish outcome. A dovish tone could prompt a significant rally, and options would limit risk if the Fed appears more hawkish than expected. On the other hand, put options could serve as an affordable hedge against a steep drop in gold if the dollar strengthens sharply on a hawkish message. We also need to consider the strong support for gold from central banks, which have continued their aggressive buying trend from 2022 and 2023. According to World Gold Council data, central banks have been net buyers through the third quarter of 2025, providing consistent demand. This ongoing buying behavior and simmering geopolitical tensions should help protect against significant drops in gold prices. Recall the market reactions during the Fed’s discussions about policy changes in late 2023, where initial responses were often reversed as further details emerged. We advise traders to prepare for initial volatility and seek confirmation before committing to long-term trades. The market is awaiting guidance, and Wednesday will reveal more. Create your live VT Markets account and start trading now.Investors await key central bank actions as GBP/USD stays around 1.3300
The GBP/USD is moving slowly, hovering just above the 1.3300 mark at the start of the week. Traders are focused on the upcoming Federal Reserve interest rate decision, with many expecting a third consecutive cut.
The Fed will announce its rate decision on Wednesday, December 10, after two days of meetings. The market has priced in over 90% chance of a 25-basis point cut, which would be the third this year. Analysts are eager to hear from Fed Chair Jerome Powell, who is likely to take a cautious, data-driven approach.
In the UK, economic activity is slow this week, but attention will shift to next week with anticipation of a potential interest rate cut from the Bank of England. The BoE has been leaning towards lowering rates after its recent decision to keep them unchanged narrowly.
This indicates different strategies between the US and UK regarding future monetary policy, which will affect GBP/USD movements. Traders will be closely monitoring announcements from both central banks.
As of December 9, 2025, the GBP/USD pair appears calm just above 1.3300 before tomorrow’s Federal Reserve announcement. However, there is tension behind this quietness. One-week implied volatility for GBP/USD options has surged to over 12%, a notable rise from last month’s 7% average. This suggests that traders expect the current calm won’t stick around for long.
The market is almost fully expecting a 25-basis point rate cut from the Fed tomorrow, a belief supported by recent weak economic data. For example, the last Non-Farm Payrolls report showed a slowdown in job growth to just 95,000, giving the Fed room to adjust its policy. Traders will be focused on Chair Powell’s guidance, as any hints about future cuts into 2026 could drive significant market movements.
We should also watch for actions from the UK next week, as the Bank of England may signal its own rate cut. The UK’s latest CPI inflation rate dropped to 1.8%, below the 2% target, strengthening the case for easing. This creates uncertainty for the pound sterling in the coming weeks.
For those trading derivatives, this is an ideal opportunity for strategies that thrive on significant price moves, regardless of direction. Traders recall the sharp currency fluctuations in late 2023 when central banks were rapidly raising rates, and a shift to coordinated easing could be just as volatile. Options strategies like long straddles could be placed to take advantage of the expected breakout following the central bank meetings.
Trump warns of strict tariffs on Canadian fertilizer to boost domestic production.
US President Donald Trump has suggested he might impose tariffs on Canadian fertilizer to encourage more local production. He mentioned that this step could be necessary because a significant amount of fertilizer is imported from Canada.
Currently, the USD/CAD exchange rate stands at 1.3851, up by 0.18% today. The value of the Canadian Dollar (CAD) is influenced by various factors, including interest rates set by the Bank of Canada, oil prices, the economy’s overall health, inflation, and the trade balance.
Exchange Rate Influences
The interest rate decisions made by the Bank of Canada significantly affect the Canadian Dollar, with a goal to keep inflation between 1-3%. Typically, when oil prices rise, the CAD strengthens since oil exports are crucial for Canada’s economy. Inflation impacts the CAD by affecting interest rates; higher rates can attract foreign investment. Economic indicators like GDP and employment levels also play a role in determining the value of the CAD. A thriving economy may lead to increased interest rates, boosting the currency, while poor data can have the opposite effect. Other macroeconomic indicators, such as consumer confidence and manufacturing indices, also influence the CAD’s value. The potential tariffs on Canadian fertilizer create additional uncertainty for the CAD. Following this news, the USD/CAD pair rose to 1.3851, indicating the market’s sensitivity to renewed trade tensions. This situation mirrors the volatility seen during trade negotiations in the late 2010s.Trade Relationships and Market Reactions
The tariff threat is significant because the U.S. has strong trade ties with Canada, importing over $7.2 billion worth of fertilizer products in 2024. Disruptions in this trade could impact currency markets and affect agricultural input costs in the U.S., turning this issue into more than just political talk. Presently, the CAD faces challenges due to differences in interest rates. The Bank of Canada’s key rate is at 4.25%, while the U.S. Federal Reserve’s rate is 5.25%, drawing capital toward the U.S. dollar. This talk of tariffs could push the USD/CAD pair towards the 1.40 mark, a level not held since the market fluctuations of 2020. We should also monitor oil prices, which support the Canadian economy. Currently, West Texas Intermediate (WTI) crude is stable at around $85 a barrel, typically a positive sign for the CAD. If the CAD continues to weaken despite steady or rising oil prices, it would suggest that trade concerns are overshadowing economic fundamentals. In the upcoming weeks, considering put options on the Canadian Dollar could act as a hedge against this political risk. The implied volatility on the USD/CAD is likely to rise, making it wise to establish these protective positions sooner rather than later. This strategy allows us to capitalize on potential declines while clearly defining our maximum risk. However, we should also remain prepared for the possibility that this could be a negotiation tactic with no actual tariffs being imposed. A particularly strong Canadian employment report or a more aggressive stance from the Bank of Canada could trigger a quick reversal. Therefore, using defined-risk option strategies is preferable to simply holding short positions in the currency. Create your live VT Markets account and start trading now.Earthquake in Japan drives USD/JPY pair towards 156.00, attracting buyers
**JPY Faces Pressure, But Rate Hike Hopes Remain Strong**
The US dollar may experience a rate cut from the Federal Reserve on Wednesday. This expectation comes from weaker US economic data, with a nearly 90% chance of a cut, according to the CME FedWatch Tool.
Key factors affecting the Japanese Yen include Japan’s economic performance, Bank of Japan (BoJ) policies, and the bond yield differences between the US and Japan. The Yen is often a safe-haven investment, drawing in traders during uncertain times.
Changes in BoJ policy, especially the slowing of its ultra-easy approach, impact the Yen’s value. Currently, the difference between US and Japanese bond yields favors the USD, though this gap is narrowing as policies evolve.
**Opportunities in Monetary Policy Divergence**
The initial reaction to Monday’s earthquake pushed USD/JPY toward 156.00, a typical response amid domestic uncertainty. We see this as a short-term reaction that might create an opportunity. Historically, significant domestic events in Japan, like the 2011 Tohoku earthquake, led to Yen strength as insurers and companies repatriated foreign assets for rebuilding.
This temporary Yen weakness contrasts with the larger trend of differing policies between the US and Japan. With US core PCE inflation for November 2025 at 2.8%, markets predict a 90% chance of a rate cut from the Federal Reserve this Wednesday. On the other hand, Japan’s unexpected wage growth of 3.9% last month has raised expectations for a BoJ rate hike.
For options traders, the rise above 155.50 might be a good point to enter positions that could gain from Yen strength. We are considering purchasing USD/JPY put options expiring in January 2026 to prepare for a price reversal. A strike price near 154.00 could offer a promising risk-reward opportunity once the focus shifts back to monetary policy.
However, we need to be aware of the risk that the earthquake may lead the BoJ to postpone its planned rate hike to support the economy. After the Kobe earthquake in 1995, the BoJ cut rates a few months later to boost activity. Even though today’s inflation situation is quite different, any dovish comments from Governor Ueda in his upcoming speech could undermine the case for a stronger Yen.
This uncertainty is evident in the options market, where one-week implied volatility for USD/JPY has jumped to over 16%, a level not seen since late 2024 when interventions occurred. This suggests options are currently expensive, but it also indicates the market is preparing for significant price swings. Given this high volatility, defined-risk strategies like put spreads may be wiser than simply buying options.
Create your live VT Markets account and start trading now.


