The latest ANZ Business Outlook survey shows that business confidence has reached an 11-year high.
Business confidence in New Zealand soared to its highest level in 11 years, according to ANZ’s Business Outlook survey for November. Confidence rose by 9 points, from 58 to 67, while expected own activity increased by 8 points to a net 53%.
The NZD/USD exchange rate is up by 0.34%, currently at 0.5710. The value of the New Zealand Dollar is mainly shaped by the country’s economy and central bank policies. Additionally, China, being New Zealand’s largest trading partner, also plays a significant role.
PBOC sets the USD/CNY central rate at 7.0779, a decrease from previous levels
The People’s Bank of China (PBOC) set the USD/CNY central rate at 7.0779, a slight decrease from 7.0796 the day before. This rate was also different from the Reuters prediction of 7.0733.
The PBOC aims for price stability and economic growth. It also promotes financial reforms, such as building a stronger financial market. As a state-owned bank influenced by the Chinese Communist Party, Mr. Pan Gongsheng is the current Secretary of the CCP Committee and Governor.
Main Policy Tools
The PBOC uses different tools compared to Western economies. These include the seven-day Reverse Repo Rate, Medium-term Lending Facility, and the Reserve Requirement Ratio. The Loan Prime Rate is the main benchmark for interest rates in China, affecting loans, mortgages, and savings. There are 19 private banks in China, which make up a small part of the financial system. Major private banks like WeBank and MYbank are backed by tech giants such as Tencent and Ant Group. In 2014, China allowed private-funded banks to operate in its state-dominated financial sector. Today’s stronger Yuan at 7.0779 shows the PBOC’s goal of keeping the currency stable. This suggests they want to discourage one-sided bets against the renminbi. For derivative traders, this implies that there may not be much upside for USD/CNY in the coming weeks. This decision matches recent data, showing that China’s exports unexpectedly grew by 3.2% in October 2025, easing concerns about a downturn. With Q3 GDP growth at 4.8%, authorities likely feel confident managing the currency to attract capital inflows. This makes selling call options on USD/CNY or setting up bearish option spreads appealing for those betting on PBOC interventions.Future Outlook
The global climate also supports this perspective. Cooling inflation in the U.S. has led markets to expect possible Federal Reserve rate cuts in early 2026, putting pressure on the dollar. This is a shift from the Yuan’s rapid decline in 2023 when the Fed raised rates aggressively. As a result, we expect lower implied volatility for the currency pair, creating opportunities to short volatility with strategies like iron condors. Moving forward, we don’t expect the PBOC to make significant cuts to the Loan Prime Rate (LPR). They will likely focus on targeted support rather than broad monetary easing. The central bank will continue using various tools, including open market operations, to maintain liquidity while protecting the Yuan. Traders should be prepared for a stable USD/CNY, likely fluctuating within a narrow range due to PBOC actions. Create your live VT Markets account and start trading now.PBOC sets USD/CNY central rate at 7.0779, lower than expected
The People’s Bank of China (PBOC) has set the USD/CNY reference rate at 7.0779 for the next trading session. This is a slight drop from the previous day’s rate of 7.0796 and is above the Reuters estimate of 7.0733.
The main goals of the PBOC are to keep prices and exchange rates stable while also promoting economic growth. The bank is also focused on financial reforms and developing the market. As a state-owned entity, its leadership is influenced by the Chinese Communist Party, with Mr. Pan Gongsheng currently serving as both governor and CCP Committee Secretary.
Monetary Policy Tools
The PBOC uses several tools to manage monetary policy. These include the seven-day Reverse Repo Rate, the Medium-term Lending Facility, foreign exchange interventions, and the Reserve Requirement Ratio. The Loan Prime Rate (LPR) serves as the main interest rate, impacting loans, mortgages, and savings rates across China. China has 19 private banks in its financial system, but they make up a small part of the overall market. The largest among them are digital banks WeBank and MYbank, linked to Tencent and Ant Group, respectively. In 2014, private-capital-funded domestic lenders were allowed to operate in a mostly state-controlled sector. The PBOC has set the Yuan slightly stronger today, but this rate is weaker than market predictions. This difference suggests the bank wants to slow the Yuan’s appreciation, despite market pressure for a stronger currency. Authorities are signaling that they will actively manage the exchange rate to avoid rapid strengthening. This controlled approach appears to be a response to mixed economic data from late 2025. While China had a strong trade surplus of $75 billion in October 2025, worries about weak domestic demand indicate that a competitive export sector is critical for achieving growth targets. The PBOC is balancing the need for a stable currency with supporting its exporters.Opportunities for Derivative Traders
For derivative traders, an important point is that the PBOC is likely to limit any significant rise in the Yuan in the near term. With the US dollar showing signs of weakening throughout 2025, the trend for USD/CNY is expected to be downward, but the central bank’s efforts will likely lead to a gradual decline instead of a sharp fall. This suggests opportunities to sell volatility on the USD/CNH pair, as the bank’s guidance will probably keep the currency within a stable range. It’s worth remembering the significant pressure the Yuan faced in 2023 when the central bank defended the currency. The current policy now takes a different approach. Traders should not expect the PBOC to allow the Yuan to appreciate continuously and should stay alert for any changes to other policy tools, such as the Reserve Requirement Ratio. An unexpected adjustment there would strongly indicate the bank’s intentions about currency strength and capital flows. Create your live VT Markets account and start trading now.Dividend Adjustment Notice – Nov 27 ,2025
Dear Client,
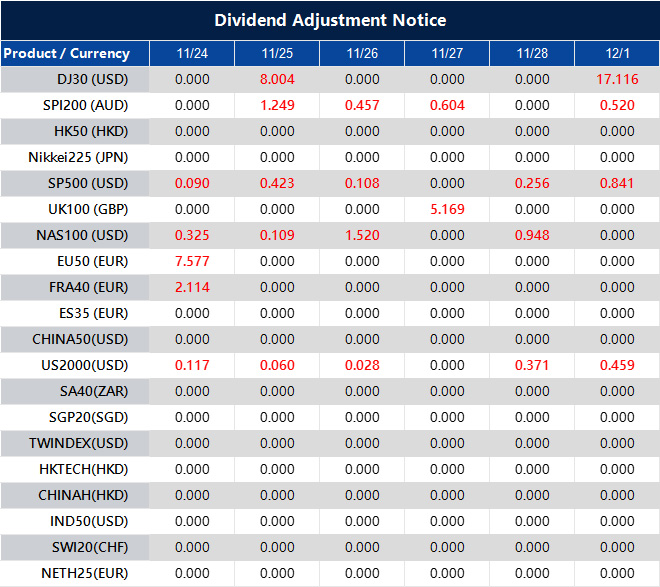
Please note that the dividends of the following products will be adjusted accordingly. Index dividends will be executed separately through a balance statement directly to your trading account, and the comment will be in the following format “Div & Product Name & Net Volume”.
Please refer to the table below for more details:
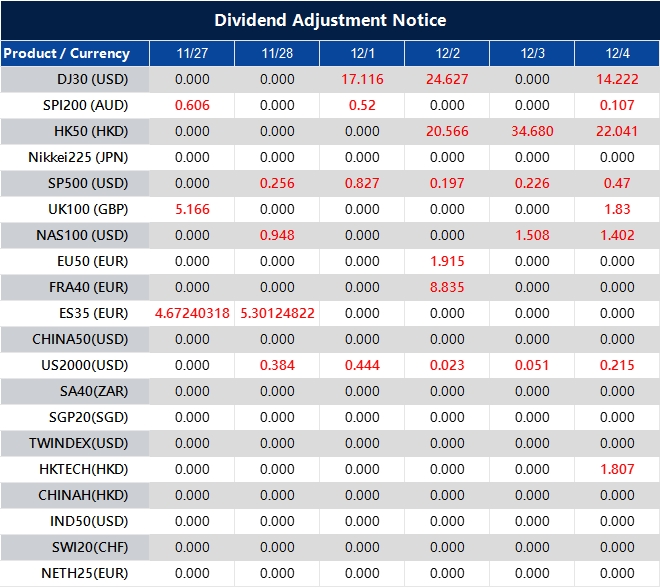
The above data is for reference only, please refer to the MT4/MT5 software for specific data.
If you’d like more information, please don’t hesitate to contact [email protected].
Dividend Adjustment Notice – Nov 26 ,2025
Dear Client,
Please note that the dividends of the following products will be adjusted accordingly. Index dividends will be executed separately through a balance statement directly to your trading account, and the comment will be in the following format “Div & Product Name & Net Volume”.
Please refer to the table below for more details:
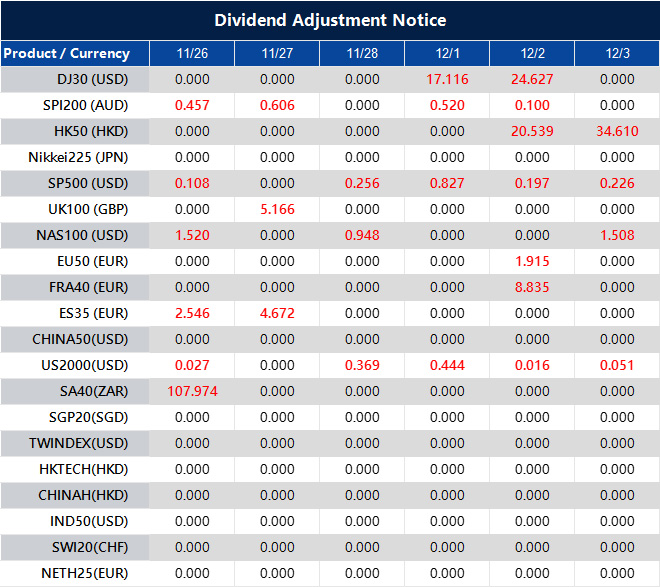
The above data is for reference only, please refer to the MT4/MT5 software for specific data.
If you’d like more information, please don’t hesitate to contact [email protected].
Monthly Analyst Scope: What’s Happening With Bitcoin Diving Below $100K?

Bitcoin has slipped back under the key $100,000 level after setting a new all-time high near $126,000 earlier this year. The drop triggered one of the biggest liquidation cascades of the cycle, wiping out more than $1 billion in leveraged long positions in a matter of hours. Sentiment quickly flipped from greed to extreme fear, even though the news backdrop looked supportive: rate cuts, the end of quantitative tightening, fresh crypto legislation, and a growing ETF pipeline.
The result? A divided market. Some traders think the cycle top is already behind us, while others believe forced selling has created an opportunity. So is this the start of a long downturn, or just a harsh reset within a bigger, liquidity-driven bull cycle? Let’s break it down.
Why Did Bitcoin Drop?
1. Hidden Leverage Finally Burst
Bitcoin’s run to new highs attracted massive margin trading across futures markets. When the price stopped climbing, these leveraged positions became unstable. As Bitcoin slipped from $120K toward $100K, automatic liquidations kicked in, each one forcing more selling and creating a loop that accelerated the crash.
2. Money Rotated Into AI And Semiconductors
Global capital shifted into stronger themes, notably AI and semiconductor stocks, boosted by improving trade talks and strong earnings. These trades looked more compelling than speculative assets like crypto.
At the same time, crypto markets showed signs of exhaustion. Good news produced weaker reactions, while bad news hit harder. It’s a classic late-stage behaviour when buyers start to tire.
3. Macro Signals Haven’t Fully Caught Up
Policy is easing, but the economy hasn’t followed through.
Interest rates are coming down. Balance sheet tightening is ending.
But activity indicators that normally pop during a recovery, especially manufacturing, remain below 50.
Some macro analysts argue the market is in a stretched cycle: conditions improving ‘on paper,’ but not yet firing the growth engines that usually boost risk appetite. In this view, the liquidity wave that typically drives post-halving rallies has been delayed, not cancelled.
Who Is Selling This Time?
1. Institutions Taking Profit Through ETFs
After months of steady inflows, spot Bitcoin ETFs suddenly flipped to net outflows as large holders redeemed shares near the highs.
2. Long-Term Holders Moving Coins To Exchanges
On-chain data shows dormant coins, untouched for long periods, started moving. Some early adopters and long-term holders used high prices and ETF liquidity to take profit.
3. Miners Increasing Sales
With rising energy costs and uncertainty around future price levels, miners sold more newly mined Bitcoin, especially after key price supports broke.
4. Companies Reducing Treasury Holdings
Some corporates that accumulated Bitcoin during earlier phases trimmed holdings to service debt or strengthen balance sheets. Amounts aren’t massive, but still add supply at sensitive moments.
5. Leverage Washout: Over $1 Billion Liquidated
As price broke key technical levels, margin and futures longs were forcibly closed, over $1B in long liquidations, delivering the final flush that pushed BTC below $100K.
Stablecoin Supply Keeps Rising. Why Does That Matter?
Even as Bitcoin sold off, the total value of USD-pegged stablecoins climbed to record highs above $300B. Both USDT and USDC continue expanding supply.
This is important for two reasons:
1. Massive ‘Dry Powder’ Inside Crypto
A key metric, the Stablecoin Supply Ratio (SSR), is currently low. Historically, low SSRs happen near cycle bottoms, meaning there is a large pool of buying power relative to Bitcoin’s size.
If confidence returns, this stablecoin liquidity can move quickly into BTC and other assets.
2. Real-World Stablecoin Usage Is Growing
Stablecoins aren’t just sitting idle. They are increasingly used for:
– Payments and remittances
– Trading on decentralised exchanges
– Lending and yield
– Global dollar funding
Regulators have been tightening reserve rules and audits, which boosts trust. So stablecoin growth reflects real application and a large war chest that can return to risk assets once fear fades.
Bear Market Or Healthy Reset?
By textbook definition, Bitcoin meets bear-market criteria:
– Down more than 20% from the top
– Sustained move below the 200-day moving average
– On-chain cost-basis indicators rolling over
Historically, when these metrics fall below their 1-year averages, momentum tends to break, signalling either a deeper correction or the start of a longer downtrend.
Key Downside Levels Traders Are Watching:
$92K–$95K → retracement zone + futures gaps
Low $80Ks → weekly 100-SMA
Mid-$70Ks → prior consolidation area
These levels aren’t guaranteed, but represent plausible bearish scenarios.
The Case For A Mid-Cycle Reset
Despite the drop, the bullish argument is far from dead.
1. Excess Leverage Has Been Flushed Out
The system handled the washout without major failures of exchanges or stablecoins.
2. Stronger Hands May Be Accumulating
Forced selling often transfers coins from weak holders to long-term buyers.
3. Valuation Metrics Are Entering ‘Deep Value’ Zones
Bitget research highlights the MVRV ratio vs. its 365-day SMA. Historically, when MVRV falls below this line during an uptrend, Bitcoin has delivered large rebounds in the months that follow.
4. Macro Signals Point To A Delayed Liquidity Wave
– Activity surveys are still soft
– Rates are now moving down
– Liquidity is slowly improving
– Governments running huge deficits
– Central banks quietly support debt loads
This environment typically supports scarce assets like gold and Bitcoin. Gold’s recent strength suggests easier conditions are building. If the expected liquidity wave arrives, it may peak closer to 2026, not 2025.
What Could Push Bitcoin Higher Again?
1. Time And Stabilisation
Markets need time to digest forced selling. Once fear fades and supply dries up, even small positive catalysts can trigger a recovery.
2. Rising Global Liquidity
With quantitative tightening ending and rate cuts underway, the broader direction is toward easier financial conditions. Crypto historically thrives when liquidity expands.
3. Regulatory Clarity And New Products
Clearer rules for digital assets and stablecoins, the growth of spot ETFs, and potential new ETF approvals for large altcoins could open fresh inflow channels.
4. The Long-Term Scarcity Narrative
Bitcoin’s role as hard digital collateral remains intact. As more value moves onto crypto networks, Ethereum and high-speed chains included, network effects can boost underlying asset valuation. In a world of steady fiat debasement, scarce assets tend to outperform.
Final Thoughts
If the business cycle eventually accelerates and liquidity returns in force, this dump below $100,000 may be remembered as a painful but necessary reset. Not the end of Bitcoin’s long-term story.
Dividend Adjustment Notice – Nov 25 ,2025
Dear Client,
Please note that the dividends of the following products will be adjusted accordingly. Index dividends will be executed separately through a balance statement directly to your trading account, and the comment will be in the following format “Div & Product Name & Net Volume”.
Please refer to the table below for more details:
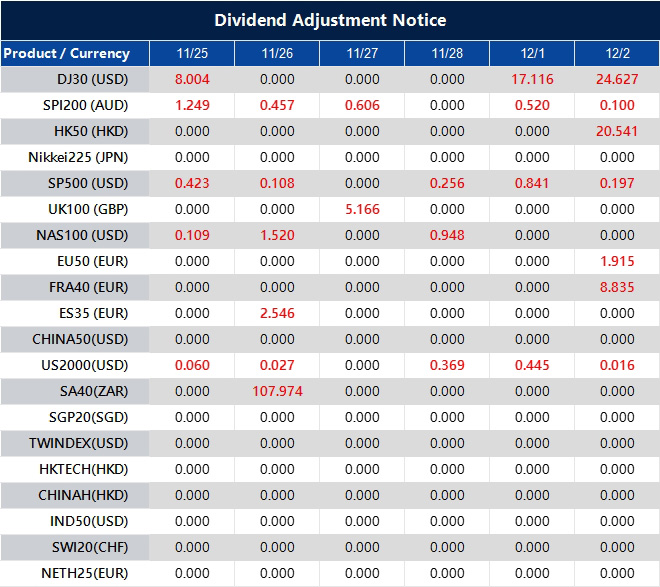
The above data is for reference only, please refer to the MT4/MT5 software for specific data.
If you’d like more information, please don’t hesitate to contact [email protected].
Nikkei Rose With The Return Of Risk Appetite
Japan’s Nikkei 225 advanced 0.8% in early Tuesday trading, clawing back part of last week’s steep decline as investors shifted back into risk assets amid rising confidence that the Federal Reserve will cut interest rates at its December meeting.
The uptick follows a choppy spell in which the index slid 3.5% last week on concerns over stretched valuations and global political tensions.
Fed Rate Cut Bets Fuel Global Optimism
According to the CME FedWatch Tool, markets are now assigning an 85% likelihood to a 25-basis-point reduction in December.
This repricing was prompted by dovish comments from Fed Governor Christopher Waller, who highlighted signs of softening in the labour market, and San Francisco Fed President Mary Daly, who expressed openness to easing next month.
The yield on the US 10-year Treasury held near 4.03%, while the two-year yield hovered around 3.49%, pointing to steady interest-rate expectations.
At the same time, the US Dollar Index (USDX) edged marginally lower to 100.2, bolstering sentiment across Asian trading.
Tech Stocks Lead The Charge
Technology names led the recovery, tracking a strong rally in the Nasdaq Composite, which jumped 2.69% on Monday, its strongest two-day run since November 2024.
Major players such as Advantest and SoftBank Group helped lift the Nikkei, echoing Wall Street’s tech-driven surge.
The MSCI Asia-Pacific ex-Japan Index climbed 1%, with Taiwan and South Korea posting solid advances as investors wager that looser monetary conditions will extend the AI-fuelled rally that has dominated markets throughout the year.
Cautious Eye On Global Politics
Despite the improved mood, geopolitical issues remain a lingering concern.
Tensions between Tokyo and Beijing continue to simmer after Prime Minister Sanae Takaichi’s comments regarding Japan’s potential military reaction to a crisis in Taiwan.
Even so, indications of warmer US–China relations, including President Donald Trump’s scheduled visit to Beijing in April, have helped ease some nerves.
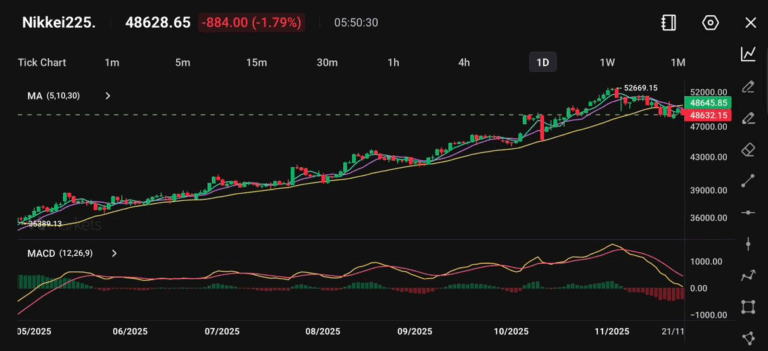
Technical Analysis
The Nikkei 225 has bounced off recent lows around 48,600, finding interim support at its 50-day moving average.
While the MACD indicator remains in negative territory, it is beginning to flatten, which could hint at stabilising momentum if buying interest persists.
Resistance lies near 49,500, with initial support at 47,800. A sustained close above 49,800 may help reinstate a bullish tone heading into December.
Outlook
With expectations for a Fed rate cut firming and sentiment towards technology stocks improving, Asian equities, particularly in Japan, may enjoy some near-term upside.
However, ongoing concerns over yen weakness, fiscal developments in Japan, and broader US–China diplomatic dynamics could temper gains as the year draws to a close.
Dividend Adjustment Notice – Nov 24 ,2025
Dear Client,
Please note that the dividends of the following products will be adjusted accordingly. Index dividends will be executed separately through a balance statement directly to your trading account, and the comment will be in the following format “Div & Product Name & Net Volume”.
Please refer to the table below for more details:
The above data is for reference only, please refer to the MT4/MT5 software for specific data.
If you’d like more information, please don’t hesitate to contact [email protected].
Week Ahead: US PPI And Preliminary GDP Take Centre Stage

After months of ‘higher for longer’ messaging, the latest labour figures point to a cooling yet still resilient jobs market. The delayed September non-farm payrolls report showed 119,000 jobs created, although the unemployment rate climbed to 4.4%, its highest level in four years. Revisions to the July and August readings suggested the broader trend is slowing.
The mixed outcome leaves the Federal Reserve treading a fine line: robust hiring in sectors such as healthcare and education sits alongside rising continuing claims.
This divergence is reinforcing the view that inflation is easing more quickly than employment conditions.
Traders Position For A December Cut
The FedWatch probabilities shifted dramatically last week. Markets now price in a 71% chance of a 25-basis-point cut at the 10 December FOMC meeting, up from just 39% the previous day. Looking ahead to January 2026, traders assign a 58% probability to an additional 25-bp cut, signalling growing confidence that the easing cycle will soon begin.
Lower bond yields have lifted equities and pressured the US dollar. The two-year Treasury yield fell towards 3.5%, while AI and technology stocks spearheaded the rally. Selling pressure in Bitcoin and Ethereum has also eased, mirroring the broader, mild “risk-on” shift fuelled by softer yields and rising expectations of a December rate cut.
Risk Appetite Returns
The S&P 500 bounced back after two consecutive weeks of declines, supported by dovish rate expectations and strong corporate earnings. More than 80% of the index’s constituents surpassed profit estimates, with technology and healthcare leading the outperformance.
Elsewhere, crude oil steadied after rebounding from the $57.60 support level, while gold remained firm near $4,000, buoyed by a softer US dollar.
Market Movements Of The Week
Gold (XAUUSD)
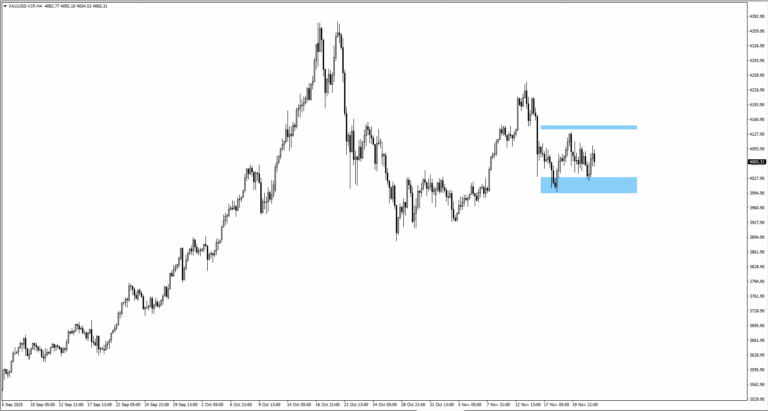
– Gold bounced from $4,020, continuing its range between $3,940 and $4,075.
– Softer yields and rising cut odds underpin support near $4,000.
– A break below $3,940 could expose $3,900, while resistance remains at $4,075.
S&P 500 (SP500)
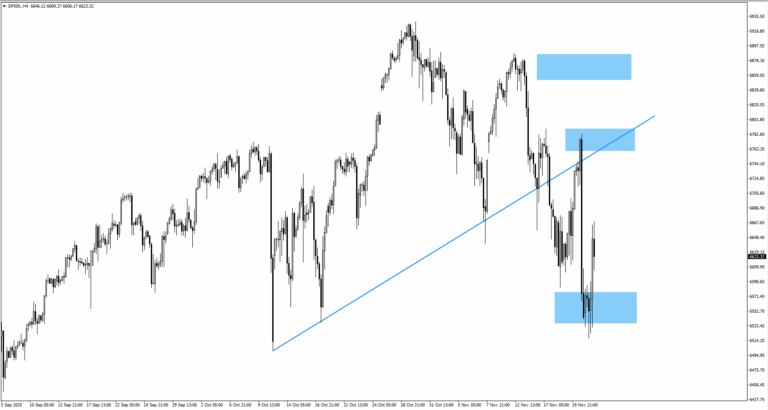
– Index rebounded as rate-cut optimism drove tech stocks higher.
– Traders watch 6,760 resistance for directional bias amid easing yields.
– Sustained buying above 6,700 could open the door to a year-end rally.
USD Index (USDX)
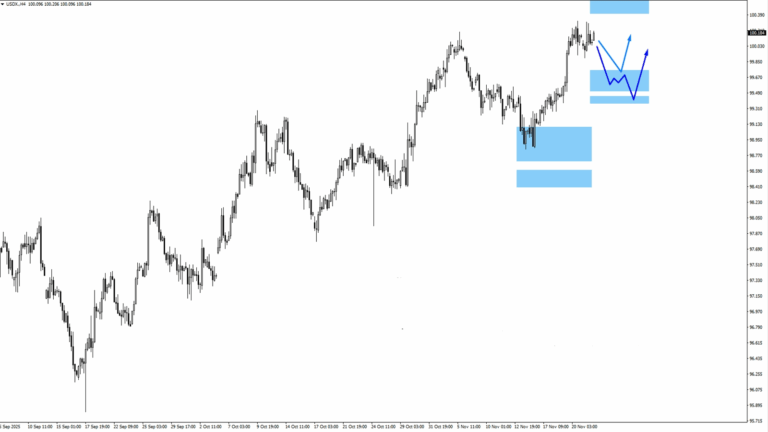
– USDX eased from its peak, testing the 99.65 zone for support.
– A bullish reversal could follow if the Fed tempers dovish expectations.
– Further downside to 99.45 remains possible if PCE cools sharply.
Bitcoin (BTCUSD)

– BTC tested $81,700, slipping amid risk rotation.
– Consolidation patterns suggest potential continuation of short-term weakness.
– Traders eye support near $80,000, with resistance around $84,000.
US Oil (USOIL)
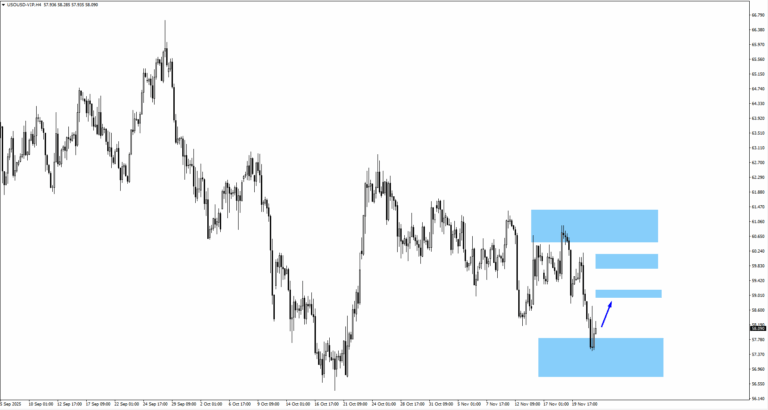
– Crude rebounded from $57.60 toward $59.80, aided by improving sentiment.
– Resistance sits at $61.05, with potential pullback zones near $59.05.
– Market focus shifts to OPEC+ signals and global demand data.
Key Events This Week
25 November
1. US PPI m/m, Forecast: -0.10%, Previous: -0.10%
Soft data could weigh on USD sentiment.
26 November
1. NZ Official Cash Rate, Forecast: 2.25%, Previous: 2.50%
RBNZ expected to maintain cautious tone.
2. US Core PCE Price Index m/m, Forecast: 0.20%, Previous: 0.20%
Inflation gauge to steer FOMC expectations.
3. US Prelim GDP q/q, Forecast: 2.50%, Previous: 2.90%
Focus on growth momentum before FOMC.
28 November
1. CA GDP m/m, Forecast: 0.20%, Previous: -0.30%
Growth rebound may strengthen CAD ahead of December data.
Market Snapshot
The latest upswing across global markets is being driven less by new economic data and more by a shift in the Federal Reserve’s tone. Comments from John Williams suggesting that policy is only “modestly restrictive” have reopened the door to near-term easing, reigniting risk appetite across equities, gold, and cryptocurrencies.
With the odds of a December rate cut now at 71%, traders have begun repricing the policy trajectory into early 2026.
For the moment, the economic picture remains mixed. The US jobs market continues to create employment, yet the jobless rate has risen to 4.4% and unemployment claims have reached their highest since 2021. Inflation risks appear to be retreating faster than economic activity, giving the Fed room to edge towards a more neutral policy stance.
A December rate cut would simply confirm what markets have already priced in, though a pause accompanied by dovish language could still help sustain the improved risk sentiment.


