Back

Could a Consumer Toilet Company Take the Same Stage as a Cloud Giant? TOTO and the Hidden AI Supply Chain

The AI trade has spent two years rewarding the loudest names: chip designers, cloud platforms, and data centre builders. Yet one of the more interesting moves in 2026 came from a company better known for bathrooms than semiconductors.

On 22 January, shares in Japan’s TOTO jumped nearly 10% and rose as much as 11% intraday after analysts pointed investors toward its electrostatic chucks, ceramic components used in chipmaking equipment and seen as beneficiaries of tighter memory supply tied to AI infrastructure demand.

What matters here is not that TOTO suddenly became an AI company. It is that part of its business that sits further upstream, in the manufacturing layer, that helps keep semiconductor production running. That is where the market has started to widen its focus—beyond computation and models and into the materials, tools, and specialised components that support the whole buildout.

TOTO’s Key Results: Why Investors Took Notice

TOTO drew market attention not because its bathroom business changed overnight, but because its advanced ceramics segment showed how AI demand can lift smaller upstream suppliers in semiconductor manufacturing.

  • In TOTO’s third-quarter FY ending March 2026 materials, advanced ceramics posted ¥47.0 billion in sales, up 37% year on year.
  • Operating profit from advanced ceramics rose to ¥20.2 billion, up ¥6.0 billion.
  • In its first-half FY ending March 2026 materials, TOTO’s business overview shows New Business Domains at 7% of the sales-mix snapshot, while the company’s reported first-half figures imply a contribution closer to 8.5% of total sales.
  • TOTO also said advanced ceramics benefited from stronger electrostatic chuck demand as data-centre-driven semiconductor demand improved.

TOTO’s Inclusion in the AI Conversation

TOTO is now being discussed in AI-related market commentary because part of its business supports chipmaking equipment, placing it inside the upstream semiconductor supply chain.

While they earn most of their money from housing and sanitary products, their advanced ceramics business indicates sales in electrostatic chucks and related components used inside semiconductor manufacturing equipment. It is being re-rated because part of its business sits upstream, where manufacturing bottlenecks can become just as valuable as algorithmic breakthroughs.

In its first-half FY ending March 2026 materials, TOTO said advanced ceramics benefited from stronger electrostatic chuck demand as the semiconductor market improved on data-centre demand, while higher operating levels at manufacturers also supported replacement demand.

How the Market Is Repricing Upstream AI Exposure

This move is less about toilets than it is about how the semiconductor supply chain is tightening under AI demand.

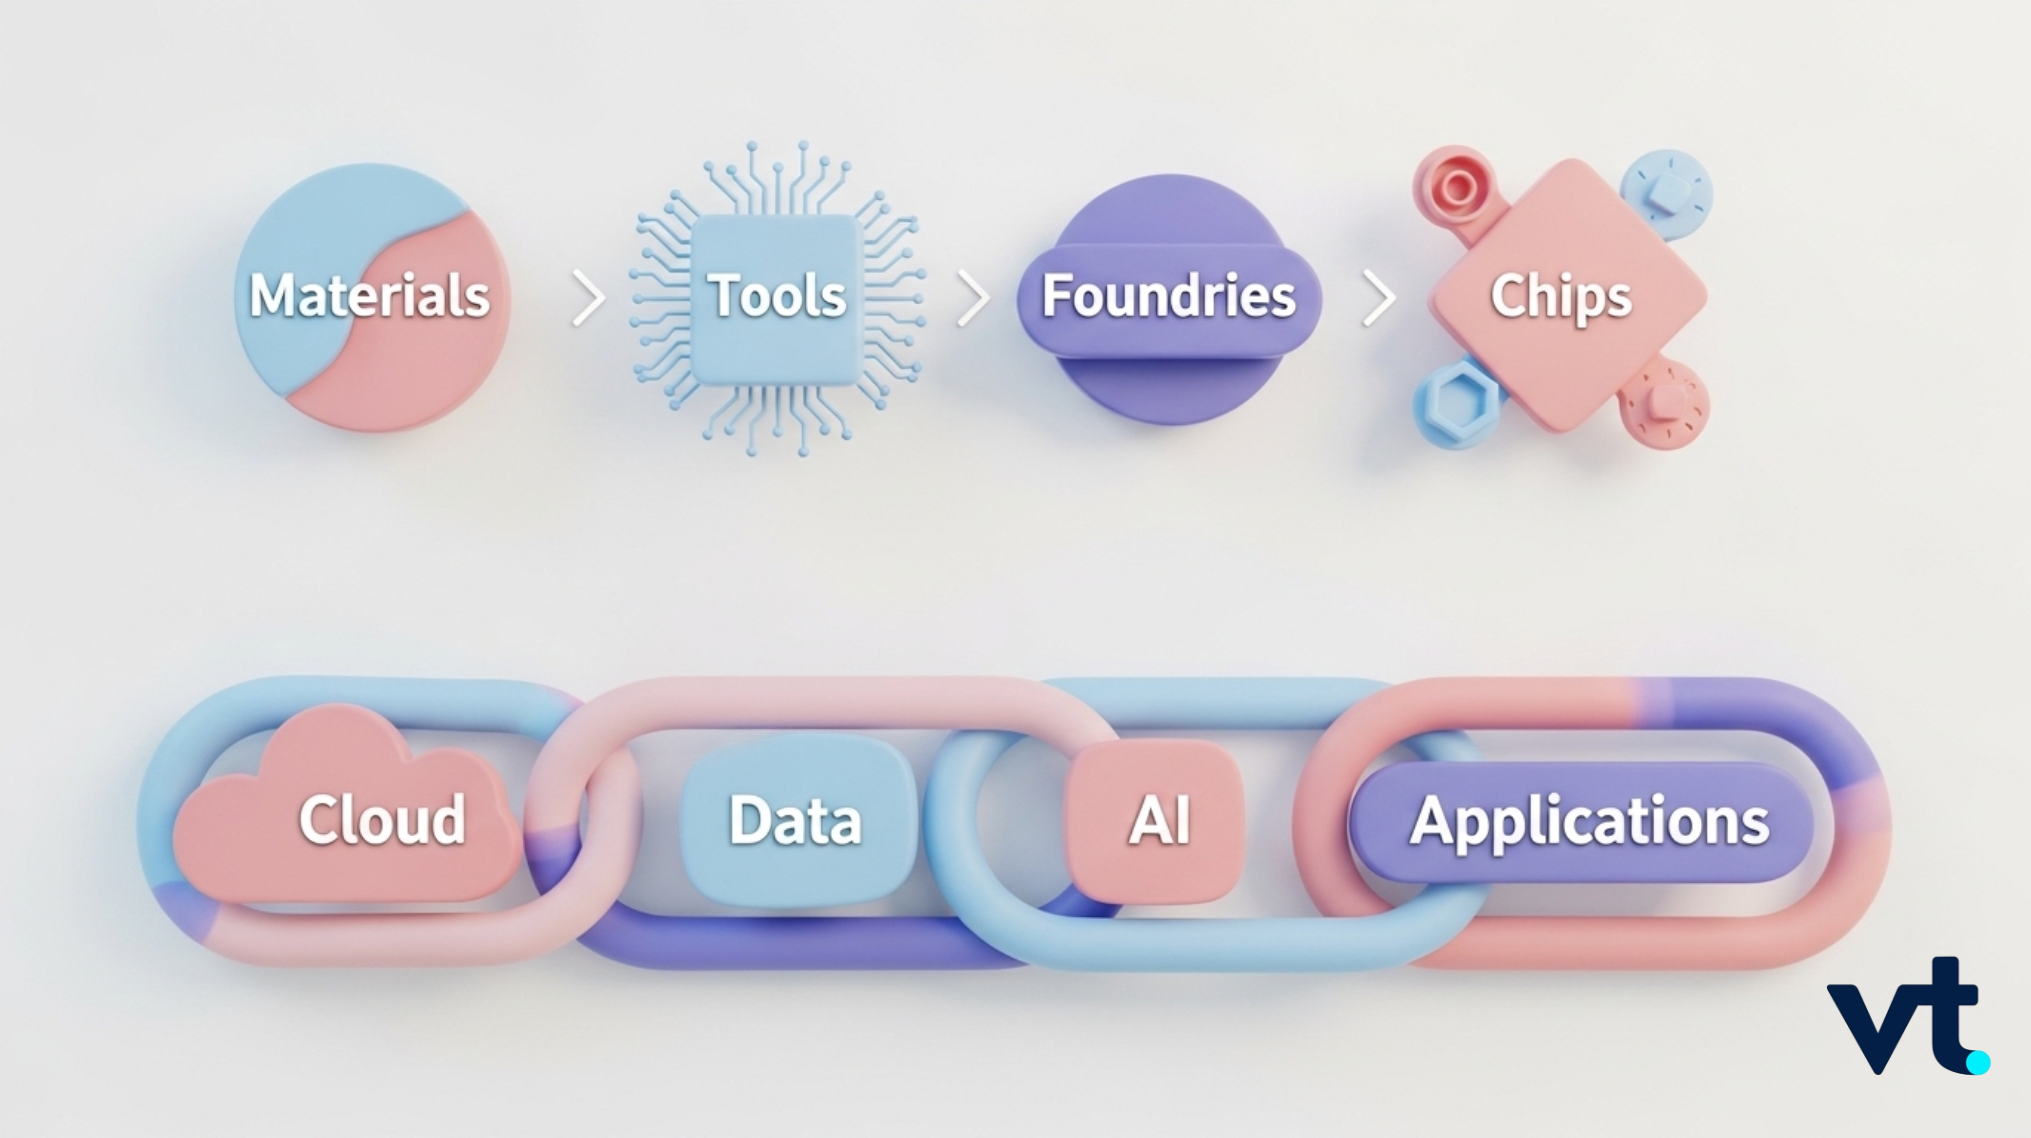
Understanding the Multi-Layered AI Supply Chain

The latest move in TOTO reflects a broader market shift. Investors are looking beyond cloud giants and chip designers to the materials, tools and production systems that support AI hardware demand.

In technical terms, more AI infrastructure means more chips, more chip output means fabs stay busy for longer, and busy fabs need more tools, more replacement cycles and more specialised components inside those tools. TOTO benefits from that last part of the chain.

The AI buildout is creating value across more layers of the market than the first wave of winners suggested.

Early Layers in the chainWhat it doesNames to watch
Upstream fab tools / process-enabling equipmentMakes deposition, etch, lithography, inspection, process-control and wafer-handling systems or critical components inside themAMAT, KLAC, LRCX, ASML, ASM, TOTO
Foundry / manufacturingManufactures the chips after tool and materials layers are in placeTSM, GFS, UMC
Materials / industrial inputs / connectivitySupplies gases, specialty materials, glass, fibre and packaging-related inputs that keep AI hardware production and data transfer runningAPD, Air Liquide, GLW, DD

Equipment intensity remains elevated because AI capacity still needs to be built. TSMC said in January that it expects 2026 capital spending of $52 billion to $56 billion, reflecting continued investment in advanced semiconductor capacity. At the industry level, SEMI said foundry and logic wafer-fab-equipment sales are expected to keep growing in 2026 as chipmakers add capacity for AI accelerators and high-performance computing.

TOTO sits in the upstream manufacturing layer, though in a more specialised form than the established equipment giants. Its connection to AI comes from the infrastructure used to make semiconductors, not from AI software, cloud applications, or chip design itself.

That places it closer to Applied Materials, KLA, Lam Research, ASML and ASM than to Nvidia-style front-end winners. Its role is smaller and more niche, but niche positions can become highly valuable when demand is strong, capacity is tight, and replacement is not easy.

Trade these available names as CFD Shares at VT Markets.

Under-the-Radar Firms in the AI Supply Chain

TOTO is not alone. A growing number of lesser-known firms are gaining attention because they serve the manufacturing, materials and connectivity layers beneath the better-known AI winners.

Corning (GLW) is adding to the data connectivity spectrum. Having reported in January to have signed a deal in worth up to $6 billion with Meta for fibre-optic cables used in AI data centres, and forecasted stronger sales on optical-fibre demand tied to data-centre and AI infrastructure needs.
Air Liquide is another example supporting industrial inputs. Capitalising on AI-related semicaonductor gas demand, including its purchase of DIG Airgas and a $250 million investment in Idaho to support Micron’s advanced memory lines.
Applied Materials shows what happens when the market already understands the same layer more clearly. Forecasting second-quarter revenue and profit above estimates, with AI chip demand and memory capacity expansions driving sales.

A useful way to think about these names is not ‘surprise AI stock’ versus ‘obvious AI stock’. It is whether the company sits at a point in the stack where demand compounds, lead times matter, and replacement is difficult.

How Your AI Portfolio Stacks Up

As always, caution is advised. Now, with more potential selection and selectivity.

Not every hidden supplier deserves the same AI adoption re-rating. Some companies are directly linked to wafer fabrication; others are loosely adjacent. TOTO’s ceramics arm sits closer to the production bottleneck than a generic industrial name, but that still does not make it a pure semiconductor stock..

When supply chains start pricing in a long expansion, valuations can move ahead of what end demand eventually absorbs. Concerns about overheating in AI investment even as memory demand remains strong.

AI Supply Chain Stocks to Watch

The more useful distinction is not whether a stock looks like a traditional AI winner. It is whether the company sits at a part of the chain where demand compounds, capacity stays tight and substitution is difficult.

Interested in the growing AI supply chain?
Monitor real-time CFD price action of these shares on VT Markets APP.

How are Upstream Chip Manufacturing Important?

AI demand still depends on semiconductor production, and that means fab tools, process systems, specialty materials and replacement cycles remain important parts of the trade. The case for these quieter names is gaining support because the AI buildout is still creating pressure in the physical layers of the supply chain, not only in software or cloud spending.

  • AI investment is still translating into production bottlenecks. Demand is continuing to flow through into semiconductor manufacturing, where capacity, process control and equipment availability still matter. Deloitte expects the global semiconductor industry to reach US$975 billion in annual sales in 2026, driven by the AI infrastructure boom.
  • Tighter memory and fab capacity are raising the value of upstream suppliers. As chipmakers add capacity for AI accelerators and high-performance computing, the importance of tooling, replacement cycles and specialised components used in wafer production rises with it.
  • Smaller specialists are starting to reflect that shift in their numbers. TOTO’s advanced ceramics unit is growing much faster than the group’s housing businesses and is highly profitable relative to its small revenue share.
  • Industrial policy is reinforcing the manufacturing backdrop. Japan, which wants domestically made chip sales to rise to ¥40 trillion by 2040 from roughly ¥8 trillion as reported in March.

Taken together, that points to a broader shift in market attention: away from AI demand only at the top of the stack, and toward the supply constraints and specialised manufacturing layers underneath it.

Market Sentiment on the AI Trade

TOTO’s rally suggests the market is beginning to reward scarcity and specialised industrial roles inside the AI chain, not only the loudest names at the top. It is starting to look further upstream, where capacity constraints, specialist tooling and hard-to-replace components can matter just as much.

That shift matters because the next phase of AI trade may depend less on obvious AI exposure and more on where scarcity sits inside the chain. For TOTO, the focus now is whether advanced ceramics can continue outgrowing the rest of the business and whether that niche role in semiconductor manufacturing keeps translating into visible earnings strength.

TOTO may be a narrow expression of the theme, but narrow can still be powerful when demand is strong and substitution is difficult. That is what makes this more than a one-day surprise rally.

Key Definitions in the Upstream AI Supply Chain

What is the upstream AI supply chain?

The upstream AI supply chain refers to the materials, tools, components and fabrication systems needed to produce semiconductors before they reach cloud platforms, AI models or end-user applications.

What are electrostatic chucks?

Electrostatic chucks are specialised components used in semiconductor manufacturing equipment to hold wafers securely during processing. They are part of the infrastructure used inside chip fabrication plants.

What is fab utilisation?

Fab utilisation refers to how fully a semiconductor fabrication plant is being used. Higher fab utilisation usually means stronger production activity, which can increase demand for replacement parts, maintenance and tool-related components.

What is equipment intensity in chip manufacturing?

Equipment intensity refers to how much specialised manufacturing equipment is needed to produce semiconductors at a certain scale or level of complexity. Higher equipment intensity often supports demand for tool makers and their supply chains.

What is a bottleneck supplier?

A bottleneck supplier is a company that provides a hard-to-replace material, component or tool in a production chain. These suppliers can become more valuable when demand rises and alternatives are limited.

Start trading now – Click here to create your real VT Markets account

Switzerland’s trade surplus increased to 4204M, up from 3818M, as February figures showed improved exports relative imports

Switzerland’s trade balance increased to 4,204M in February from 3,818M in the previous period. This marks a rise of 386M compared with the earlier figure. The February trade surplus grew to 4.2 billion francs, which points towards robust export demand and fundamental strength in the Swiss economy. This positive surprise suggests the Swiss franc (CHF) is well-supported. We should anticipate further strength in the currency in the coming weeks. This strength is not surprising when we see the details, with global demand for Swiss pharmaceuticals and watches continuing to drive exports. Recent data shows Swiss watch exports to Asia rose by over 6% year-over-year, a trend that reinforces this trade balance figure. This suggests the surplus is based on solid, ongoing business rather than a one-time event. For currency traders, this means we should look at buying call options on the CHF, particularly against the euro and dollar. The EUR/CHF pair, which has been hovering around 0.9650, could see a decisive break lower towards 0.9500. Selling puts on the franc could also be a way to position for its underlying strength. This strong economic data will likely force the Swiss National Bank (SNB) to remain on hold. We remember the franc weakening after the rate cuts back in 2024 and early 2025, but this trend may now be reversing. Any expectations for another rate cut in the second quarter should be scaled back significantly. For the Swiss Market Index (SMI), the outlook is more complex. A stronger franc can be a headwind for the large multinational exporters that dominate the index, as it hurts their overseas earnings. We should consider that while the economy is strong, this currency effect could put a cap on stock market gains for now.

Start trading now – Click here to create your real VT Markets account

Over three months, UK employment increased by 84K in January, exceeding the previous 52K estimate

UK employment change over three months was 84,000 in January. This compares with 52,000 in the previous period. The January employment report shows a significant acceleration in UK job growth to 84,000, easily surpassing the previous figure and market expectations. This unexpected strength suggests the labour market is much tighter than we previously anticipated. Consequently, this puts pressure on the Bank of England to reconsider any dovish stance on interest rates in their upcoming meetings.

Inflation Growth And The Policy Outlook

This robust jobs number, combined with the recent February inflation print that came in at 3.1%, paints a more inflationary picture for the UK economy. It also follows last week’s GDP figures which showed a modest 0.2% expansion in January, suggesting a firmer economic footing. This is a notable shift from the sentiment we saw throughout much of 2025, when recessionary fears dominated and the market was pricing in multiple rate cuts. For interest rate traders, we should expect continued selling pressure on SONIA futures as the market prices out the possibility of rate cuts for the second half of the year. Positioning for a higher-for-longer rate environment seems prudent. Looking back, the market was pricing in nearly 75 basis points of cuts for 2026 as recently as December 2025, a view which now seems highly unlikely. This provides a fundamental tailwind for the British Pound, which has already gained over 1% against the dollar this month. We anticipate increased demand for GBP call options, particularly against the US Dollar and the Euro, as traders bet on further appreciation. Implied volatility in GBP pairs is likely to creep higher from the lows seen at the start of the year. For FTSE 100 derivatives, the outlook is more complex as a stronger economy supports earnings but higher rates pressure valuations. Traders may look to options on financial sector stocks, such as banks, which typically benefit from a higher interest rate environment. This contrasts with the defensive positioning we saw in sectors like utilities for most of last year.

Implications For Rates FX And Equities

Create your live VT Markets account and start trading now.

Start trading now – Click here to create your real VT Markets account

Netherlands’ seasonally adjusted three-month unemployment rate rose from 4% to 4.1%, latest data show

The Netherlands’ seasonally adjusted unemployment rate over a three-month period rose to 4.1% in February. It had been 4.0% in the previous period. Looking back at the data from February 2025, the rise in Dutch unemployment to 4.1% was an early indicator of a softening labor market that we saw play out over the following year. At the time, this small increase was a signal that suggested potential headwinds for the Eurozone economy. This piece of data contributed to a shift in market expectations towards a more dovish European Central Bank throughout 2025.

Labor Market Signals And Policy Expectations

We now see that this trend did continue through mid-2025, but the latest figures for February 2026 show the Dutch unemployment rate has since improved, falling back to 3.8%. This recovery comes as recent Eurostat data shows Eurozone core inflation has cooled to 1.9%, comfortably within the ECB’s target range. The economic slowdown anticipated back then proved to be relatively mild and short-lived. Given this recovery and the ECB’s recent shift to a neutral policy stance, traders should consider reducing hedges that were positioned for a significant economic downturn. We believe strategies like selling out-of-the-money puts on the AEX index could be favorable, as implied volatility has decreased from its late-2025 highs of over 22% to a more stable 15% today. The focus in the coming weeks should be on a stable to moderately growing European market, rather than the slowdown that the 2025 data first hinted at.

Implications For Positioning And Volatility

Create your live VT Markets account and start trading now.

Start trading now – Click here to create your real VT Markets account

Despite Fed pause expectations, XAG/USD remains weak, hovering near 75.50 after hitting a monthly low

Silver (XAG/USD) fell to a fresh monthly low of $75.50 in late Asian trade on Thursday and then struggled to recover. The move came amid expectations that the Federal Reserve will keep rates in the 3.50%–3.75% range through the year. CME FedWatch puts the combined odds of the Fed keeping the Federal Funds Rate unchanged or raising it at 57.5%. A longer period of steady rates can support interest-bearing assets and reduce demand for non-yielding assets such as silver.

Rates Higher For Longer

At the time of writing, the 10-year US Treasury yield was up 0.42% to about 4.28%, near a more than six-week high. The US Dollar Index (DXY) was slightly lower but remained above 100.00 after Wednesday’s gains. The Fed left rates unchanged for a second straight meeting and said inflation risks remain tilted higher. Fed Chair Jerome Powell said, “Inflation remains somewhat elevated, with recent progress slower than hoped,” and described policy as “at the high end of neutral, or mildly restrictive.” On the 4-hour chart, price action turned bearish after a break below a Descending Triangle near $77.50, and the 14-period RSI moved into the 20.00–40.00 zone. Support sits near $72.00 and $64.17, while resistance is around $78.00, then $80.00, with $87.45 as the next level if $80.00 is cleared. Given the Federal Reserve’s firm stance on holding interest rates, we see significant pressure on silver prices. The latest Consumer Price Index (CPI) data from February 2026 showed inflation stubbornly at 2.9%, reinforcing the market’s belief that rate cuts are not imminent. Based on today’s CME FedWatch tool, probabilities for rates remaining at the 3.50%-3.75% level through the summer have now increased to 65%. For derivative traders, this environment suggests that buying put options on silver could be a primary strategy in the coming weeks. We are looking at strike prices near the key support levels of $72.00 and even the deeper February low of $64.17 as potential targets. The bearish breakdown of the triangle pattern signals strong momentum, making puts an effective way to capitalize on further declines.

Positioning And Risk Management

The persistent strength in the US dollar and Treasury yields adds weight to this bearish outlook. With the 10-year Treasury yield currently hovering at 4.30% and the US Dollar Index holding firm at 100.25, non-yielding assets like silver lose their appeal. This dynamic makes it difficult for silver to attract investor capital. We saw a similar pattern back in mid-2022, when the Fed’s aggressive hiking cycle caused a significant drop in precious metal prices before they eventually stabilized. That historical performance shows how sensitive silver is to restrictive monetary policy and a strong dollar. This precedent gives us more confidence in anticipating further weakness as long as the Fed remains hawkish. However, we must also consider the potential for a sudden price spike due to escalating geopolitical tensions in the Middle East. Recent reports of renewed friction near crucial shipping lanes are keeping a floor under safe-haven assets. Therefore, traders might consider buying cheap, out-of-the-money call options as a hedge against an unexpected geopolitical flare-up. The technical chart provides clear levels for managing risk on any bearish positions. The breakdown zone around $78.00 now acts as a critical resistance level where new short positions could be initiated. A decisive move back above the $80.00 mark would be our signal that the immediate downward pressure is easing, requiring a reassessment of the strategy. Create your live VT Markets account and start trading now.

Start trading now – Click here to create your real VT Markets account

Ahead of central bank briefings, GBP/JPY relinquishes earlier Asian gains, slipping below 212.00 to range lows

GBP/JPY rose to about 212.35 in the Asian session on Thursday but then slipped back towards 211.85–211.80. It is nearly unchanged on the day as traders wait for the Bank of England (BoE) policy decision before taking clear positions. Markets have moved away from expecting two UK rate cuts this year and are now pricing a higher chance of a hike in November due to an energy shock linked to the Middle East conflict. Attention is also on the BoE statement and monthly UK employment data, which may affect the Pound and the pair.

BoJ Policy And Yen Support

In Japan, the Bank of Japan (BoJ) kept interest rates unchanged at its March meeting, citing concerns that a war-driven rise in crude oil prices could slow economic growth. Geopolitical tensions have supported the safe-haven Yen and limited gains in GBP/JPY, with traders watching Governor Kazuo Ueda’s press conference for policy clues. Markets still expect the BoJ to continue policy normalisation, and there is also talk of possible action by Japanese authorities to curb Yen weakness. The mixed drivers and range-bound trading since the start of the week suggest caution on strong near-term direction. Looking back at the situation in March 2025, we saw the GBP/JPY cross hovering near the 212.00 level, with markets torn between Bank of England (BoE) and Bank of Japan (BoJ) policies. Since then, the pound has strengthened significantly, with the cross currently trading near 225.50. This rally was fueled by the BoE hiking its bank rate to 5.5% in November 2025 to combat the energy-driven inflation we were concerned about. The dynamic has now shifted considerably heading into the second quarter of 2026. Last week’s UK inflation data showed the Consumer Price Index falling to 3.1%, its lowest level in two years, prompting markets to price in at least one BoE rate cut by year-end. This is a stark reversal from last year when rate hikes were the primary expectation.

Positioning For A Potential Reversal

Meanwhile, the Bank of Japan followed through on the normalization path we anticipated, finally ending its negative interest rate policy in January 2026. After years of a widening rate gap that punished the yen, the BoJ’s new tightening bias contrasts with the BoE’s emerging easing bias. This policy divergence now puts downward pressure on the GBP/JPY cross. For derivative traders, this suggests the significant upward momentum in GBP/JPY has likely peaked. Buying long-dated put options with strike prices below 220.00 could offer a way to profit from a potential trend reversal over the next few months. This strategy provides a defined risk if the pound’s strength unexpectedly continues. Alternatively, for those expecting a more gradual decline or range-bound price action, selling call options or establishing bear call spreads could be effective. This allows traders to collect premium while betting that the cross will not break its recent highs near 228.00. The key is to position for fading strength rather than the aggressive buying we saw through much of 2025. Create your live VT Markets account and start trading now.

Start trading now – Click here to create your real VT Markets account

Despite hawkish Fed views, the US Dollar Index hovers near 100.10, easing after prior gains

The US Dollar Index (DXY) traded near 100.10 in Asian hours on Thursday, after rising nearly 0.75% in the prior session. It remained subdued near 100.00 as markets weighed a more hawkish Federal Reserve outlook. The Fed kept rates unchanged at 3.50%–3.75% at its March meeting on Wednesday. Chair Jerome Powell said inflation should ease gradually, but disinflation could be slower than previously expected.

Hawkish Fed Outlook

Powell also said oil price rises linked to the Iran conflict are likely to lift inflation in the near term. The Fed cited uncertainty from the Iran war and warned of upside risks to inflation. Policymakers indicated rate cuts may be delayed until there is clearer evidence that inflation is easing. Projections still show one rate cut this year and another in 2027, in line with the December outlook. US producer price data for February showed stronger inflation pressures. Headline PPI rose 0.7% month-on-month, versus 0.5% in January and a 0.3% forecast, the largest rise in seven months. Headline PPI increased to 3.4% year-on-year from 2.9%, while core PPI rose to 3.9% from 3.5%. Markets next focus on weekly jobless claims.

Looking Back To 2025

Looking back at this time in 2025, we saw the Federal Reserve signal a hawkish stance with the US Dollar Index near 100. One year later, the dollar index is now trading significantly higher around 104, as the Fed did not deliver the rate cuts initially projected in 2025. This strength follows a period where the Fed funds rate was pushed to 4.00-4.25% in mid-2025 to combat the persistent inflation we saw. The inflation fears from last year, partly driven by the Iran conflict which has since stabilized, have shifted. While the latest Consumer Price Index for February 2026 showed a cooling to 2.8% year-over-year, this remains stubbornly above the Fed’s 2% target. This situation creates uncertainty over the timing of the first rate cut, which markets are now pricing for the third quarter. Adding to the complexity is the resilient labor market, a factor that gives the Fed patience to keep rates elevated. The most recent Non-Farm Payrolls report showed a solid gain of 250,000 jobs, beating expectations and signaling continued economic strength. The unemployment rate also held steady at 3.8%, reinforcing the idea that the economy can handle higher rates for longer. Given this backdrop, we should consider strategies that benefit from a strong but potentially range-bound dollar in the coming weeks. Selling short-dated puts on the DXY or currency pairs like EUR/USD could be an option, as the strong labor data provides a floor for the dollar. Implied volatility in forex options has been trending lower, suggesting the market expects stability before the next major catalyst. In the interest rate markets, the persistent “higher for longer” narrative suggests we should remain cautious about aggressive bets on imminent rate cuts. We can see this reflected in Fed funds futures, where the probability of a rate cut at the May 2026 meeting has fallen below 20%. This implies that derivative positions expecting a sharp drop in short-term rates in the next six to eight weeks carry significant risk. Create your live VT Markets account and start trading now.

Start trading now – Click here to create your real VT Markets account

Dividend Adjustment Notice – Mar 19 ,2026

Dear Client,

Please note that the dividends of the following products will be adjusted accordingly. Index dividends will be executed separately through a balance statement directly to your trading account, and the comment will be in the following format “Div & Product Name & Net Volume”.

Please refer to the table below for more details:

Dividend Adjustment Notice

The above data is for reference only, please refer to the MT4/MT5 software for specific data.

If you’d like more information, please don’t hesitate to contact [email protected].

GBP/USD edges up towards 1.3290 in early Europe, though Middle East tensions and hawkish Fed cap gains

GBP/USD edged up to about 1.3290 in early European trading on Thursday, with attention on the UK employment report and the Bank of England rate decision. Gains may be capped by Middle East tensions and a firmer US Dollar. The Middle East conflict lifted WTI to near $100 a barrel, supporting safe-haven demand for the US Dollar. Bloomberg said Iran and Israel traded strikes on key energy facilities, after an IRGC warning that some Gulf energy sites would be “legitimate targets” following an attack on South Pars gas field facilities.

Technical Picture For Sterling

GBP/USD fell about 0.7% on Wednesday, dropping below 1.3300 and extending a pullback from a late-January high near 1.3870. The pair is now below its key daily moving averages, and recent price action turned lower. The Fed held rates at 3.50% to 3.75% and kept a projection of one cut in 2026, while the 2026 core inflation forecast rose to 2.7% from 2.5%. US headline PPI rose 0.7% month-on-month versus a 0.3% consensus. GBP/JPY fell 0.20% on Wednesday and traded at 211.82 after reaching 212.73 earlier in the day. It previously tested 215.00, dipped near 207.00, and has been consolidating in a 210.00–214.00 range while holding above the 50- and 20-day SMAs, with RSI above 50. Given the pound’s precarious position around 1.3290, the immediate focus should be on the upcoming Bank of England decision. The combination of Middle East tensions pushing oil towards $100 a barrel and a hawkish US Federal Reserve creates significant headwinds for Sterling. This uncertainty suggests that implied volatility in GBP options is likely to increase in the coming days.

Volatility Strategies Ahead Of Boe

We should consider buying volatility ahead of the BoE announcement, as a surprise move could cause a sharp price swing in either direction. Looking back at historical stress periods, we saw the VIX index spike above 35 during the onset of the Ukraine conflict in 2022, which translated to wider swings in currency markets. A similar environment is building now, making strategies like long straddles or strangles on GBP/USD potentially profitable. The fundamental outlook favors a weaker pound against the dollar, as the Fed’s commitment to a single 2026 rate cut is a powerful signal. With the latest US Core PCE data from February showing inflation holding at 2.8%, the Fed’s hawkish stance is well-supported. We should therefore look at buying GBP/USD put options to position for a break below the recent lows. In the UK, recent data from the Office for National Statistics showed consumer price inflation remained sticky at 3.1% in February, putting the BoE in a difficult position. This economic backdrop, combined with the Fed’s resolve, reinforces the case for a stronger dollar. Selling GBP/USD futures contracts or using bearish option spreads could capitalize on this growing policy divergence. The risk-off sentiment is also boosting the Japanese Yen, which is pressuring the GBP/JPY cross despite its technically bullish setup. We saw WTI crude oil prices surge toward $130 a barrel in March 2022 on geopolitical fears, and a sustained move toward $100 now would likely intensify haven flows into the Yen. Hedging long GBP/JPY positions or initiating speculative shorts through put options appears prudent until the conflict de-escalates. Create your live VT Markets account and start trading now.

Start trading now – Click here to create your real VT Markets account

Ahead of BoE decision, sterling rises towards 1.3290, though Middle East tensions and hawkish Fed limit gains

GBP/USD edged up to about 1.3290 during Thursday’s Asian session and held near that level in early European trade. Attention is on the UK employment report and the Bank of England (BoE) rate decision on Thursday. Oil rose with Middle East tensions, with WTI near $100 a barrel, supporting the US Dollar as a safe-haven. Bloomberg reported that Iran and Israel traded strikes on key energy facilities after an IRGC warning about targeting energy sites following attacks on South Pars gas field facilities.

Fed Policy And Market Reaction

On Wednesday, the US Federal Reserve kept rates unchanged at 3.50%–3.75%. The Summary of Economic Projections still pointed to one possible rate cut in 2026, while the inflation outlook was described as highly uncertain due to rising energy prices. The BoE is expected to leave its key rate unchanged at 3.75% at its March meeting. Bank of America economists now forecast two Bank Rate cuts in June and September, delayed from March and June. UK labour data is also due, with the ILO Unemployment Rate forecast at 5.3% in January versus 5.2% in December. The Pound Sterling dates back to 886 AD and accounts for 12% of FX transactions, about $630 billion a day (2022), with GBP/USD at 11%, GBP/JPY 3%, and EUR/GBP 2%. With the conflict in the Middle East pushing oil prices towards $100 a barrel, we see implied volatility in currency markets ticking up. For instance, the Cboe Volatility Index (VIX) has jumped to over 20, a sharp rise from the calmer levels we saw at the start of the year. This environment suggests that buying options, such as straddles or strangles on GBP/USD, could be a prudent strategy to profit from expected price swings regardless of direction. The US Dollar is benefiting from both this geopolitical tension and the Federal Reserve’s firm stance on interest rates. With recent US inflation data for February 2026 coming in stubbornly high at 3.4%, the Fed’s hawkish tone is justified and strengthens the dollar’s appeal. We should therefore consider positioning for continued dollar strength against a basket of other currencies, not just the pound.

Implications For Trading Strategy

Conversely, the outlook for the Pound Sterling appears weak, creating a clear divergence. The Bank of England is expected to hold rates today, but expectations are building for cuts starting in June, a notable shift from the sentiment we saw in late 2025. The forecast that UK unemployment will hit 5.3%, its highest level in nearly five years, further supports a bearish case for the British currency. This growing gap between a hawkish Fed and a more cautious Bank of England suggests the path of least resistance for GBP/USD is downwards. We believe traders should look at strategies that profit from a fall in the pair, such as buying put options or establishing bear put spreads to limit upfront costs. The current 1.3290 level might represent a good opportunity to initiate such positions. Looking back, we saw how widening interest rate differentials drove currency trends throughout 2025, making carry trades profitable. As the Fed holds firm while the BoE signals future cuts, the interest rate advantage is tilting back in favour of the US Dollar. This fundamental factor supports holding short GBP/USD positions through futures or forward contracts to capture this differential. Create your live VT Markets account and start trading now.

Start trading now – Click here to create your real VT Markets account

Back To Top
server

Hello there 👋

How can I help you?

Chat with our team instantly

Live Chat

Start a live conversation through...

  • Telegram
    hold On hold
  • Coming Soon...

Hello there 👋

How can I help you?

telegram

Scan the QR code with your smartphone to start a chat with us, or click here.

Don’t have the Telegram App or Desktop installed? Use Web Telegram instead.

QR code