Japan’s core machinery orders fell by 5.5% month on month in January. This was less of a drop than the expected fall of 9.6%.
The data points to a smaller-than-forecast decline in orders at the start of the year. Core machinery orders are a key measure of business capital spending in Japan.
Machinery Orders Beat Expectations
The January machinery orders data, while showing a decline, came in significantly better than we had anticipated. This suggests that corporate capital spending plans are more resilient than previously thought, which is a positive underlying signal for the economy. We should view this not as a negative print, but as a substantial beat on expectations that points to hidden strength.
This positive surprise should give us confidence in taking bullish positions on the Nikkei 225 index. We are seeing recent data showing core inflation has remained above the Bank of Japan’s 2% target for six consecutive quarters, increasing pressure on the central bank to normalize policy. Therefore, derivative traders should consider buying Nikkei call options or selling put spreads to capitalize on expected market upside in the coming weeks.
The strengthening case for economic resilience supports the view that the Bank of Japan may act on its recent hawkish rhetoric sooner rather than later. This potential for a policy shift makes a stronger Japanese Yen more likely. We should position for this by considering put options on the USD/JPY pair, anticipating a move lower from its current range around 155.
When we look back at the market behavior in late 2024, we recall similar instances where better-than-expected domestic data was the catalyst for a multi-week rally in Japanese equities. That period saw the Nikkei 225 gain over 7% in the month following a strong industrial production report. History suggests we should not underestimate the market’s reaction to this kind of positive domestic surprise.
Volatility Strategy Considerations
Given this data, we see near-term implied volatility on Japanese assets as potentially overpriced. Selling short-dated options to collect premium could be a viable strategy, as the positive news may calm markets for a short period. However, we should remain cautious about longer-term volatility, as the prospect of an actual policy change from the Bank of Japan will introduce significant uncertainty later in the quarter.
Create your live VT Markets account and start trading now.
Start trading now – Click here to create your real VT Markets account
Japan’s machinery orders rose 13.7% year on year in January. The result was above the expected 10.5%.
The release indicates a 3.2 percentage point gap versus the forecast. The data point refers to year-on-year growth for January.
Machinery Orders Beat And Capex Signal
The January machinery orders data, coming in at 13.7%, is a significant beat over the expected 10.5%. We should see this as a strong leading indicator for capital expenditure, suggesting corporations are gaining confidence and planning to invest heavily in the coming six to nine months. This is a clear bullish signal for the underlying Japanese economy.
This renewed corporate confidence supports a positive outlook on Japanese equities. The Nikkei 225, which has been performing well, could see further gains as increased investment translates into future productivity and earnings growth. We should consider buying call options on the Nikkei or on ETFs tracking industrial sectors for the second quarter of 2026.
This strong domestic data could also impact the yen, which has been weak against the dollar, recently trading near the 155 level. This report, combined with core inflation that has stayed above the Bank of Japan’s 2% target, could increase pressure on the central bank to consider a more hawkish policy stance sooner than expected. Traders should look at options strategies that would profit from a potential strengthening of the yen.
Looking back to 2025, we saw a similar but more modest rise in spending indicators in the third quarter that ultimately faded. However, this current data is more robust and comes after the Bank of Japan finally ended its negative interest rate policy late last year, suggesting this trend may have more support. The scale of this surprise points to a more durable recovery this time around.
Rates And JGB Strategy Implications
Given the potential for a stronger economy and a less accommodative central bank, we can anticipate a rise in Japanese Government Bond yields. This makes shorting JGB futures an attractive hedge or speculative position in the weeks ahead. The data surprise will likely inject some short-term volatility, creating opportunities for those positioned to trade on price swings.
Create your live VT Markets account and start trading now.
Start trading now – Click here to create your real VT Markets account
Japan’s net foreign investment in Japanese stocks fell to ¥-1B in the week ending 13 March. This was down from ¥385.5B in the previous period.
The figure indicates a shift from net buying to net selling by foreign participants. The change was ¥386.5B between the two readings.
Foreign Flow Reversal Risk
This sudden reversal from a ¥385.5 billion inflow to a ¥1 billion outflow by foreign investors is a significant warning sign for us. The massive foreign buying that pushed the Nikkei 225 to record highs throughout 2025 may be exhausted. We should therefore reduce long-exposure and consider protective strategies.
The sharp change in sentiment will likely cause a spike in market volatility. The Nikkei Volatility Index, which was trading near a calm 17 just two weeks ago, has already ticked up to 21, suggesting traders are pricing in bigger market swings. We should look to buy options, such as straddles or strangles, to profit from this expected rise in volatility regardless of market direction.
Given this data, a bearish tilt in our derivatives positions is now warranted. We should consider buying Nikkei 225 put options with expirations in April and May to hedge against a potential market correction. After the market gained over 25% in 2025, a pullback driven by foreign selling is a high-probability scenario.
We must also monitor the USD/JPY currency pair, which has been hovering around the 158 level. A flight of foreign capital from Japanese equities could lead to yen strength as investors sell their stocks and convert the proceeds, creating an additional headwind for Japanese exporters. We can use options on the yen to hedge this currency risk or speculate on its appreciation.
Key Follow Through Signals
This outflow reminds us of the brief profit-taking we observed in mid-2025 when concerns about Bank of Japan policy tightening first emerged. However, the market is now at a much higher valuation, making it more vulnerable to a sustained downturn if these outflows continue. We need to watch the foreign investment data for the week of March 20 very closely to see if this is a one-time event or the start of a new trend.
Create your live VT Markets account and start trading now.
Start trading now – Click here to create your real VT Markets account
MUFG said a prolonged Iran conflict and an extended closure of the Strait of Hormuz could lift USD/VND above 27,000 in 2026. Its base case forecasts are 26,300 by March 2026 and 26,600 by December 2026.
The scenario for USD/VND above 27,000 assumes Brent crude is around US$100/bbl. The base case assumes de-escalation after March 2026 and oil prices easing back towards pre-conflict levels over time.
Upside Scenario For Usd Vnd
In a downside scenario, MUFG set out USD/VND at 27,700 or higher if oil holds at US$120/bbl and energy shortages occur. The report linked the currency move to energy shocks and stagflation risks.
MUFG described Vietnam as less exposed than India and the Philippines within Asia ex-Japan. It also said energy shortages could still affect Vietnam through weaker manufacturing activity and slower global growth.
With Brent crude futures holding firm above $105 per barrel, the base case scenario for USD/VND is already under pressure. The spot rate has breached the 26,500 level this week, far exceeding the expected 26,300 for the end of this month. We believe this reflects a market pricing in prolonged conflict in the Middle East, making a simple de-escalation seem unlikely.
In the coming weeks, we should consider strategies that benefit from a rising USD/VND exchange rate and increased volatility. This includes looking at USD call options or VND put options with strike prices around 27,000 for the second quarter. Non-deliverable forwards (NDFs) also offer a way to lock in a favorable rate now, anticipating further dong weakness.
Strategy And Tail Risk Monitoring
This situation feels similar to the pressures we saw back in 2022 when the conflict in Ukraine began and energy prices soared. Vietnam’s February import data already showed a 15% year-on-year jump in its energy bill, and headline inflation has ticked up to 4.8%. While Vietnam is more resilient than its peers, this stagflationary pressure will weigh on the currency.
The key tail risk to monitor is a full closure of the Strait of Hormuz, which could push oil towards the $120 per barrel mark. In that scenario, a move toward 27,700 for USD/VND becomes highly probable. We should model these outcomes as the risk of a sustained energy shock appears to be growing.
Create your live VT Markets account and start trading now.
Start trading now – Click here to create your real VT Markets account
Iran and Israel carried out strikes on energy facilities in the Middle East, according to Bloomberg. Earlier, Iran’s Islamic Revolutionary Guard Corps (IRGC) warned that energy sites in Gulf countries would be “legitimate targets” after Israel attacked facilities at Iran’s South Pars gas field.
The IRGC said Iran had entered a new phase focused on energy infrastructure. It also said retaliatory strikes hit facilities linked to US interests.
Regional Energy Strikes Escalate
In the United Arab Emirates, authorities said they intercepted missiles aimed at key energy infrastructure. The UAE Foreign Ministry said Iran attacked its gas facilities and an oil field, calling it an escalation and a breach of international law.
Qatar’s state oil and gas company said Ras Laffan Industrial City suffered “extensive damage” after Iranian missiles hit it, Reuters reported. Saudi Arabia said it intercepted and destroyed multiple ballistic missiles launched toward Riyadh and stopped an attempted drone attack on a gas facility in the east.
US President Donald Trump said he wants no more strikes on Iranian energy sites after Israel’s Wednesday attack on South Pars. He said further action could depend on Tehran’s future moves in strategic waterways.
West Texas Intermediate (WTI) was down 0.73% at $97.85.
We remember when strikes were traded on energy facilities across the Middle East back in late 2025, directly hitting sites in Iran, the UAE, Qatar, and Saudi Arabia. That event, which saw key gas fields and industrial hubs targeted, created a new playbook for regional risk. Although direct conflict has since cooled, the market’s memory of that escalation now influences every trade.
Trading Implications And Risk Positioning
The biggest lesson from the 2025 flare-up is how quickly volatility can return to the energy markets. We saw how attacks on facilities like Abqaiq in 2019 caused Brent crude to jump nearly 20% in a single day, and the strikes last year reaffirmed this fragility. Therefore, buying long-dated call options on crude oil or volatility indexes serves as a crucial hedge against a sudden return to open conflict.
A distinct geopolitical risk premium has been baked into oil prices since those attacks, keeping crude elevated above where fundamentals might otherwise place it. While West Texas Intermediate briefly touched $97 during that period, it has since stabilized near $105 per barrel as of March 2026, reflecting persistent tension. This suggests that any significant dips in price are likely to be viewed as buying opportunities by traders who recall how quickly the situation can escalate.
Traders should now be paying closer attention to spreads between different energy products. The attacks in 2025 targeted both oil and major natural gas infrastructure, such as Iran’s South Pars and Qatar’s Ras Laffan facilities. This creates opportunities in the price relationship between WTI crude, Brent crude, and natural gas futures, as any new threat might impact one commodity more than another.
Given the current fragile calm, selling out-of-the-money puts can be a viable strategy to collect premium, capitalizing on the market’s underlying anxiety. However, this should be paired with long positions in call option spreads to cap risk while maintaining exposure to a sudden price spike. This structure allows us to profit from both time decay and a potential shock to the system.
The focus has shifted from traditional supply and demand reports to monitoring military postures and statements from regional powers. We must watch naval movements in the Strait of Hormuz, through which roughly 21% of global petroleum liquids consumption passes. Any disruption there, even verbal threats, will now have a more immediate and pronounced impact on derivative pricing than it did before the direct strikes of 2025.
Create your live VT Markets account and start trading now.
Start trading now – Click here to create your real VT Markets account
Bank Indonesia kept its policy rate at 4.75% in March and moved to a more hawkish stance. UOB now forecasts the BI rate to stay at 4.75% through the end of 2026 and no longer projects any rate cuts in 2026.
The outlook shift follows Bank Indonesia’s March meeting, which referred to the Middle East conflict as reducing expectations for global rate cuts. Bank Indonesia also removed earlier references to possible rate cuts, pointing to a longer period of steady rates.
Policy Outlook And Market Implications
Bank Indonesia is expected to keep policy tight while staying data-dependent, with the Middle East conflict linked to rupiah weakness and higher inflation pressure. Bank Indonesia set out three scenarios for oil prices and conflict outcomes: base, moderate, and severe.
Further inflation risks include potential crop failures tied to warmer weather. The article notes it was produced using an artificial intelligence tool and reviewed by an editor.
Given Bank Indonesia’s unexpected shift to a hawkish hold, we must quickly unwind any positions that were betting on rate cuts this year. The market was pricing in at least one cut, so this pivot to a potential hike creates a new trading landscape. This means re-evaluating any short Rupiah positions, as the central bank is now clearly focused on currency stability.
The primary goal of this policy is to defend the Rupiah, which has been under pressure, recently touching 16,100 against the US dollar. With February’s inflation ticking up to 3.1% and Brent crude holding firm around $92 a barrel due to the Middle East conflict, the central bank’s stance is logical. We should therefore consider positioning for a stable or stronger Rupiah in the near term, possibly by selling out-of-the-money USD/IDR call options.
This situation feels similar to what we observed back in 2022, when many traders underestimated the US Federal Reserve’s resolve to keep rates high to combat inflation. Those expecting a quick policy pivot were caught on the wrong side of the market. BI’s new language suggests a similar determination, meaning bets against the Rupiah are now fighting the central bank directly.
Trading And Hedging Considerations
The uncertainty surrounding oil prices and conflict outcomes means implied volatility on USD/IDR options is likely to rise. This presents an opportunity to buy volatility through structures like straddles if we anticipate a sharp move but are unsure of the direction. The central bank’s three scenarios for the conflict—base, moderate, and severe—tells us that they are prepared for significant market swings.
For traders with exposure to Indonesian bonds, this hawkish stance is a headwind, as it removes the prospect of capital gains from falling rates. In the interest rate swap market, this signals a good opportunity to pay fixed rates, anticipating that the floating rate benchmark will not fall as previously expected. Hedging against a surprise rate hike is now a more critical part of our strategy.
Create your live VT Markets account and start trading now.
Start trading now – Click here to create your real VT Markets account
New Zealand’s GDP rose 0.2% quarter-on-quarter in Q4, after a 0.9% increase in Q3 that was revised from 1.1%. The Q4 result was below the 0.4% forecast.
GDP increased 1.3% year-on-year in Q4, compared with 1.1% in Q3, which was revised from 1.3%. This missed the 1.7% estimate.
Market Reaction And Key Drivers
After the release, NZD/USD traded at 0.5789, down 1.20% on the day.
The New Zealand Dollar is affected by economic conditions in New Zealand and policy settings from the Reserve Bank of New Zealand (RBNZ). China’s economic performance can also affect the currency because China is New Zealand’s biggest trading partner.
Dairy prices can influence the currency because dairy is New Zealand’s main export. The RBNZ targets inflation of 1% to 3% over the medium term, with a focus near 2%.
RBNZ interest rate changes can affect bond yields and the currency, and rate differences versus the US Federal Reserve can influence NZD/USD. Broader risk sentiment can also move NZD, with the currency often weaker during market turbulence or economic uncertainty.
Trading Outlook And Strategy
The latest gross domestic product figures for the end of 2025 confirm the New Zealand economy is stalling, growing much slower than we anticipated. This significant miss on expectations is a clear bearish signal for the New Zealand Dollar. As a result, we should prepare for further downside pressure on the currency in the coming weeks.
This weak growth puts the Reserve Bank of New Zealand in a difficult position, as inflation at the end of last year was still elevated at 4.5%, well outside their target range. The central bank cannot easily cut interest rates to stimulate the economy without risking another surge in inflation. This policy conflict will likely lead to market uncertainty and weigh on the Kiwi dollar.
For derivative traders, this environment suggests an increase in volatility. The data significantly raises the probability of an interest rate cut later this year, with futures markets now pricing in a more dovish stance from the RBNZ by the third quarter. We should consider strategies that benefit from price swings, such as buying NZD/USD put options to protect against or profit from a further decline.
The downward pressure on the NZD/USD pair is amplified by a relatively strong US dollar, as the Federal Reserve appears to be in no rush to cut its own rates. This widening rate differential makes holding US dollars more attractive than holding New Zealand dollars. A break below the 0.5800 support level, which we are seeing today, opens the door for a deeper fall.
External factors are also working against the Kiwi. Recent economic data from China, New Zealand’s biggest trade partner, shows their manufacturing PMI has been in contraction for five consecutive months. This points to weaker demand for New Zealand’s exports, further clouding the economic outlook.
The only modest bright spot has been a recent firming in dairy prices, with the Global Dairy Trade index up around 3% since the start of the year. However, this is not nearly enough to offset the negative sentiment from the poor GDP figures and weakness in China. We view this as a minor supporting factor that will not reverse the dominant downward trend.
This situation reminds us of the technical recession we saw in 2023, which led to a sustained fall in the NZD/USD exchange rate. Therefore, our strategy should focus on selling into any temporary strength in the currency pair. The path of least resistance appears to be lower for the foreseeable future.
Create your live VT Markets account and start trading now.
Start trading now – Click here to create your real VT Markets account
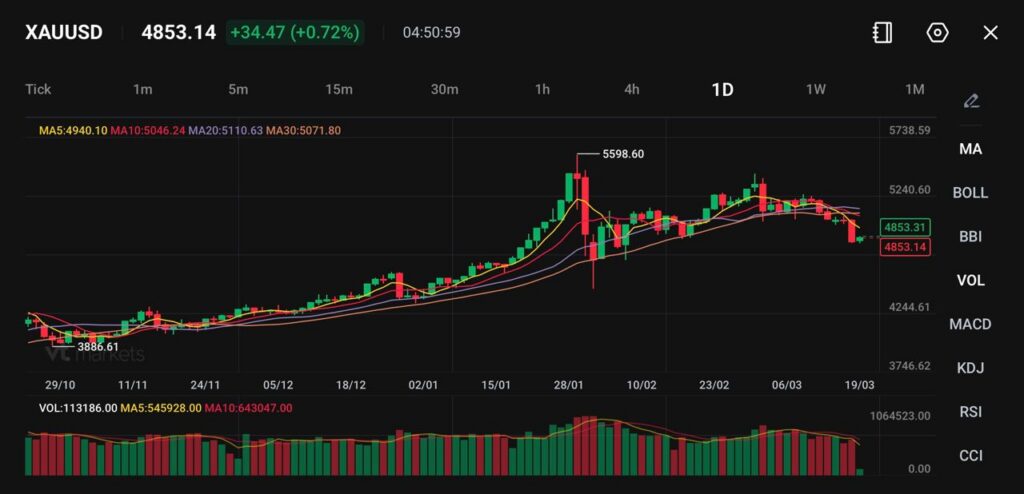
XAUUSD trades near 4853, up +34.47 (+0.72%), but remains under pressure after a six-day losing streak.
The Federal Reserve signalled only one rate cut this year, reinforcing a higher-for-longer rate outlook.
Rising oil prices and Middle East tensions support gold, but also fuel inflation risks, limiting upside.
Gold prices steadied on Thursday, hovering around the $4,830 level, after logging a six-day losing streak, the longest since late 2024.
XAUUSD is currently trading near 4853, up modestly on the day, but still reflecting a broader loss of upward momentum following its recent peak.
The pause in selling suggests markets are reassessing positioning, though the overall tone remains cautious as macroeconomic forces shift.
Gold may stabilise in the near term, but sustained upside could remain limited unless expectations for monetary policy soften.
Fed Hawkish Hold Weighs on Bullion
The primary driver behind gold’s recent weakness is the Federal Reserve’s policy stance. The Fed kept interest rates unchanged but signalled that only one rate cut is likely this year.
Fed Chair Jerome Powell emphasised that any easing will depend on clearer evidence that inflation is moving sustainably toward the target.
Federal Reserve Chair Jerome Powell made it clear the US central bank won’t cut interest rates again until inflation resumes cooling. And that’s before iteven starts considering the possible impact of the war in the Middle East https://t.co/M4sSt0aNh7
This “higher-for-longer” message has reduced expectations for aggressive monetary easing, which is typically supportive for gold.
As interest rates remain elevated, the opportunity cost of holding gold increases, making it less attractive relative to yield-bearing assets.
If markets continue pricing limited rate cuts, gold may struggle to regain strong bullish momentum.
Oil and Geopolitics Create Mixed Signals
At the same time, geopolitical tensions continue to provide underlying support for gold.
Recent developments include Iran launching missile strikes on a Qatari site housing the world’s largest LNG facility, escalating tensions following earlier attacks on key energy infrastructure.
Iran missile attack on Qatar causes 'extensive damage' to facility housing huge gas plant https://t.co/98UT2eElmJ
These risks typically boost safe-haven demand. However, they have also driven higher oil prices, which complicates the outlook for gold.
Rising energy costs can fuel inflation, reinforcing expectations that central banks will maintain tighter policy for longer.
This creates a push-and-pull dynamic where geopolitical risk supports gold, but inflation concerns cap its upside.
Continued escalation may support gold in the short term, but sustained gains will depend on how inflation expectations evolve.
Technical Analysis
Gold (XAUUSD) is trading near 4,853, up around 0.72% on the session, as price attempts a modest rebound following a broader pullback from the 5,598 peak.
Despite the bounce, the metal remains under short-term pressure, with recent price action suggesting a loss of bullish momentum after an extended rally.
From a technical perspective, gold is now trading below its key short-term moving averages, with the 5-day (4,940) and 10-day (5,046) both positioned above current price and sloping downward.
The 20-day (5,110) and 30-day (5,071) also sit overhead, reinforcing a near-term bearish bias as the market struggles to reclaim these levels. This alignment indicates that rallies may face resistance unless momentum meaningfully shifts.
Immediate support is forming around the 4,800–4,850 region, where price is currently attempting to stabilise. A break below this zone could open further downside toward 4,700, followed by stronger structural support near 4,500.
On the upside, resistance is seen at 4,940–5,050, where the short-term moving averages cluster, with a more significant barrier at 5,200+, marking the recent consolidation highs.
Overall, gold appears to be in a corrective phase following its sharp rally, with the broader trend still constructive but short-term momentum weakening.
Unless price can reclaim the 5,000–5,100 region, the market may continue to consolidate or drift lower before establishing its next directional move, particularly as it reacts to shifts in dollar strength and rate expectations.
Market Positioning and Liquidity Pressures
Another factor weighing on gold has been investor positioning. Some market participants have reportedly reduced gold holdings to meet margin calls or rebalance portfolios amid volatility in other asset classes.
Gold was little changed, as investors weighed the Fed’s rate-cut path against inflationary risks from the war in the Middle East https://t.co/vkeG6r4sld
This type of selling can accelerate declines even when underlying fundamentals remain supportive.
Despite the recent pullback, gold is still up around 12% year-to-date, reflecting its strong performance earlier in the year.
What Traders Should Watch Next
Gold now sits at the intersection of monetary policy, inflation, and geopolitical risk.
Key drivers to monitor include:
Federal Reserve guidance and changes in rate-cut expectations
Oil price movements and their impact on inflation
Escalation or de-escalation in the Middle East
Whether gold can reclaim the 4940–5000 zone
For now, gold appears to be consolidating after a strong rally, with hawkish central bank expectations acting as the main constraint on further upside.
Why Is Gold Struggling Despite Rising Geopolitical Tensions? The Federal Reserve’s hawkish stance is weighing down gold. Even though geopolitical risks typically support gold, expectations of fewer rate cuts are limiting upside.
What Did The Federal Reserve Signal About Interest Rates? The Fed indicated that only one rate cut is likely this year, reinforcing a higher-for-longer rate environment.
How Does A Hawkish Fed Impact Gold Prices? A hawkish Fed keeps interest rates elevated, increasing the opportunity cost of holding gold and reducing its appeal compared to yield-bearing assets.
Why Are Oil Prices Relevant To Gold Right Now? Rising oil prices can drive inflation higher, which may force central banks to delay rate cuts. This indirectly pressures gold prices.
What Is Gold’s Current Price Level? Gold is trading around $4,830 per ounce, with XAUUSD near 4853, following a recent six-day losing streak.
Is Gold Still In An Uptrend Overall? Yes, gold remains up around 12% year-to-date, though short-term momentum has weakened.
Start trading now – Click here to create your real VT Markets account
AUD/USD fell about 1.15% on Wednesday, rejecting the 0.7100 area and settling near 0.7025 after briefly trading above 0.7120. The drop reinforced repeated failures to retake the year-to-date high near 0.7190 and erased the prior two sessions’ gains.
The Federal Reserve held rates, while Jerome Powell said inflation progress has been slower than expected. The 2026 core inflation forecast rose to 2.7% from 2.5%, and US PPI increased 0.7% month-on-month versus 0.3%, with the annual rate at 3.4% versus 2.9%.
Fed And Rba Policy Divergence
The RBA lifted rates by 25 basis points to 4.10% in a 5–4 vote, citing capacity pressures and energy-price effects linked to the Middle East conflict. Australia’s February jobs data is expected at +20.3K with unemployment at 4.1%, alongside the RBA Financial Stability Review.
AUD/USD was near 0.7022, with support at 0.7010, then 0.6960 and 0.6900. Resistance sits at 0.7075 and 0.7120, with 0.7150 and 0.7200 above.
AUD drivers include RBA rates, China’s demand, inflation, growth, trade balance, risk sentiment, and iron ore, valued at about $118 billion a year in 2021. RBA targets inflation of 2–3% and can use quantitative easing or tightening.
Looking back at the analysis from 2025, we can see the market was grappling with a hawkish Federal Reserve and a Reserve Bank of Australia that was still raising rates. The rejection of AUD/USD from the 0.7100 level at that time was a significant warning. Today, with the pair trading near 0.6550, those concerns from last year have clearly materialized and intensified.
Outlook And Trading Implications
The Fed’s forecast in 2025 for higher core inflation in 2026 proved accurate, with the latest data from February 2026 showing US core CPI remaining stubborn at 3.8% year-over-year. This has kept the US dollar strong, as rate cuts are pushed further out. Traders should view any strength in AUD/USD as an opportunity to initiate bearish positions, such as buying put options or establishing bear call spreads.
In Australia, the situation has shifted since the RBA’s rate hike in early 2025. The February 2026 jobs report showed unemployment ticking up to 4.2%, and recent GDP figures indicate a significant economic slowdown. This policy divergence, with a still-hawkish Fed and a now-dovish-leaning RBA, puts sustained downward pressure on the Australian dollar.
Furthermore, two key pillars of the Aussie dollar’s strength have weakened considerably since last year. Iron ore prices, a major Australian export, have fallen below $100 per tonne for the first time in months amid concerns over demand. China’s economic recovery remains sluggish, with its latest manufacturing PMI data still showing contraction at 49.1.
Given this backdrop, we should anticipate that rallies will be limited and sold into. The 0.6900 level, which was viewed as potential support back in 2025, should now be considered a significant long-term resistance area. Strategies that profit from range-bound action or further downside, such as selling out-of-the-money call options, appear prudent in the coming weeks.
Create your live VT Markets account and start trading now.
Start trading now – Click here to create your real VT Markets account
NZD/USD fell about 1.25% on Wednesday, briefly meeting the 200-day EMA before dropping to about 0.5790. It extended the fall from the early-February high near 0.6090 and moved below the 50-day and 200-day daily moving averages for the first time since mid-January.
New Zealand Q4 GDP rose 0.2% quarter-on-quarter versus 0.4% expected and the RBNZ forecast of 0.5%. Annual growth was 1.3% versus 1.7% expected, and Q3 was revised to 0.9% from 1.1%.
New Zealand Growth And Rbnz Outlook
Construction weighed on output, while agriculture and tourism-related services rose. The RBNZ next meets on 8 April, with the OCR at 2.25%.
In the US, the Federal Reserve held rates and kept its projection of one cut in 2026. The 2026 core inflation forecast rose to 2.7% from 2.5%, and headline PPI was 0.7% month-on-month versus 0.3% expected.
NZD/USD was around 0.5788, with resistance near 0.5860 and 0.5920. Support sits at 0.5765–0.5770 near the 200-day EMA, then around 0.5700.
NZD can be influenced by China’s economy, dairy prices, interest-rate settings, and New Zealand data such as growth, unemployment, and confidence. It often strengthens in risk-on markets and weakens during market stress.
Looking Back One Year
We recall this time last year in 2025, when the NZD/USD pair suffered a sharp decline following a significant miss in fourth-quarter GDP data. That weak economic print gave the Reserve Bank of New Zealand (RBNZ) reason to be patient, while the US Fed remained hawkish. The situation pushed the pair down toward its 200-day moving average.
The picture today is notably different as we look at the most recent data. New Zealand’s fourth-quarter 2025 GDP figures, released yesterday, showed the economy contracted by only 0.1%, beating expectations of a 0.3% decline and showing resilience. This contrasts sharply with the disappointing growth we saw in the data from a year ago.
This economic strength is giving the RBNZ little room to consider rate cuts, with policymakers holding the Official Cash Rate at 5.5% in February 2026 due to persistent domestic inflation. Meanwhile, the U.S. Federal Reserve delivered its first 25 basis point rate cut in January 2026 as inflation cooled. This growing rate differential is now providing a tailwind for the Kiwi dollar.
Supporting this view, we see fundamental factors for the Kiwi have improved. Dairy prices, a key export for New Zealand, have shown strength, with the Global Dairy Trade index rising 2.8% in the first auction of March 2026. Furthermore, recent data from China, New Zealand’s largest trading partner, suggests its economy is stabilizing.
Given this backdrop, the bearish technical setup we observed in March 2025 is no longer in play. The pair is trading comfortably above 0.6100, and unlike last year, the moving averages are now pointing upward. For traders, this suggests a strategy of buying on dips rather than selling into rallies.
Therefore, weakness in the NZD/USD towards the 50-day moving average, currently near 0.6110, should be seen as a potential buying opportunity. We believe using call options is a prudent approach to gain upside exposure while defining risk in case of a market reversal. Looking at strikes around the 0.6250 level for April expiration could offer a favorable risk-to-reward profile.
Create your live VT Markets account and start trading now.
Start trading now – Click here to create your real VT Markets account