GBP/USD reduced part of its earlier decline after opening with a gap down, but it still traded lower near 1.3500 in Asian hours on Monday. The move followed stronger demand for the US Dollar as a safe haven amid renewed US–Iran tensions.
The Guardian reported that Iran’s Foreign Ministry spokesman Esmail Baghaei said the US blockade of Iran’s ports and coastline is an act of aggression that violates the ceasefire. Baghaei wrote on social media that it is “collective punishment” and “a war crime and crimes against humanity”.
Geopolitical Tensions And Dollar Demand
Iranian authorities indicated on Friday that the Strait would reopen, then reversed the move on Saturday after US President Donald Trump refused to lift the blockade on Iranian ports. Iran’s military said the US breached the ceasefire by firing on a commercial vessel and said it would retaliate.
Markets also supported the Dollar as traders priced in a Federal Reserve higher-for-longer stance linked to persistent inflation and Middle East tensions. US Retail Sales data due Tuesday is forecast to rise 1.3% month-on-month in March, after 0.6% in February.
Sterling may find support if Strait of Hormuz tensions push oil prices higher and add to inflation concerns. BoE Deputy Governor Sarah Breeden said the conflict has increased the risk of overlapping market stresses and that vulnerabilities seen before past crises remain.
We remember the market volatility in early 2025 when US-Iran tensions flared up over the Strait of Hormuz blockade. The GBP/USD was trading around 1.3500 then, but the persistent strength of the dollar has since pushed the pair lower. With the pair currently hovering near 1.2450, we see similar underlying risks remaining.
The dollar’s safe-haven appeal from last year’s conflict has been reinforced by the Federal Reserve’s ongoing battle with inflation. Our latest data from Q1 2026 shows US inflation remains sticky at 3.5%, keeping the Fed’s “higher-for-longer” stance firmly in place. This makes buying put options on the GBP/USD an attractive hedge against continued dollar dominance.
BoE And Options Strategies
On the Sterling side, the Bank of England faces a similar challenge to the one it had in 2025. While recent UK inflation has cooled to 3.2%, the threat of rising energy prices means rate hike expectations have not disappeared completely. This suggests traders should monitor short-term interest rate futures to position for any hawkish surprises from the BoE.
The events of 2025 were a stark reminder of how geopolitics can ignite energy markets, a lesson that holds true today. With Brent crude currently trading around $87 a barrel and tensions in the Middle East still elevated, buying call options on oil is a direct strategy to trade this risk. This approach offers protection against sudden price spikes that could stem from any new supply disruptions.
We saw last year how quickly the narrative could shift, causing sharp swings in currency pairs. The current environment of central bank uncertainty suggests implied volatility in GBP/USD options may be undervalued. We believe using option strategies like straddles, which profit from a large price move in either direction, could be a prudent approach in the coming weeks.
Gold prices in the United Arab Emirates fell on Monday, based on FXStreet data. Gold was priced at AED 565.51 per gram, down from AED 570.31 on Friday.
Gold dropped to AED 6,595.88 per tola from AED 6,652.04 on Friday. Other listed prices were AED 5,655.11 for 10 grams and AED 17,588.24 per troy ounce.
Uae Gold Pricing Method
FXStreet calculates UAE gold prices by converting international prices using the USD/AED rate and local units. Prices are updated daily using market rates at the time of publication, and are provided for reference as local rates may vary.
Central banks are the largest holders of gold and may buy it to diversify reserves. According to the World Gold Council, central banks added 1,136 tonnes of gold worth about $70 billion in 2022, the highest annual total on record.
Gold often moves inversely to the US Dollar and US Treasuries, and can also move opposite to risk assets such as equities. Price drivers include geopolitics, recession concerns, interest rates, and US Dollar strength, since gold is priced in dollars.
We are seeing a minor dip in gold prices, which can be viewed as a temporary pullback rather than a change in the underlying trend. This small decrease comes after a significant rally we experienced over the past year. Derivative traders should see this not as weakness, but as a potential opportunity to assess new positions.
Outlook For Gold Trades
The fundamental picture for gold remains strong due to the shifting stance on interest rates. After the aggressive rate hikes we saw through 2025, major central banks are now signaling a move towards easing monetary policy. As a non-yielding asset, gold becomes more attractive when interest rates fall, a dynamic we anticipate will play out in the coming months.
Central bank buying continues to provide a solid floor for prices, a trend that has accelerated since the record purchases of 2022. Recent data confirms that central banks, particularly in emerging markets, were still massive net buyers in early 2026, absorbing over 800 tonnes in the last twelve months. This consistent demand limits downside risk and suggests institutional players are still bullish.
Geopolitical instability is also providing support, with renewed trade tensions adding to global uncertainty. This environment tends to weigh on the US Dollar, which has an inverse relationship with the price of gold. A weaker dollar makes gold cheaper for foreign buyers, which can further boost demand for the precious metal.
Given this backdrop, the recent price dip looks like a favorable entry point for bullish strategies. We believe traders should consider buying call options or establishing bull call spreads to capitalize on expected upside movement over the next few weeks. This approach allows for participation in a potential rally while managing risk in what remains a volatile market.
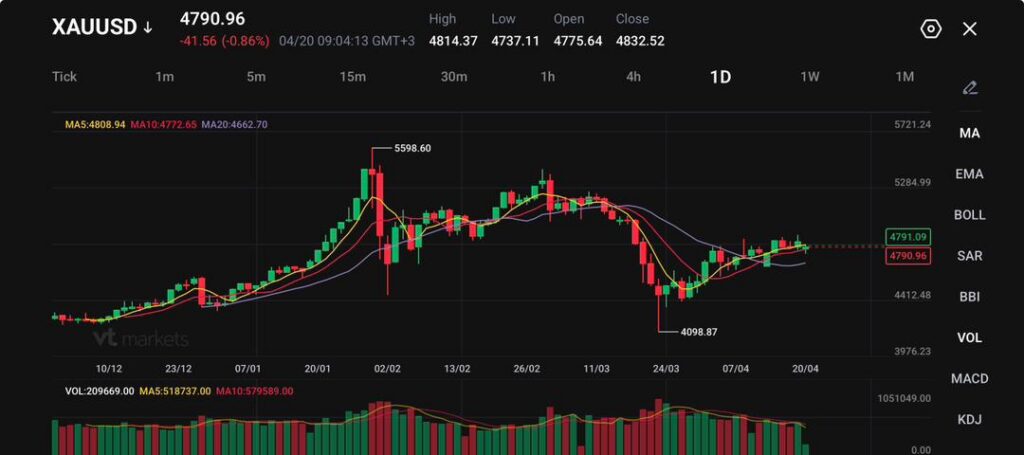
XAUUSD trades at 4,790.96, down 41.56 (-0.86%), after hitting 4,814.37 and dipping to 4,737.11.
Spot gold fell to $4,794.21, while June futures dropped to $4,813.70 as the dollar and Treasury yields moved higher.
The renewed closure of the Strait of Hormuz and the seizure of an Iranian cargo ship pushed oil higher again, reviving inflation fears and weakening demand for non-yielding gold.
Gold prices have declined as the market returns to the macro pattern that defined the initial phases of the US-Iran conflict. Oil prices are on the rise, the dollar is gaining strength, and bond yields are increasing. This combination clearly creates a challenging short-term environment for bullion, even with heightened global tensions. Spot gold now stands at $4,794.21, while June futures have adjusted to $4,813.70.
The current situation presents an opportunity to focus on the inflationary pressures affecting the market rather than solely on the demand for safe-haven assets.
Gold fell after vessels came under fire in the Strait of Hormuz at the weekend, renewing fears of energy-supply disruptions https://t.co/O01gi9XzJb
Traders are closely monitoring the potential impact of a renewed energy crisis, which could lead to higher interest rates lasting longer than anticipated.
This scenario may ultimately challenge gold prices, highlighting the importance of understanding these dynamics in the context of market trends and conflict developments.
Oil and the Dollar Are Doing the Damage
The main pressure point is the return of energy stress. Hormuz has closed again, marine traffic remains constrained, and the market is treating the latest seizure of an Iranian cargo ship as a sign that the ceasefire may fail before it properly stabilises. That has pushed crude higher and brought inflation worries back into the foreground.
Concerns grew that the ceasefire between the United States and Iran might not hold after the U.S. said it had seized an Iranian cargo ship that tried to run its blockade and Iran vowed to retaliate. Follow our live coverage: https://t.co/3Nih73cidn
At the same time, the dollar has firmed as traders moved back toward defensive dollar exposure. A stronger dollar makes bullion more expensive for non-dollar buyers, while higher Treasury yields increase the opportunity cost of holding a non-yielding asset. Gold can handle one of those headwinds for a while. It struggles more when both arrive together.
Inflation Expectations Take Priority
The market is now viewing gold less as a hedge against crises and more as an asset sensitive to interest rates. This shift is significant. Rising energy prices are once again influencing inflation expectations, leading traders to lower their hopes for more lenient monetary policy.
Prices are rising for many Americans, with 65% of consumers saying the increases are outpacing their income, according to a J.D. Power survey of 4,000 U.S. adults conducted in February 2026.
Recent inflation data adds to that pressure, with the annual rate rising from 2.4% in… pic.twitter.com/sKzALWDkZ9
Earlier reports about the conflict had already caused a substantial increase in US inflation and gasoline price expectations, and the recent surge in oil prices now poses a risk of reinforcing that trend.
That leaves gold in an awkward position. It still benefits from long-run inflation hedging demand, but in the short run it loses support when inflation pushes yields and the dollar higher faster than traders add to bullion exposure.
Physical Demand Falls Short
There is also not much help coming from jewellery demand. High prices curbed festival buying in India, while investment demand improved only modestly. That tells you the market is not yet seeing a broad physical bid strong enough to absorb macro pressure.
Silver, platinum, and palladium have also declined, indicating a broader adjustment in precious metals rather than just a gold shift. The market is readjusting across the board due to stronger dollar dynamics and renewed worries that the ceasefire may be collapsing.
XAUUSD Technical Outlook
XAUUSD is trading near 4791, easing slightly as price continues to move sideways following its recovery from the 4098 low. The broader structure shows a stabilisation phase, with gold struggling to build momentum after reclaiming the mid-range. Recent candles reflect indecision, with price repeatedly testing but failing to break cleanly above nearby resistance.
From a technical standpoint, the market is range-bound with a mild bearish tilt in the short term. Price is hovering just below the 5-day (4809) and 10-day (4772) moving averages, which are flattening and beginning to act as dynamic resistance.
The 20-day (4662) remains below as a support base, suggesting the downside is still contained unless that level breaks.
Key levels to watch:
Support: 4770 → 4660 → 4410
Resistance: 4815 → 4900 → 5050
Gold is currently sitting just under the 4815 resistance zone. A move back above this level could shift momentum and open a push toward 4900. However, repeated rejection here keeps the upside capped for now.
On the downside, 4770 is acting as immediate support. A break below this level could lead to a deeper pullback toward 4660, which aligns with the 20-day moving average and a key structural support.
Overall, XAUUSD is consolidating within a tight range, with neither buyers nor sellers in clear control. The next move will likely be driven by a break of 4815 resistance or 4770 support, which should give clearer direction for the short-term trend.
What Traders Should Watch Next
The next move depends on whether the breakdown in the ceasefire becomes more severe and whether oil keeps climbing. If Hormuz stays shut and crude continues rising, the dollar and yields may remain firm enough to keep gold under pressure.
If tensions ease again and energy prices pull back, bullion can stabilise quickly because the broader chart is still not broken.
Why Did Gold Fall Even Though Geopolitical Tensions Rose Again?
Gold fell because the market focused more on the inflation and rate channel than on the safe-haven channel. A stronger dollar, firmer Treasury yields, and higher oil prices made bullion less attractive in the short term, even as US-Iran tensions worsened. Spot gold was recently down 0.7% to $4,794.21, while June futures fell 1.3% to $4,813.70.
Why Does A Stronger Dollar Pressure Gold Prices?
Gold is priced in dollars, so a firmer dollar makes bullion more expensive for buyers using other currencies. That usually weakens demand at the margin and can push prices lower, especially when yields are rising too.
Why Are Higher Oil Prices Hurting Gold Instead Of Helping It?
Higher oil prices are reviving inflation fears and pushing yields higher. Gold can act as an inflation hedge over time, but in the near term it often struggles when inflation drives interest rates and the dollar up faster than investors add to bullion exposure.
What Role Did The Strait Of Hormuz Play In Gold’s Move?
The renewed closure of the Strait of Hormuz pushed oil prices higher and brought the inflation shock back into focus. The market has treated that as a reason to buy dollars and reprice yields, which has weighed on gold.
Why Is Gold Not Acting Like A Classic Safe Haven Right Now?
The market is treating gold more as a rates-sensitive asset than a pure crisis hedge. When war risk lifts oil, and oil lifts inflation expectations, the immediate effect can be higher yields and a stronger dollar, both of which work against bullion.
How Much Has Gold Fallen Since The Conflict Started?
Gold has fallen about 8% since the US and Israel launched strikes on Iran in late February, according to the latest market coverage. That reflects how much higher-for-longer rate fears have outweighed the usual safe-haven bid.
Start trading now – Click here to create your real VT Markets account
USD/JPY traded higher near 159.00 in early European trading on Monday. The Japanese Yen weakened as renewed US-Iran tensions and reports of the Strait of Hormuz being closed supported the US Dollar.
US President Donald Trump said on Sunday that US Marines took custody of a vessel that tried to pass an American blockade on Iranian ports, according to the Guardian. Iran’s Foreign Ministry spokesman Esmail Baghaei said the US blockade of Iran’s ports and coastline is an act of aggression that violates the ceasefire.
Geopolitical Tensions Lift The Dollar
The ongoing dispute added support for the US Dollar in the near term. This kept USD/JPY in positive territory around 159.00.
Bank of Japan Governor Kazuo Ueda on Friday avoided pointing to an April rate rise, citing uncertainty from a “negative supply shock” linked to the war. Markets widely expect the Bank of Japan to keep rates unchanged until at least June 2026.
Japan’s officials also raised their monitoring of the exchange rate. Finance Minister Satsuki Katayama said Japan is watching markets with a “high sense of urgency” and may act against speculative moves.
Looking back at the situation in 2025, we can see the market was tense with USD/JPY pushing 159.00. The combination of US-Iran conflict and a hesitant Bank of Japan created a powerful upward force on the dollar. This was the environment where fears of currency intervention were at their peak.
Market Focus Shifts To Monetary Policy
Shortly after those warnings in 2025, Japanese authorities did step into the market when the pair briefly touched 160.20, an action that sent the pair tumbling five big figures in a single session. That intervention, costing a reported ¥9 trillion, set a new precedent for volatility and showed that verbal warnings would be backed by decisive action. We now see that event as the peak of the divergence trade, as underlying fundamentals have since started to shift.
Today, the geopolitical risk from Iran has subsided, but the focus has pivoted entirely to monetary policy. Japan’s latest core CPI reading came in at a stubborn 2.8%, well above the BoJ’s target, increasing pressure for the central bank to finally act. With the pair having crept back up to 156.50, the market is now pricing in a near-certain rate hike at the June 2026 meeting.
For derivative traders, this changes the game from anticipating sudden intervention to positioning for a planned policy shift. While buying out-of-the-money puts on USD/JPY was a good hedge against intervention in 2025, the strategy now should focus on the BoJ’s June meeting. We believe traders should look at buying options straddles or strangles expiring in late June to capture the significant volatility expected around that central bank decision.
Gold prices in Pakistan fell on Monday, based on data compiled by FXStreet. Gold was priced at PKR 43,088.14 per gram, down from PKR 43,444.40 on Friday.
The price per tola dropped to PKR 502,571.00 from PKR 506,727.00 on Friday. Other listed rates were PKR 430,880.90 for 10 grams and PKR 1,340,221.00 per troy ounce.
How Local Gold Prices Are Calculated
FXStreet calculates local gold prices by converting international prices using the USD/PKR rate and local measurement units. Prices are updated daily at the time of publication and are for reference, as local market rates may differ slightly.
Central banks are the largest holders of gold. They added 1,136 tonnes worth around $70 billion in 2022, according to the World Gold Council, the highest annual total since records began.
Gold often moves in the opposite direction to the US Dollar and US Treasuries, and it can also move against risk assets such as equities. Prices may also respond to geopolitical events, recession fears, and changes in interest rates, as gold is priced in US dollars.
We see the small dip in gold prices as a temporary breather rather than a major shift. This could present a buying opportunity for traders positioning for the coming months. The market is primarily focused on future central bank policies, especially from the US.
Outlook And Trading Considerations
The persistent chatter about the Federal Reserve starting to cut interest rates later this year is a significant tailwind for gold. We saw US inflation data cool in the final quarter of 2025, which supports the case for lower rates. As a non-yielding asset, gold becomes more attractive when interest rates fall.
We should also consider the steady demand from central banks, which provides a solid floor for prices. Last year, in 2025, central banks in emerging economies were once again major buyers, with the People’s Bank of China adding significantly to its reserves each month. This underlying demand is a powerful long-term bullish signal.
The US Dollar’s recent softness also supports higher gold prices, as a weaker dollar makes gold cheaper for foreign buyers. The Dollar Index (DXY) has trended below the 104 mark, reflecting the market’s expectation of rate cuts. Lingering geopolitical instability continues to underpin gold’s appeal as a safe-haven asset.
For derivative traders, this suggests that buying call options with expirations in the next three to six months could be a prudent strategy. This allows us to capitalize on potential price increases driven by rate cuts without taking on the full risk of holding the physical asset. Look for strikes just above the current trading range to balance cost and potential upside.
Gold traded below $4,800 and rebounded modestly from $4,737–$4,738, a one-week low reached in Asia on Monday. It rose towards $4,815 as the US Dollar eased from a one-week high.
A jump in crude oil raised inflation concerns and lifted US Treasury yields. Higher yields limited gains in the non-yielding metal.
Hormuz Ceasefire Risk
Tensions rose over the Strait of Hormuz ahead of the ceasefire end date of 22 April. The US Navy seized an Iranian-flagged cargo ship in the Gulf of Oman during a blockade.
Iran said the action broke the ceasefire and closed the Strait again after reopening it following a 10-day truce between Israel and Hezbollah on Friday. President Donald Trump said the blockade would continue until a peace deal is agreed.
The White House said Vice President JD Vance would lead a second delegation for more talks. Iranian state media said officials will not join while the blockade remains.
Markets priced lower odds of a Fed rate rise, with the FedWatch Tool showing about a 40% chance of a rate cut by year-end. Gold’s recent rise started near the March swing low around $4,100.
Technically, price struggled above the 100-hour SMA at $4,805.60. RSI was near 44, and MACD stayed negative, with resistance at the same average.
Volatility Strategy Setup
With gold caught between a rising dollar and long-term dovish Fed expectations, the most immediate factor for us is the April 22nd ceasefire deadline. The current standoff in the Strait of Hormuz creates significant uncertainty, which is compressing gold below the key $4,800 level. This tension ahead of a major deadline suggests a sharp price movement is becoming more likely.
Given the binary nature of the outcome, traders should consider strategies that profit from a spike in volatility rather than a specific direction. Buying options straddles or strangles with expirations in early May would allow us to capitalize on a large price swing, whether it’s a relief rally from a peace deal or a sharp drop from escalating conflict. The defined risk of these positions is well-suited for such a high-stakes geopolitical event.
This view is supported by the rise in the CBOE Gold Volatility Index (GVZ), which we’ve seen climb to 21.5 in recent days, a sharp increase from the 16.8 average we saw in March 2026. Data shows implied volatility on at-the-money gold options expiring next month has jumped by over 25% in the past week alone. This indicates the market is actively pricing in a significant move, making volatility itself a tradable asset.
If we are forced to take a directional view, the immediate pressure favors the downside as long as gold remains below the $4,805 Simple Moving Average. The strengthening US dollar, which just saw its trade-weighted index hit a six-week high of 106.50, acts as a primary headwind. A breakdown of talks could see gold retest the $4,737 low quickly, making put options or bear put spreads attractive for their defined risk.
We saw a similar dynamic play out in the lead-up to geopolitical events in 2025, where initial safe-haven demand flowed into the US dollar, temporarily suppressing gold prices. In the fall of 2025, fears around the South China Sea conflict initially pushed the dollar higher before gold eventually broke out. This historical precedent suggests that in the short-term, the dollar can win the safe-haven battle.
Conversely, any surprise de-escalation or a successful peace talk led by Vice President Vance would likely cause a sharp reversal. In this scenario, the market’s focus would snap back to the 40% chance of a Fed rate cut by year-end. A decisive break above $4,805 would be our signal to initiate bullish positions, such as buying call options, to ride the potential wave of renewed monetary policy focus.
First-quarter 2026 data showed that central bank buying slowed to just 220 tonnes, down from the record pace we witnessed in the latter half of 2025. This suggests large, price-insensitive buyers are currently on the sidelines awaiting clarity on the geopolitical front. A peaceful resolution could trigger their re-entry into the market, providing a significant tailwind for prices.
Gold prices in India fell on Monday, based on FXStreet data. Gold was priced at INR 14,338.81 per gram, down from INR 14,461.07 on Friday.
Gold also dropped to INR 167,244.20 per tola from INR 168,670.10 on Friday.
How The Prices Are Calculated
Other listed prices were INR 143,390.50 for 10 grams and INR 445,990.90 per troy ounce.
FXStreet derives Indian gold prices by converting international rates using USD/INR and local units. Prices are updated daily at the time of publication and are for reference, as local rates may vary.
Central banks were reported as the largest holders of gold. World Gold Council data said central banks added 1,136 tonnes of gold worth around $70 billion in 2022, the highest annual purchase since records began.
Gold is often described as a store of value and a hedge against inflation and currency weakness. It is also linked to moves in the US Dollar, US Treasuries, interest rates, and market risk, with gold priced in US dollars (XAU/USD).
Why This Dip May Matter
Given the minor price dip today, we see this not as a sign of weakness but as a potential entry point. The broader trend for gold has been strong, breaking through previous highs we witnessed back in 2024 and consolidating through much of 2025. This small pullback could be a valuable opportunity before the next leg up.
The fundamental environment remains highly supportive for gold. After the series of interest rate hikes ended in 2024, we’ve seen inflation remain stubborn, with the latest U.S. CPI data from March 2026 hovering at 2.9%, still well above the target. Markets are now pricing in a greater than 60% chance of a Fed rate cut by the fourth quarter, which makes holding a non-yielding asset like gold more attractive.
We should also remember the immense and consistent demand from central banks. Following the record purchases seen in 2022 and 2023, World Gold Council data showed that central banks globally added another 1,037 tonnes to their reserves in 2024 and continued with strong buying throughout 2025. This consistent demand acts as a strong floor for prices, limiting the potential downside for any short-term trades.
The US Dollar’s recent behavior is a critical signal for us. After a period of strength through late 2025 that capped gold’s gains, the dollar index has now broken below the key 103 level for the first time this year. A weakening dollar is historically a powerful tailwind for gold prices, and this shift should not be ignored.
With ongoing geopolitical tensions and the VIX volatility index creeping up from its 2025 lows, gold’s role as a safe-haven asset is becoming increasingly important. The environment suggests that traders could consider using options to manage risk and position for upside. Strategies like bull call spreads might be prudent to capitalize on a potential rise while defining risk in this uncertain market.
Japan’s Tertiary Industry Index fell by 0.4% month on month in February. This followed a 1.7% rise in the previous month.
The latest reading shows a reversal from growth to contraction over the month. The index tracks monthly output in Japan’s service sector.
Implications For Japans Service Sector
The recent data showing Japan’s Tertiary Industry Index fell by 0.4% in February is a significant reversal from the strong 1.7% growth seen previously. This is a clear signal of weakness in the domestic service sector, which is the backbone of the economy. We believe this challenges the narrative of a sustained Japanese economic recovery that many had priced in.
This downturn in services makes it highly unlikely the Bank of Japan will consider tightening policy in the near future. Recent March core CPI data, which came in below consensus at 1.9%, further supports a dovish stance from the central bank. Therefore, we are looking at strategies that benefit from a weaker yen, potentially targeting a move in USD/JPY above the 158 level.
For equity traders, this points to headwinds for the Nikkei 225, as domestic consumption appears to be faltering. The disappointing March retail sales figures released last week, which showed growth missing expectations, confirm this consumer weakness. We are therefore considering buying put options on the index to hedge against a potential downturn over the next few weeks.
Looking back, the broad optimism we saw in the latter half of 2025, when services activity was consistently strong, has now faded significantly. The market’s focus has shifted from recovery to concerns about stagflation, especially with global commodity prices remaining firm. This abrupt change in the domestic picture requires a reassessment of long-held bullish positions.
Given the potential for increased market volatility leading into the late April Bank of Japan meeting, we see an opportunity in options. The conflicting signals between a weak domestic economy and a potentially stable global environment could cause sharp price swings. Buying straddles on major currency pairs like EUR/JPY allows us to profit from a significant move, regardless of the direction.
Gold prices in Malaysia fell on Monday, based on FXStreet data. Gold was MYR 609.53 per gram, down from MYR 614.26 on Friday.
Gold eased to MYR 7,109.47 per tola from MYR 7,164.64 per tola on Friday. Other listed prices were MYR 6,095.33 for 10 grams and MYR 18,958.91 per troy ounce.
How FXStreet Calculates Local Gold Prices
FXStreet calculates Malaysia’s gold prices by converting international prices using the USD/MYR rate and local units. Rates are updated daily at the time of publication and are for reference, with local prices possibly differing slightly.
Central banks are the largest holders of gold and use it to diversify reserves. They added 1,136 tonnes worth around $70 billion in 2022, the highest yearly purchase on record, according to the World Gold Council.
Gold often moves inversely to the US Dollar and US Treasuries, and can also move opposite to risk assets such as shares. Prices may also shift with geopolitical events, recession fears, and changes in interest rates, as gold is priced in US dollars (XAU/USD).
Gold prices have seen a slight dip, which we see not as a sign of weakness but as a potential consolidation within a larger uptrend. This minor pullback could present an opportunity for positioning in the coming weeks. Traders should look beyond the daily noise and focus on the underlying macroeconomic factors.
Outlook And Strategy Considerations
The market is increasingly pricing in potential US Federal Reserve interest rate cuts later this year, putting pressure on the dollar. A weaker dollar and lower rate expectations are strong tailwinds for gold. Recent data shows the Dollar Index (DXY) has fallen from its early 2026 highs, which supports this outlook on precious metals.
Looking back from 2025, we recall the record-breaking central bank purchases in 2022, a trend that has not stopped. World Gold Council data through 2024 confirmed that central banks were massive net buyers, absorbing over 1,000 tonnes for two consecutive years. This consistent demand provides a strong floor under the market, limiting the downside of any pullbacks.
Ongoing geopolitical instability also reinforces gold’s role as a safe-haven asset, adding to its appeal. Therefore, we are considering buying call options with expirations in the third quarter of 2026 to capitalize on potential upside. This strategy allows for leveraged exposure to rising prices while defining our maximum risk.
EUR/JPY rose after falling by nearly 0.5% in the previous session, trading near 186.80 during Asian hours on Monday. The daily chart shows price action moving higher inside an ascending channel.
The cross remains above the nine- and 50-period Exponential Moving Averages (EMAs), which supports the near-term upward trend. The 14-day Relative Strength Index is 62.30, showing positive momentum without reaching extreme levels.
Key Resistance And Upside Targets
Immediate resistance is seen at 187.00, followed by the all-time high of 187.95 set on 17 April. If the move extends, the pair could test the upper channel boundary near 188.60.
On the downside, first support is the nine-day EMA at 186.58, then the lower channel boundary around 186.00. If price breaks below the channel, it may move towards the 50-day EMA at 184.51.
We see the bullish technical trend in EUR/JPY is fundamentally supported by monetary policy divergence. The current interest rate differential, with the European Central Bank’s policy rate at 3.5% versus the Bank of Japan’s 0.1%, continues to make holding the Euro more attractive. This policy gap is the primary driver behind the sustained uptrend.
Given the room for upside indicated by the RSI, we are looking at buying call options with strikes near the 188.00 level. This strategy aims to capitalize on a potential move towards the recent all-time high and the upper channel boundary. The latest Eurozone inflation report, showing a steady 2.4%, suggests the ECB will not rush to cut rates, which further strengthens our conviction.
Risk Management And Downside Hedges
For risk management, the nine-day EMA at 186.58 is our first line of defense. We remember the sharp pullback on intervention fears back in the third quarter of 2025, so a confirmed break below the 186.00 channel support would prompt us to reduce long exposure. Cautious traders might consider buying protective puts below this level to hedge against a similar sudden downturn.