S&P 500 futures expected to stay within a range, with specific bullish and bearish targets set
AUD traders watch for upcoming data that may impact USD weakness and potential RBA rate cuts while analyzing AUD/USD.
Focus On Inflation Data
The US CPI report is attracting attention. Many now believe a rate cut could happen in September unless inflation data suggests otherwise. For the AUD, inflation has decreased, leading to a possible RBA rate cut tomorrow. If labor market data shows further weakness, markets predict at least two more cuts by the end of the year. Looking at AUDUSD technical analysis, the daily chart shows prices are between two key levels. The 4-hour chart displays a small upward trendline, while the 1-hour chart shows trading near a minor support zone. If the price falls below current support, sellers might target the 0.6485 support level. Key upcoming events include the RBA’s rate decision, US CPI, Australian Wage Price Index, and employment data. These developments are expected to significantly influence market sentiment and future predictions. We are preparing for a busy week focused on the US inflation report and the RBA’s rate decision tomorrow. The US dollar has struggled since the July Non-Farm Payrolls report, which revealed a disappointing figure of 155k, changing expectations for rate cuts.Expectations And Strategies
The market is now anticipating a higher chance of a Federal Reserve rate cut by year-end, with fed funds futures suggesting almost a 70% likelihood of a September move. Following a small dip in core inflation in June 2025, another weak CPI tomorrow would likely encourage a dovish message from the Fed at Jackson Hole later this month. We believe a surprisingly high inflation figure, above 0.4% month-over-month, would be needed to change this outlook. On the Australian front, we expect a rate cut from the RBA tomorrow, a move the markets have already priced in. This follows the latest data showing second-quarter 2025 inflation dropped to an annual rate of 3.1%, continuing the downtrend from the previous quarter. Market reaction will depend on the RBA’s guidance for future cuts. For derivative traders, this situation creates the potential for increased volatility. Buying short-dated straddles or strangles on AUDUSD, set to expire just after this week’s data, could be a smart way to prepare for sharp price movements in either direction. This strategy benefits from significant swings, whether caused by the RBA or the US CPI. Currently, 1-week implied volatility for AUDUSD options has risen to over 14%, much higher than the 9% average during July 2025. This suggests a breakout is likely, but also makes buying options more costly. Selling options could be risky now but may become a good strategy if key events conclude without major changes in direction. From a tactical view, the technical levels indicate clear strikes for option trades. A drop below the 0.6512 support level could activate put options, targeting strikes around 0.6485 or lower. On the other hand, traders with call options will hope that this support holds firm, allowing them to push towards higher resistance levels. Looking ahead, Australian employment figures and US retail sales data later this week will play a vital role in establishing any new trends. This data will impact pricing for options with longer expirations, such as those in September and October. Continued weakness in both economies could lead to a range-bound scenario for the currency pair. Create your live VT Markets account and start trading now.Citi raises its S&P 500 year-end forecast to 6,600 amid ongoing optimism for AI stocks
Focus on Call Options
With major firms aiming for 6,600 by the end of the year, it might be wise to consider buying call options to benefit from this anticipated rise. As it is now mid-August, contracts that expire in December 2025 provide a good mix of time and potential profit. This will allow us to join in the expected rally through the year’s end. The market is showing strong signs, with the S&P 500 up over 18% year-to-date, recently surpassing the 6,150 mark. This upward movement is driven by the AI sector, where leading companies beat Q2 earnings estimates by an average of 12%. Furthermore, the July CPI report came in at a mild 2.9%, giving the Federal Reserve little reason to raise rates and disrupt this trend. Of course, we must also consider the possibility of a slower third quarter. To manage this risk, we can hedge our long positions by buying shorter-term put options, possibly with September or October 2025 expirations. Since the VIX is around a low 14 currently, this type of protection for our portfolio is not too costly. We should direct our strategies toward the AI-driven stocks fueling this market. Using call spreads on leading technology ETFs is a smart, cost-effective way to bet on their continued strength. Selling cash-secured puts on strong AI stocks after any slight dips is another strategy to express a positive outlook while collecting some premium.Historical Market Trends
This scenario feels reminiscent of late 2023, when the market slowed in the summer months before rallying strongly into the new year. It seems wise to brace for some short-term weakness while maintaining a positive outlook for the fourth quarter. This approach allows us to manage risk during the typically slower months of August and September. Create your live VT Markets account and start trading now.Gold prices drop as traders seek clarity on US tariffs amid ongoing market uncertainty
Key Price Levels
Gold prices have moderated at the spot level, dropping below the 100-hour moving average. The 1% decline draws attention to the 200-hour moving average, around $3,352. Holding above this level maintains a neutral outlook, but dropping below could shift focus towards sellers. Gold has been consolidating since May, waiting for a break from this phase. An upward move may find resistance in the $3,435-$3,450 range, while downward risks center around the 100-day moving average at $3,292. A significant drop below this level could signal a deeper correction. As of August 11, 2025, the key issue for gold is the uncertainty surrounding US tariffs. Last week’s increase in COMEX futures was a quick reaction to unconfirmed rumors, and prices are now easing as initial panic fades. This uncertainty opens doors in the derivatives market, especially concerning volatility. The spread between COMEX and London futures has tightened from over $120 to around $60, indicating the speculative excitement is waning. This suggests that betting on short-term volatility using options might be wiser than making long-term directional bets.Market Sentiment
The economic landscape adds to the uncertainty, as the Consumer Price Index data from July 2025 showed a rise of 3.1%, slightly above expectations. This supports the Federal Reserve’s cautious position from its recent meeting, likely preventing any major price surges for now. Thus, making large bets on gold futures appears risky until clearer signals emerge. In the near term, we are monitoring the 200-hour moving average at $3,352 as a critical pivot point. A decisive break below this could lead to more selling, making short-dated put options an appealing strategy. If prices maintain above this level, the market will stay in a neutral state. Looking at the broader picture, gold has been trapped in a range since May 2025. The most significant support level remains the 100-day moving average at $3,292. We haven’t seen a substantial break below this since October 2023, marking it as a critical line for a larger correction. Sentiment in the options market shows this caution, as the put-to-call ratio for gold has reached a three-month high. This indicates that traders are increasingly buying protection against a potential drop below the key support of $3,292, suggesting a bearish trend in positioning for the weeks ahead. For those seeking upside potential, a breakthrough above the recent highs of $3,435-$3,450 is necessary to indicate renewed bullish momentum. Only then would buying call options targeting the $3,500 mark makes sense. Until that happens, the market appears to favor sellers or those expecting continued consolidation. Create your live VT Markets account and start trading now.Pound strengthens as Bank of England takes a hawkish stance amid US economic concerns
Technical Overview
Technically, GBPUSD is close to a significant downward trendline, with sellers targeting a drop to the 1.3140 level. On the 4-hour chart, a minor upward trendline supports bullish momentum. Key upcoming events include UK employment data and US CPI, along with other reports like UK GDP and US Retail Sales throughout the week. Attention will also be on further comments from the Fed after the US CPI figures. The pound is rising against the dollar due to different signals from the central banks. The recent NFP report in the US led the markets to expect more rate cuts from the Federal Reserve. At the same time, the Bank of England is showing concern about inflation, driving upward pressure on the pair. The BoE’s cautious approach makes sense when we look at the data from August 2025. UK core inflation hasn’t fallen significantly and was at 3.5% for July. Additionally, second-quarter wage growth was strong at 5.8%. Historically, core inflation has been above 3% since 2021, making the BoE’s job particularly challenging.Market Sentiment and Strategies
Conversely, the dollar has weakened since the July Non-Farm Payrolls report showed only 150,000 jobs added—below expectations. Now, the markets are pricing in 58 basis points of Fed cuts by year’s end, a significant change from just weeks ago. The upcoming US CPI report on August 12th is expected to be a crucial event that could influence this outlook. As the pair tests a major trendline, traders should consider strategies to manage risk during this data-heavy week. Purchasing call options with a strike price above the current trendline could be a strategy to target a breakout towards the 1.3590 level. This allows potential upside while limiting the maximum loss to the premium paid. On the other hand, traders who believe the trendline will hold or expect a surprisingly high US inflation report may opt for put options. This would position them for potential rejection at this critical technical level and a decline back toward the 1.3140 support. This strategy also limits risk if the pound keeps rising unexpectedly. Create your live VT Markets account and start trading now.Ethereum’s price fluctuates, setting specific bullish and bearish targets for traders.
Italy’s final HICP for July holds steady at 1.7%, unchanged from preliminary figures, impacting ECB policy
Stable Inflation Rates
The Consumer Price Index (CPI) also recorded a 1.7% year-on-year increase, matching its initial reading. These results align with earlier predictions and show that inflation rates are stable. The final figures for July confirm a trend of gradual cooling. This suggests that the European Central Bank will likely not feel the need to make any changes to its policies, and markets should consider this information routine. This Italian data fits well with the overall Eurozone situation. The latest flash estimate for Eurozone HICP in July 2025 stands at 2.2%. While this is still above the ECB’s target, it’s a significant drop from the peaks we experienced in 2022 and 2023. The slow process of reducing inflation is exactly why the central bank is remaining cautious. For interest rate derivatives, this stability hints at consistent behavior in the short-term market. We shouldn’t anticipate major changes in short-term ESTR swaps or Euribor futures before the ECB’s September meeting. The most likely scenario is for these instruments to stay within their recent ranges, as expectations for rate cuts in the latter half of 2025 have already been adjusted.Consistent Policy Outlook
This consistent policy outlook is likely to minimize market volatility. The VSTOXX index, which measures volatility for Euro Stoxx 50 options, has been steadily declining and recently reached levels not seen since mid-2024. In this environment, strategies that benefit from low volatility, like selling options, can be advantageous, but caution is still advised. The weak economic backdrop supports the idea that the ECB will remain inactive. Recent data indicates that Eurozone GDP grew only 0.2% in the second quarter of 2025, limiting the ECB’s ability to act aggressively, even if inflation remains slightly elevated. The central bank is trying to balance the fight against inflation with the need to support a fragile economy. Reflecting on previous trends, this period resembles the aftermath of the 2012 sovereign debt crisis, during which policy remained quite stable for an extended time. At that time, attempting to chase large directional moves proved to be unsuccessful. For the upcoming weeks, the focus should be on range-trading strategies and capitalizing on a calm market. Create your live VT Markets account and start trading now.Swiss sight deposits fell to CHF 465.9 billion due to adjustments after a policy change.
SNB’s Neutral Policy Stance
The ongoing slight decline in SNB sight deposits indicates that the central bank is taking a neutral stance. They are not buying foreign currency to weaken the Swiss franc. This reinforces the neutral policy they adopted after the June meeting. This approach is supported by current economic conditions. As of July 2025, Swiss inflation remains steady at 1.8%, comfortably within the SNB’s target range of 0-2%. This stability gives them little reason to change policies, especially since the European Central Bank has begun rate cuts, which tends to strengthen the franc. For traders dealing with derivatives, this indicates low volatility in franc currency pairs. One-month implied volatility on EUR/CHF options has dropped to 4.5%, nearing the multi-year lows from early 2024. This environment favors strategies like short strangles, allowing traders to earn premiums from market stability.Strategic Trading Opportunities
The SNB’s inaction effectively supports the franc, especially as EUR/CHF trades below the 0.9700 level. Traders may want to buy short-dated, at-the-money call options on the CHF against the EUR. This is a cost-effective method to position for a stable or gradually strengthening franc, as the SNB seeks to control imported inflation. We are now in a different phase compared to the heavy interventions seen after 2015. After cutting rates in March 2024, the SNB seems happy to wait. In the coming weeks, the emphasis will likely remain on a gentle reduction of liquidity rather than active currency manipulation. Create your live VT Markets account and start trading now.Dividend Adjustment Notice – Aug 11 ,2025
Dear Client,
Please note that the dividends of the following products will be adjusted accordingly. Index dividends will be executed separately through a balance statement directly to your trading account, and the comment will be in the following format “Div & Product Name & Net Volume”.
Please refer to the table below for more details:
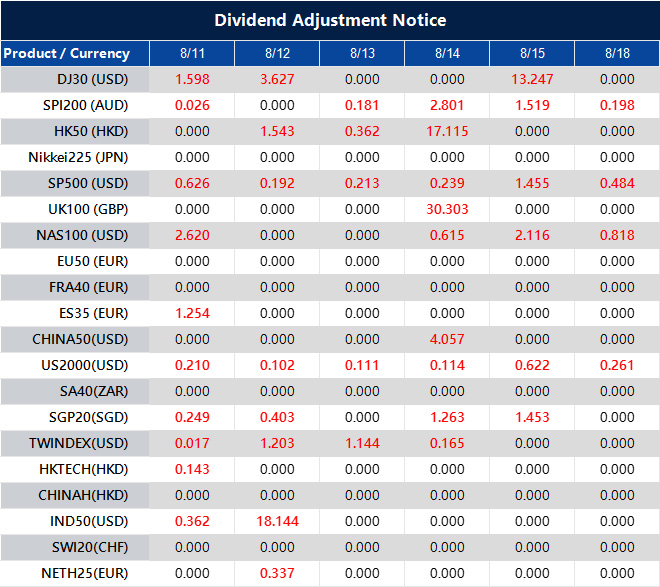
The above data is for reference only, please refer to the MT4/MT5 software for specific data.
If you’d like more information, please don’t hesitate to contact [email protected].
Week Ahead: From Surge to Balancing Act

After a blistering start to the year, Wall Street has reached the part of the climb where the air feels thinner. Earnings remain on the rise, though the pace is easing. The S&P 500 booked gains of 13.6% in Q1 and 10.3% in Q2, but forecasts for the next two quarters suggest growth slowing to 7.6% and 7.0%. Still healthy, but no longer the double-digit bursts that make rallies easy.
One unusual twist this quarter: in July, analysts inched their Q3 expectations slightly higher — the first such move since Q2 2024. Optimism was strongest in Energy and Technology, though Healthcare lagged. With valuations around 22 times forward earnings, the market’s tolerance for disappointment is thin. A spike in tariffs or a softening in demand could quickly change the mood.
The Federal Reserve is stepping further into the spotlight. July’s jobs report disappointed, with only 73,000 new positions compared to the 110,000 expected, alongside downward revisions of 258,000 for previous months. Wage growth is cooling, temporary jobs are fading, and the labour market is loosening faster than many anticipated.
Traders now see a 90–95% probability of a September rate cut and expect around 62 basis points of easing by year-end. That implies two or three cuts, pushing rates towards 4% by early 2026. The market welcomes looser policy — but for the wrong reason. It’s not a clear win over inflation driving the shift, but mounting concerns over growth.
Trade tensions are simmering just below boiling point. On 12 August, the pause on U.S.–China tariffs is due to expire. If that happens, tariffs on many goods could snap back to around 80%. President Trump has already doubled tariffs on Indian imports to 50% and is considering targeted measures on Canadian and Mexican goods. Technology, automotive, and industrial sectors are particularly exposed.
The semiconductor industry is under the microscope, with Trump threatening 100% tariffs unless U.S. chip output ramps up. This has sparked a flood of record-breaking investment. Apple, TSMC, Nvidia, GlobalFoundries, and Texas Instruments are collectively committing hundreds of billions to build US capacity. While it’s a long-term push for supply chain resilience, in the short term it could squeeze free cash flow, pressure margins, and test investor patience.
Geopolitics In Play
Global affairs could deliver surprises in either direction. Trump is pressing for a resolution to the Russia–Ukraine conflict, and signals from Moscow suggest talks may be on the table. In the Middle East, the Gaza situation could be shifting, with key Arab nations and the EU urging Hamas to step aside. Any breakthrough here might drive oil prices lower, cool inflation, and give sectors such as airlines, transport, and consumer discretionary a boost.
Meanwhile, the Fed’s balance sheet has been trimmed from $9 trillion to $6.7 trillion, with quantitative tightening expected to conclude around $6.2 trillion in early 2026. Liquidity will remain tight until then, and a return to quantitative easing is unlikely unless the economy tips into a deep recession. The coming months will be a balancing act; weighing possible support from Fed cuts or peace deals against headwinds from slower earnings, trade shocks, and a weakening jobs market.
Market Movements Of The Week
Currencies and commodities are setting up for an active spell as several assets approach key technical markers. The USD Index remains in consolidation, with traders eyeing 98.50 for potential selling pressure and 97.40 as the next downside checkpoint if momentum falters.
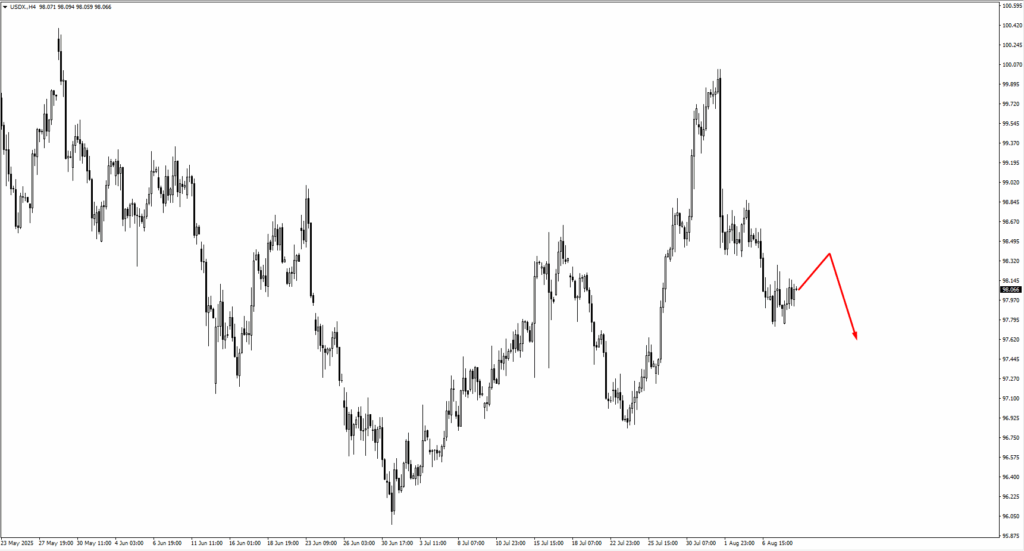
A softer dollar could lift EURUSD, where buyers may emerge at 1.1580 or 1.1545, with 1.1750 as the next upside target. Sterling shows a similar profile, with GBPUSD support at 1.3355 and 1.3300, while 1.3560 is the likely resistance.
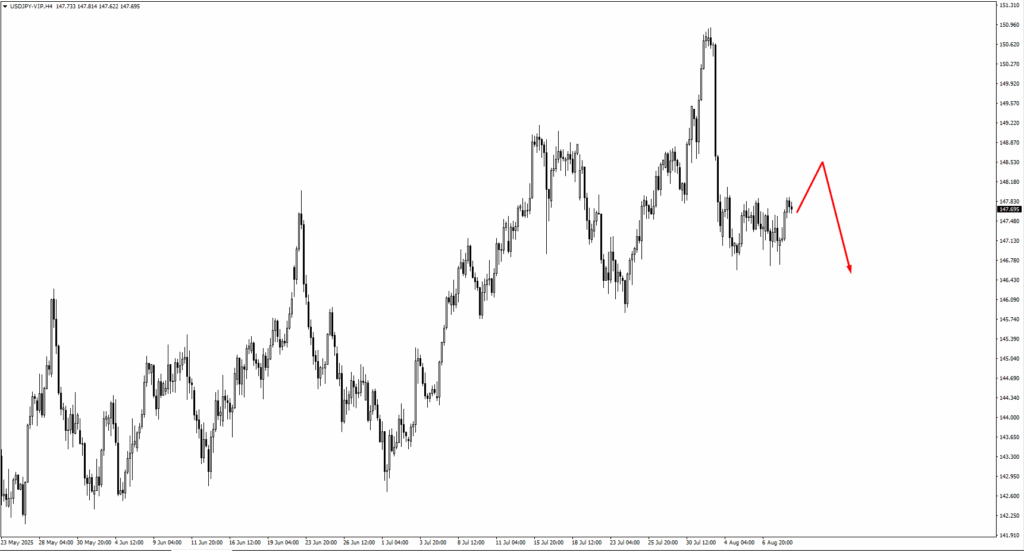
In yen trading, USDJPY’s upward drift has 148.75 and 149.30 under watch for signs of reversal. USDCHF could see sellers reappear if it rises beyond 0.8117 or 0.8150.
Among commodity-linked pairs, AUDUSD is nearing 0.6570, a level that may attract sellers, while NZDUSD’s next test lies at 0.6015. For USDCAD, buyers may step in near 1.3675 if the current decline continues.
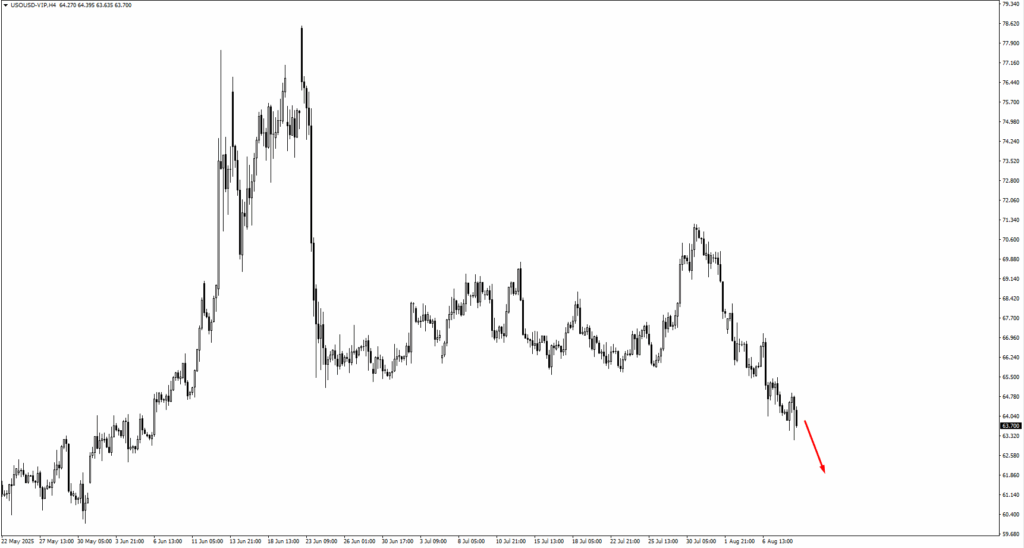
USOil remains under pressure, currently testing $63.35. A break lower opens the door to $61.15, particularly if consolidation patterns form here.
Gold’s rally has $3,430 in sight, a fresh zone to watch for profit-taking or reversal cues.
The S&P 500 has erased last week’s bearish tone and is pushing toward a potential new all-time high, with $6,630 marked as the next major reaction point.
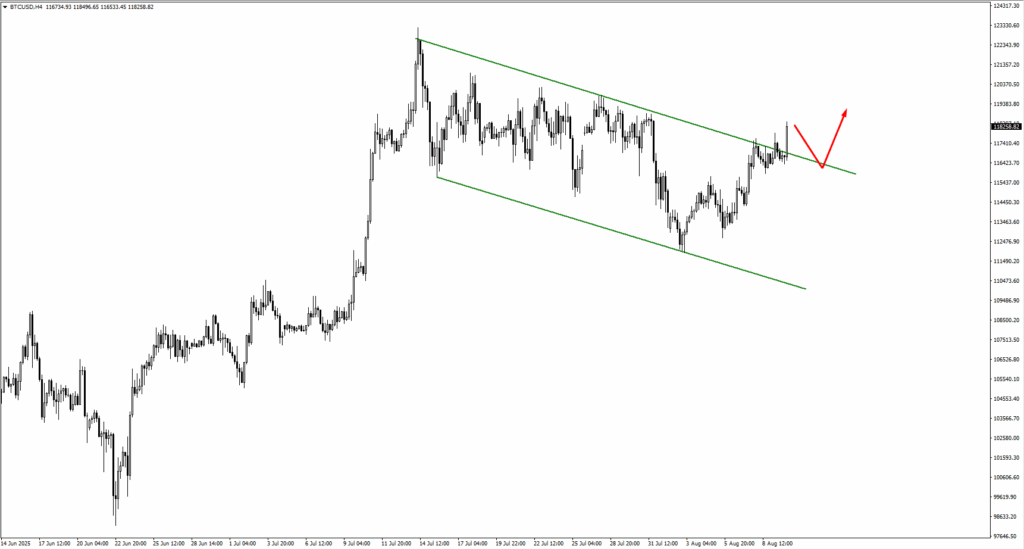
Bitcoin has broken out above its channel top and, after a period of consolidation, could advance toward $121,400. Natural Gas sits at $2.90; holding here could spark a rebound, while a drop to $2.55 may follow if momentum falters.
In each case, price behaviour around these levels will be critical. Sharp rejections could fuel reversals, while clean breaks on strong volume may set the stage for trend extensions. With macro risks from the Fed, tariffs, and geopolitical events still live, traders may want to blend technical signals with the broader market backdrop before committing to positions.
Key Events Of The Week
The macro calendar is light, but a few data releases could sway sentiment.
On Tuesday, 12 August, Australia’s cash rate decision is due, with forecasts pointing to a cut from 3.85% to 3.60%. If the Aussie dollar is testing 0.6570 while the USD Index presses support, AUDUSD could face fresh selling. The same day, U.S. CPI is expected at 2.8% year-on-year, up from 2.7%. This inflation reading will be closely watched, as it may influence the Fed’s pace of rate cuts after September.
Thursday, 14 August, brings the UK’s monthly GDP, forecast at 0.2% compared with -0.1% previously. While that’s an improvement, global headwinds continue to cloud the outlook. Also on Thursday, U.S. producer prices are expected to rise by 0.2% after a -0.5% drop, possibly hinting at building inflationary pressure at the wholesale level.
Friday, 15 August, rounds off with U.S. retail sales and preliminary University of Michigan consumer sentiment. Retail sales are forecast to grow 0.5%, slightly below June’s 0.6%, while sentiment is seen at 62.2 versus 61.7. Both will offer insight into the health of the U.S. consumer — still central to the growth outlook and, by extension, the Fed’s policy path.
Looking further ahead, traders will keep an eye on next week’s key events: Canada’s trimmed CPI on 19 August, New Zealand’s official cash rate decision on 20 August, and the Jackson Hole Symposium on 22 August, which could bring fresh central bank signals on rates and growth.
Create your live VT Markets account and start trading today.


