US durable goods orders excluding defence fell by 1.2% in February. This followed a 0.5% rise in the previous period.
Looking back, the decline in durable goods orders to -1.2% in February 2025 was an early warning of the economic cooling we experienced for the rest of that year. That data point signaled a pullback in business investment that extended well into the autumn. This trend confirmed that the high-interest-rate environment was finally taking a significant toll on capital expenditures.
Manufacturing Weakness Confirmed
This weakness was validated as the ISM Manufacturing PMI remained in contraction territory, below 50, for the subsequent ten months. For instance, we saw the index hover around 47 for much of late 2025, confirming the manufacturing sector’s persistent softness. This broad-based slowdown showed that the February 2025 number was not an anomaly but the start of a clear trend.
Throughout the second half of 2025, this economic uncertainty kept implied volatility elevated, making hedging strategies more expensive. We saw the VIX, the market’s fear gauge, average around 19 during that period, with several spikes above 22 during earnings seasons. This environment rewarded traders who were long volatility or had structured defensive positions using options.
The Federal Reserve was constrained by core inflation that remained stubbornly above 3% for most of 2025, forcing it to maintain a restrictive policy stance. This backdrop suppressed risk appetite and favored trades that benefited from high borrowing costs and low economic growth. Short-dated interest rate futures consistently priced out any significant rate cuts for the near term.
Now, however, we are seeing signs of a potential shift as the most recent March 2026 ISM manufacturing index just printed at 50.3, the first expansionary reading in over a year. This suggests we should consider gradually rotating out of purely defensive positions that have worked for the past year. It may be time to cautiously sell some of the expensive downside puts and begin building positions in call spreads on cyclical sectors.
Positioning For A Turn
Given this nascent sign of recovery, we should also monitor options on interest rate futures closely. If upcoming data like retail sales and employment confirm this economic bottoming process, the market will have to reprice the path of future Fed policy. This could create an opportunity to position for a steeper yield curve before the recovery narrative is fully embraced by the wider market.
US durable goods orders excluding transport rose by 0.8% in February. The forecast was 0.5%.
This stronger-than-expected data on business investment suggests the economy has more underlying momentum than previously thought. This report, combined with the March non-farm payrolls that showed a robust addition of 295,000 jobs, challenges the narrative for imminent Federal Reserve rate cuts. We believe the market will now have to reconsider the timing and magnitude of any easing cycle previously anticipated for the summer.
Rates Higher For Longer
Given this, we see opportunities in interest rate derivatives that bet on rates staying higher for longer. The odds of a June rate cut have likely diminished, making selling June or September 2026 SOFR futures an attractive position. This play is based on the expectation that the Fed will signal a more patient, data-dependent stance in its upcoming communications.
For equity indices, the news is a double-edged sword, likely creating volatility. While strong business spending is good for corporate earnings, the threat of delayed rate cuts could pressure valuations, particularly in the tech sector. Therefore, we are considering buying put spreads on the Nasdaq 100 index as a hedge against a market pullback driven by interest rate fears.
This economic strength should also translate to a stronger U.S. dollar. After the recent core CPI data showed inflation remaining sticky at 3.1%, the case for dollar-denominated assets improves relative to other currencies. We are looking at buying call options on the U.S. Dollar Index (DXY) to capitalize on a potential move higher, especially against the Euro.
This situation reminds us of the environment back in 2024, when persistently strong economic figures repeatedly forced the market to push back its rate cut expectations. With the VIX, a measure of market volatility, having recently traded at a low of 14, options premiums are relatively cheap. Buying some form of portfolio protection now seems prudent before the market fully digests this shift.
US durable goods orders excluding defence fell by 1.2% in February. This compares with a 0.5% rise in the previous period.
The February report showing a 1.2% drop in durable goods orders, excluding defense, confirms the economic cooling we have been watching for. This reversal from the slight growth seen in January suggests businesses are now pulling back on major investments. This is a clear signal that the higher interest rates from 2025 are finally starting to impact corporate spending plans.
Signs Of Economic Cooling
This weak business spending data, combined with recent online reports showing a dip in consumer confidence indices for March, paints a picture of a slowing economy. The March jobs report, released last Friday, also supported this by showing a moderation in wage growth to its slowest pace in over a year. We see this as a consistent trend of economic deceleration heading into the second quarter.
As a result, the probability of the Federal Reserve raising interest rates again in its May meeting has fallen dramatically. Current market pricing derived from Fed funds futures now indicates a greater than 60% chance that the Fed will hold rates steady, a sharp turnaround from the hawkish sentiment we saw late last year. This pivot in expectations is the most critical factor for our strategy in the coming weeks.
For equity derivatives, we should consider hedging against a potential market downturn, as slowing growth could impact corporate earnings. Buying put options on broad market indices like the S&P 500 or on cyclical sector ETFs offers a way to protect portfolios. With the VIX, a measure of expected market volatility, having recently climbed from 14 to 18, the cost of this insurance is rising, suggesting we should act soon.
In the interest rate markets, this data reinforces the view that bond yields may have peaked. We could use options on Treasury note futures to position for falling interest rates as the market begins to anticipate eventual rate cuts later this year. Looking back at similar economic slowdowns, like the one in 2019, defensive government bonds tended to perform well as investors sought safety.
This outlook also has implications for currency markets, as a less aggressive Federal Reserve typically weakens the U.S. dollar. We could explore strategies that benefit from a declining dollar, such as buying call options on the euro or Japanese yen. The U.S. Dollar Index (DXY) has already fallen 2% over the last three weeks, and this fundamental data provides a strong reason for that weakness to persist.
US durable goods orders fell by 1.4% in February. This was below the forecast of -0.5%.
The result shows a weaker reading than expected for the month. It compares the actual change (-1.4%) with the forecast (-0.5%).
The February durable goods orders miss is a significant red flag for the economy’s health. This negative surprise, at -1.4%, points to weakening business investment and manufacturing activity. We should therefore position for increased defensive posturing in the markets over the coming weeks.
We are considering buying puts on broad market indices like the S&P 500 (SPY) and specifically on the industrial sector ETF (XLI) to hedge against a potential downturn. This view is strengthened by the latest Industrial Production Index data, which showed a 0.6% contraction last month, confirming the slowdown in manufacturing. This creates a compelling case for downside protection through May expirations.
This weak data also changes the outlook for interest rates, making a Federal Reserve rate cut more likely than a hike. We anticipate yields on government bonds will fall, so we are looking at call options on Treasury bond ETFs like TLT. Looking back, we saw a similar situation in the third quarter of 2025, when a string of poor manufacturing reports preceded a fall in bond yields.
Heightened economic uncertainty often leads to a spike in market volatility. The CBOE Volatility Index (VIX) is currently trading near a relatively low level of 16, making volatility derivatives an inexpensive way to hedge. We see value in purchasing VIX call options as a direct bet on rising market fear.
This durable goods report is not an isolated piece of information, as it aligns with the recent decline in the Consumer Confidence Index to 97.5. This combination of weak business spending and shaky consumer sentiment reinforces our cautious stance. We will be monitoring upcoming employment data closely for further confirmation of this cooling trend.
Deutsche Bank’s Henry Allen says US and European equities have fallen less than during past oil shock periods, with markets appearing to price in a short conflict, firm macro data and still-dovish central banks. The S&P 500 and Europe’s STOXX 600 are 5–6% below their record highs.
US data cited include the March jobs report, the first covering the period since the strikes began on 28 February. It showed nonfarm payrolls rising by +178k, the strongest in 15 months, while unemployment edged down to 4.3%.
The note refers to earlier episodes when oil shocks coincided with equity drawdowns and later recoveries. Examples include 1979–80, when Paul Volcker raised rates aggressively and a US recession occurred in early 1980, and 1990–91.
It also references 2022, when global central banks raised rates aggressively during a bear market. That period was followed by a recovery in 2023, with the S&P 500 reaching a new record by early 2024.
The article states it was created with the help of an Artificial Intelligence tool and reviewed by an editor.
We are seeing that risk assets are holding up much better than they did during historical oil shocks. Looking back to the events of early 2025, the S&P 500’s drawdown was surprisingly shallow, with the index staying only 5-6% below its record highs. This pattern of resilience suggests that selling out-of-the-money puts to collect premium could be a viable strategy during any minor pullbacks in the coming weeks.
This market confidence seems rooted in strong economic fundamentals, which have continued into this year. The latest jobs report for March 2026 showed the economy added a solid 215,000 nonfarm payrolls, keeping the unemployment rate low at 3.8%. This underlying economic strength tends to dampen volatility, which could make shorting VIX futures profitable if the market remains steady.
We have seen this playbook before, even following more significant downturns. For instance, after the aggressive central bank rate hikes of 2022 led to a bear market, the S&P 500 staged a powerful recovery throughout 2023 and into early 2024. This history supports using any dips as opportunities to establish defined-risk bullish positions, such as buying call spreads, to capture a potential rebound.
A key factor is that central banks do not appear poised for aggressive tightening like they were in 1980 or 2022. Recent statements from the Federal Reserve indicate a continued pause on interest rates, especially with core inflation now trending just below 3%. This backdrop limits the probability of a sharp, unexpected market shock, providing a favorable environment for strategies that profit from range-bound or slowly appreciating markets.
Austria’s wholesale prices (not seasonally adjusted) rose by 3.9% month on month in March. This was up from a 0.7% rise in the previous month.
The latest figure shows a faster monthly increase than before. The data compares March with the prior month, using non-seasonally adjusted prices.
This sharp increase in Austrian wholesale prices suggests significant inflationary pressure is building in the supply chain. We see this as a leading indicator for upcoming consumer inflation figures, likely forcing the European Central Bank to reconsider its dovish stance. This is a surprise to a market that, as of late March 2026, was only pricing in a gradual normalization of policy.
We should anticipate that interest rate markets will begin pricing in a higher probability of an ECB rate hike sooner than previously expected. This data follows recent reports showing German producer prices also rose an unexpected 1.2% last month, confirming a broader trend. Therefore, we will look to short German Bund futures, as rising yield expectations should push bond prices lower.
For equity markets, this is a negative signal, as the prospect of higher interest rates threatens corporate profit margins and economic growth. We are looking at buying put options on the Euro Stoxx 50 index. Volatility, as measured by the VSTOXX index, has been hovering near 18, and we expect this news to push it above 20 in the coming sessions.
This development should provide support for the Euro, as interest rate differentials are likely to move in its favor against currencies like the US dollar. We see an opportunity in buying EUR/USD call options with expirations in the next one to two months. The pair has struggled to break above 1.09, but this hawkish data could be the catalyst.
We need to remember the rapid policy shifts we saw during the 2022-2023 period when the ECB was forced to act decisively against surging inflation. That historical precedent shows that once momentum builds, policymakers often have to move more aggressively than the market initially expects. This Austrian number feels like an early warning that history may be repeating itself.
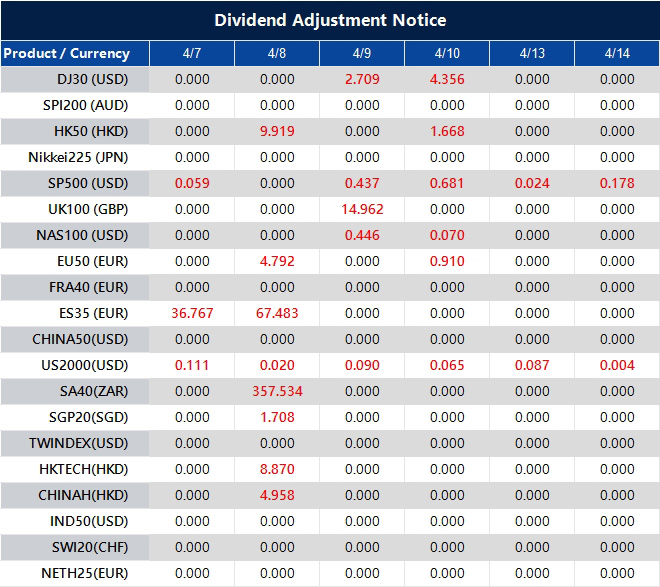
Please note that the dividends of the following products will be adjusted accordingly. Index dividends will be executed separately through a balance statement directly to your trading account, and the comment will be in the following format “Div & Product Name & Net Volume”.
Please refer to the table below for more details:
The above data is for reference only, please refer to the MT4/MT5 software for specific data.
If you’d like more information, please don’t hesitate to contact [email protected].
7 April 2026, Bangkok, Thailand– VT Markets, hosted its premier regional flagship event of the year, the “2026 APAC Gala: Future in Motion.” Held in the heart of Bangkok, the evening served as a prestigious celebration of the strategic partnerships and momentum driving the company’s success and continued expansion across Asia-Pacific.
VT Markets started 2026 with a record $1.5 trillion in January trading volume, and a 246% increase in active users compared to the same quarter last year. Driven by strategic regional support, Thailand’s trading volume tripled, Vietnam’s gross revenue surged 397%, and first-time trades in the Philippines skyrocketed 450% – signalling a decisive shift in regional market share. This follows its 10th anniversary year in 2025 where the firm secured over 30 industry awards, including ‘Best Global Multi-Asset Broker’ and ‘Most Reliable Trading Platform”.
The event also provided a moment of reflection following a meaningful community visit earlier to the Baan Nokkamin Foundation, where VT Markets and its partners delivered essential supplies to support local underprivileged youth and individuals to leave a lasting local impact that extended well beyond the financial markets.
“We titled this gala ‘Future in Motion’ because that is exactly where VT Markets is right now,” said Dandelyn Koh, Head of Global Marketing at VT Markets. “Our growth across APAC is explosive, but we never want to lose sight of our partners who fuel that engine. Whether we are donating essentials to the community or unveiling next-gen infrastructure, we are moving forward together, and this is just the beginning for us”.
The evening’s highlights included:
The Awards Excellence Ceremony: Dedicated to recognizing the partnerships and and performance that have made VT Markets a leader in APAC.
The Signature Lucky Draw: The night’s most anticipated segment featured a curated selection of luxury rewards. From flagship tech gadgets to bespoke travel experiences to Newcastle, United Kingdom, the prizes reflect the high-value partnerships VT Markets shares with its top-tier affiliates.
The 2026 Roadmap Reveal: An exclusive first look at the next generation of trading infrastructure where guests were given an exclusive preview of the products and features set to be rolled out progressively.
As VT Markets continues to scale its presence regionally, the 2026 APAC Gala reinforces its position as a forward-thinking broker that prioritises both technological advancement and the long-term success of its global partner community.
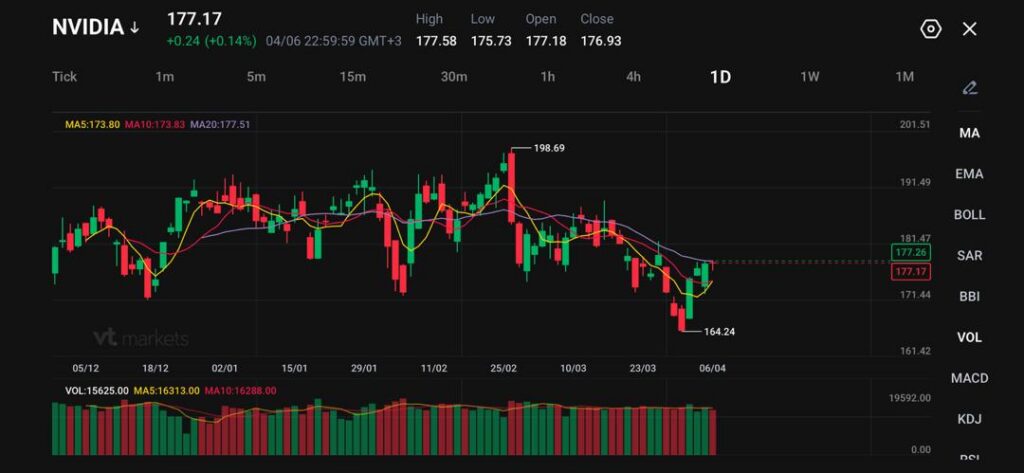
NVIDIA trades at 177.17, up 0.24 (+0.14%), while the wider market heads into earnings season with leadership still concentrated in technology and financials.
S&P 500 profits are forecast to rise 14.4% year on year to just under $609 billion, with Information Technology expected to grow more than 46% to $182.8 billion.
Financial sector earnings are expected to rise 18% to around $98.5 billion, helped by capital markets activity and trading volatility.
The earnings story going into first-quarter reporting still runs through the same two groups that carried much of the market before the war shock. S&P 500 profits are forecast to rise about 14.4% from a year earlier to just under $609 billion, and the largest contribution is still coming from technology.
Information Technology alone is expected to generate $182.8 billion in earnings, up more than 46% from last year and roughly 30% of the full S&P 500 total. When Communication Services is added, that share rises to 40%. Adding Consumer Discretionary pushes it to 47%.
That concentration matters for NVIDIA because it keeps the stock at the centre of the earnings trade even after months of consolidation. Traders were hoping the market would broaden enough to reduce its dependence on mega-cap technology. The forecast says that it has not happened yet. The market still needs tech to deliver.
NVIDIA Still Sits Inside the Main Profit Engine
NVIDIA remains one of the biggest symbols of that setup. The sector backdrop is still strong, and NVIDIA’s own operating momentum has remained well ahead of the index. The company reported quarterly revenue of $68.1 billion, up 73% year on year, while Data Centre revenue reached $62.3 billion, up 75%. Full-year revenue came in at $215.9 billion, up 65%.
For the current quarter, NVIDIA guided to about $78 billion, plus or minus 2%, above the analyst estimate of $72.6 billion at the time.
The issue is no longer whether NVIDIA can grow. The market is asking how much of that growth is already priced in, how durable margins remain, and whether management can keep justifying the scale of AI capex across the ecosystem. That is why commentary matters as much as the headline numbers.
Banks Are the Other Major Leg of the Trade
The other source of earnings support is financials. Sector profits are expected to rise 18% to about $98.5 billion, with deal flow, trading activity, and fundraising all supporting the numbers. Several large transactions and higher volatility in stock and bond markets have improved the near-term revenue backdrop for the big banks.
BlackRock has added to bearish positions on German bonds, betting that a “pretty large inflation uptick” across Europe will push borrowing costs back above the 15-year highs reached last week https://t.co/dAmtNqxKjY
That creates an important read-through for NVIDIA and the rest of the large-cap tech. If banks deliver solid numbers and management teams sound constructive, traders may become more willing to re-enter cyclical growth trades. If financials beat but warn on the broader economy, the market may keep rewarding earnings resilience while still limiting valuation expansion.
War Risk Has Not Broken the Earnings Base
The most constructive part of the setup is that forward earnings estimates have continued moving higher even while the market has pulled back. That combination is rare. It suggests analysts still see companies protecting margins and preserving operating leverage even with oil prices high and sentiment weaker.
Romania is set to leave European Union’s highest interest rates steady as the surge in oil prices will likely fuel inflation that’s already running at close to double digits https://t.co/V2z8P5N5Og
The market has already started to re-rate some of that risk. NVIDIA’s valuation multiple has compressed sharply. A recent market review showed NVIDIA’s price-to-earnings ratio had fallen to its lowest level in about seven years, even as analysts still expected NVIDIA’s current fiscal-year earnings growth to run above 70%, compared with about 19% for the S&P 500 overall.
That does not remove risk. It does mean the stock is no longer trading with the same stretched premium it carried at earlier peaks.
Technical Analysis
NVIDIA is trading near 177.17, attempting a modest rebound after the recent decline that saw price fall to the 164.24 low. Price action shows a short-term recovery forming, with buyers stepping in after the sell-off, but the broader structure still reflects weakness following the rejection from the 198.69 high.
The current move higher appears corrective, with price now testing a key near-term resistance zone.
From a technical standpoint, the trend remains neutral to slightly bearish. Price is hovering around the short-term moving averages, with the 5-day (173.80) providing immediate support, while the 10-day (173.83) and 20-day (177.51) are flattening and acting as overhead resistance. This compression suggests the market is in a transition phase, where momentum is stabilising but has yet to confirm a bullish reversal.
Key levels to watch:
Support: 173.80 → 171.40 → 164.20
Resistance: 177.50 → 181.50 → 190.00
The immediate focus is on the 177.50–178.00 zone, which aligns with the 20-day average and recent rejection levels. A sustained break above this area could extend the recovery toward 181.50, where stronger resistance is likely to emerge.
On the downside, 173.80 is acting as near-term support. A break below this level could see price revisit 171.40, with further weakness exposing the 164.20 low.
Overall, NVIDIA is attempting to stabilise after a corrective pullback, but the broader structure still lacks strong bullish confirmation.
Unless price can reclaim and hold above 177.50–181.50, the move higher is likely to remain corrective within a wider consolidation phase.
What Traders Should Watch Next
The next move depends less on whether tech can post strong numbers and more on what management says about the second half. Traders already know technology and banks are driving the first-half earnings story.
They want to hear whether AI demand is still broadening, whether margins can absorb the oil shock, and whether executives think war-related disruption remains temporary.
For NVIDIA specifically, the cleanest path higher needs two things together: steady AI demand and a market willing to reward that demand with a higher multiple again.
If earnings season confirms both, the stock can start pushing through the 177.5 zone and build toward the upper end of the recent range. If guidance turns more cautious, the recovery may stall even if the headline numbers still look strong.
Create a live VT Markets account today to access our platform features, including market insights and educational content.
Trader Questions
Why is Nvidia So Important to This Earnings Season?
Nvidia sits inside the part of the market driving the biggest share of profit growth. Technology is expected to generate $182.8 billion in earnings, up more than 46% from last year, which keeps Nvidia at the centre of the reporting season story.
Why Are Investors Still Focused on Tech and Banks?
Those two groups are carrying most of the earnings growth. S&P 500 profits are forecast to rise 14.4% to just under $609 billion, while financial earnings are expected to rise 18% to about $98.5 billion.
What Does This Mean for Nvidia Stock Specifically?
It means Nvidia still has to deliver more than strong numbers. Investors will also want clear guidance on AI demand, margins, capex durability, and how management sees the second half.
Why Does Guidance Matter More Than the Headline Beat?
The market already expects strong growth from mega-cap tech. The bigger question is whether that growth can stay strong if oil prices remain high, financial conditions stay tight, or corporate spending becomes more selective.
Is Nvidia Still Growing Fast Enough to Justify Attention?
Yes. The latest figures cited in the article showed quarterly revenue at $68.1 billion, up 73% year on year, with data centre revenue at $62.3 billion, up 75%. Full-year revenue reached $215.9 billion, up 65%.
Start trading now – Click here to create your real VT Markets account
Japan’s foreign reserves fell to $1B in March, down from $1410.7B in the previous period.
The data points to a sharp drop in the country’s total reserve holdings over the month.
Yen Defense Breaks Down
This unprecedented drop shows Japan has exhausted its firepower to defend the Yen. With the Bank of Japan unable to intervene in currency markets, we see the Yen’s collapse as nearly certain. In the past week, the USD/JPY has already breached 280, a level previously thought unimaginable.
Traders should anticipate extreme volatility across all Japanese assets. The Nikkei 225 has fallen over 15% since this data was hinted at, and we expect implied volatility to remain at historic highs. Buying straddles or strangles on the Nikkei index is a direct way to trade this chaos.
The Bank of Japan’s only remaining tool is a massive, emergency interest rate hike to stabilize the currency. This would crush Japanese Government Bond (JGB) prices, and we’ve already seen the 10-year JGB yield spike above 2.5% for the first time in decades. We believe shorting JGB futures is a clear path forward.
Looking back, we saw the pressure building throughout 2025 as the Bank of Japan’s smaller interventions failed to halt the Yen’s slide against a strong dollar. Those actions were merely a temporary fix for a much larger structural problem. This depletion of reserves is the final, logical outcome of that losing battle.
Global Contagion Risk
This is no longer just a Japanese issue; it is a global one. A crisis of this magnitude will trigger a flight to safety, but also raises questions about Japan’s massive holdings of U.S. debt. We are hedging against contagion by buying put options on major global indices like the S&P 500.
Create your live VT Markets account and start trading now.
Start trading now – Click here to create your real VT Markets account