Back

Week Ahead: Peace or Hike?

Key Points

  • Crude remains the lead signal, Brent trades near $107 and WTI near $112 after an 11% weekly surge.
  • Tuesday 8pm ET Iran peace talks set the first directional move across USOil, USDX, SP500, XAUUSD and BTCUSD.
  • US Core PCE on Thursday and US CPI on Friday decide whether inflation fears harden into tighter rates pricing.
  • March NFP beat expectations at 178,000 versus 65,000, but revisions and household data still signal an uneven trend.

Markets are not treating this as a one-day headline spike. Traders keep pricing the Strait of Hormuz as the transmission channel for the entire macro story. Partial vessel passage does not equal a stable reopening of commercial energy flows, so the risk premium stays embedded in crude.

The clearest consequence shows up in the oil tape. Brent trades near $107 heading into the week, while WTI settled near $112 after a holiday-shortened week that delivered a gain of a little under 11%. The directional bias stays upward on any escalation headline, with the strike pause set to expire Tuesday evening ET and no ceasefire framework in place.

When oil stays elevated, traders stop reading the conflict as a standalone geopolitical story. The market begins to price second-order effects, higher transport costs, stickier inflation prints, and less room for policy relief.

Trump has made the timing harder for markets to dismiss. His latest comments tied the next phase of the conflict directly to the Strait of Hormuz, with a Tuesday evening deadline and the threat of fresh strikes on Iranian infrastructure if passage is not restored.

At the same time, he kept the door open to a deal. That mix of pressure and conditional diplomacy helps explain why traders are reluctant to fade the oil premium too quickly. Every hint of negotiation offers temporary relief, but each harder line pulls crude, the dollar and broader risk sentiment back toward defence.

That also sharpens the sequence for the rest of the week. The focus is no longer just the war in broad terms, but whether the Strait itself becomes the trigger for the next move. If the rhetoric cools and diplomacy gains traction, crude can unwind and risk assets can stabilise.

If the deadline passes with the same aggressive tone, the market is more likely to treat elevated oil as a lasting inflation problem rather than a short-lived geopolitical spike. That keeps pressure on equities, supports USDX, and gives Core PCE and CPI even more weight than usual.

A Jobs Beat That Calms Growth Fear, but Tightens the Policy Setup

March nonfarm payrolls printed at 178,000 versus a 65,000 median expectation. January was revised up to 160,000, while February was revised down to negative 133,000. The headline looks strong, but the internal picture looks mixed. Combined revisions read uneven rather than accelerating.

Household data adds friction. The labour force fell, and total employment declined, while unemployment dipped slightly. Wage growth continued, but slowed, and the average workweek slipped, a pattern often seen before layoffs rise.

This setup shifts the macro balance. Payroll growth remains positive, and unemployment remains low, so the imminent labour-driven recession risk falls. At the same time, an energy shock raises inflation risk and complicates any near-term easing narrative.

Tuesday’s 8 pm ET Deadline is the First Gate for Risk

Tuesday’s Iran peace talks at 8pm ET act as the first event that can reset the week’s tone. Four broad paths sit in front of markets:

  • De-escalation and improved Hormuz signals can drive crude sharply lower and lift equity futures.
  • A status quo open allows a brief relief bid off the NFP headline, while energy stays elevated.
  • Escalation into the deadline can push crude higher again and pressure risk assets, particularly rate-sensitive and consumer areas.
  • A nervous, weaker open can develop even without new escalation as traders fade risk into the deadline.

This week does not begin with CPI. It begins with whether the oil premium expands or contracts.

Read more about Trump and how his statements have been affecting market movements here.

Core PCE and CPI Decide Whether the Oil Shock Spreads

Thursday brings US Core PCE Price Index m/m at 0.4% forecast versus 0.4% previous, alongside final GDP q/q at 0.7% forecast versus 0.7% previous. Friday follows with US CPI y/y at 3.4% forecast versus 2.4% previous.

Inflation data sits in a different context when crude stays bid. A firm print can harden rates pricing and keep the dollar supported. A softer print can open the door for risk assets to stabilise, but that relief tends to fade if oil remains elevated.

Cross-Asset Read Heading Into the Week

The dollar stays the cleanest read on defensive positioning when the market prices conflict risk and higher-for-longer policy bias. Gold stays pulled between safe-haven demand and a firmer dollar backdrop. Equities attempt to rebound, but oil and inflation risk keep pressure on the follow-through. Crypto behaves like risk, with the next impulse tied to whether the week opens with relief or stress.

Key Symbols to Watch

USDX | USOil | XAUUSD | SP500 | BTCUSD

Key Events of the Week

DateCurrencyEventForecastPreviousAnalyst Remarks
07 AprUSDResult of Iran Peace Talks (8pm EST)N/AN/AOil reaction sets the week’s tone for USDX and risk.
08 AprNZDOfficial Cash Rate2.25%2.25%Watch guidance for NZD volatility, not the hold itself.
09 AprUSDCore PCE Price Index m/m0.40%0.40%A firm print supports USDX and keeps rates sticky.
09 AprUSDFinal GDP q/q0.70%0.70%Confirms the growth pulse entering the oil shock.
10 AprUSDCPI y/y3.40%2.40%Hot CPI can harden the higher-for-longer tone quickly.

For a full view of upcoming economic events, check out VT Markets’ Economic Calendar.

Key Movements Of The Week

USDX

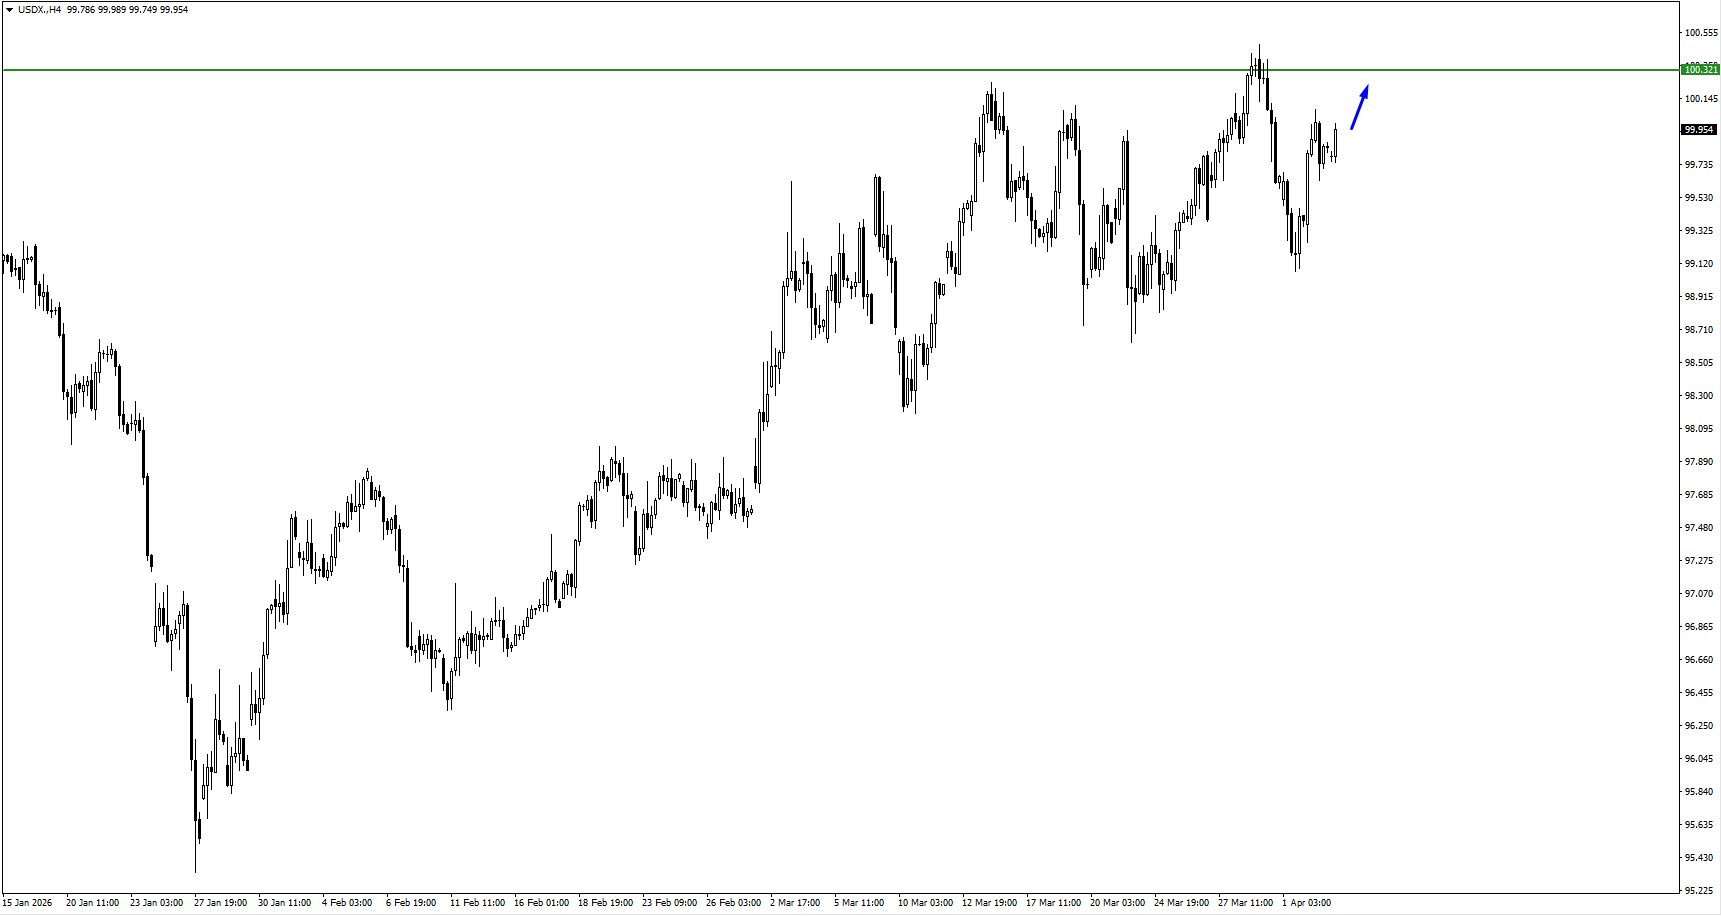
  • Price holds firm as traders price the Tuesday 8pm EST deadline into rates expectations.
  • Thursday’s Core PCE is the first inflation checkpoint before CPI resets the week.
  • A calmer oil tape after peace talks would be the clearest way to soften the bid.
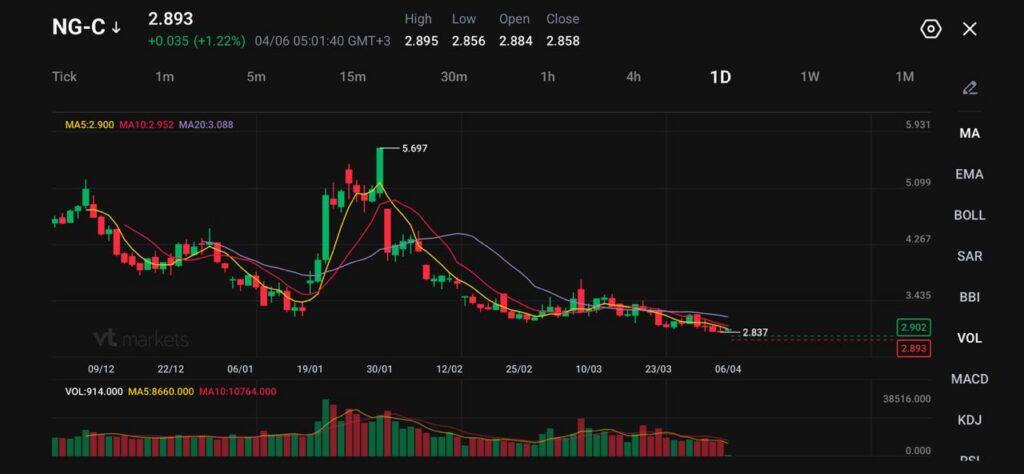
USOil

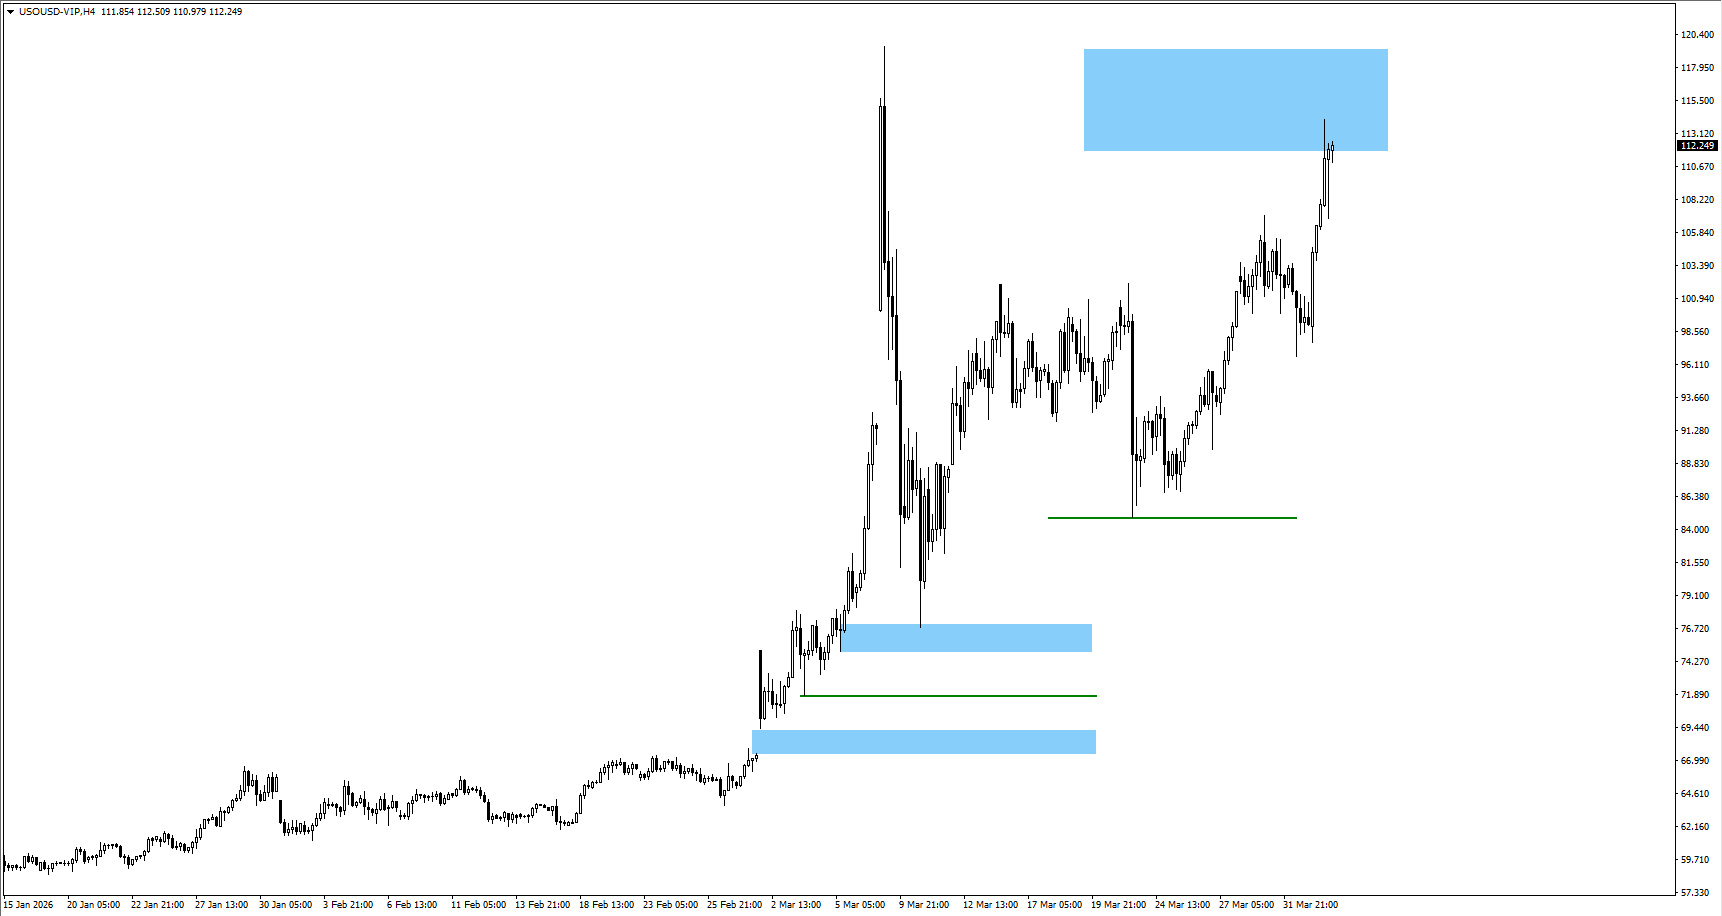
  • Price stays elevated with supply fears tied to Hormuz and the Tuesday deadline.
  • A de-escalation headline can trigger a fast retracement, but it needs follow-through.
  • If crude holds above $110 into CPI, inflation risk stays live across assets.

XAUUSD

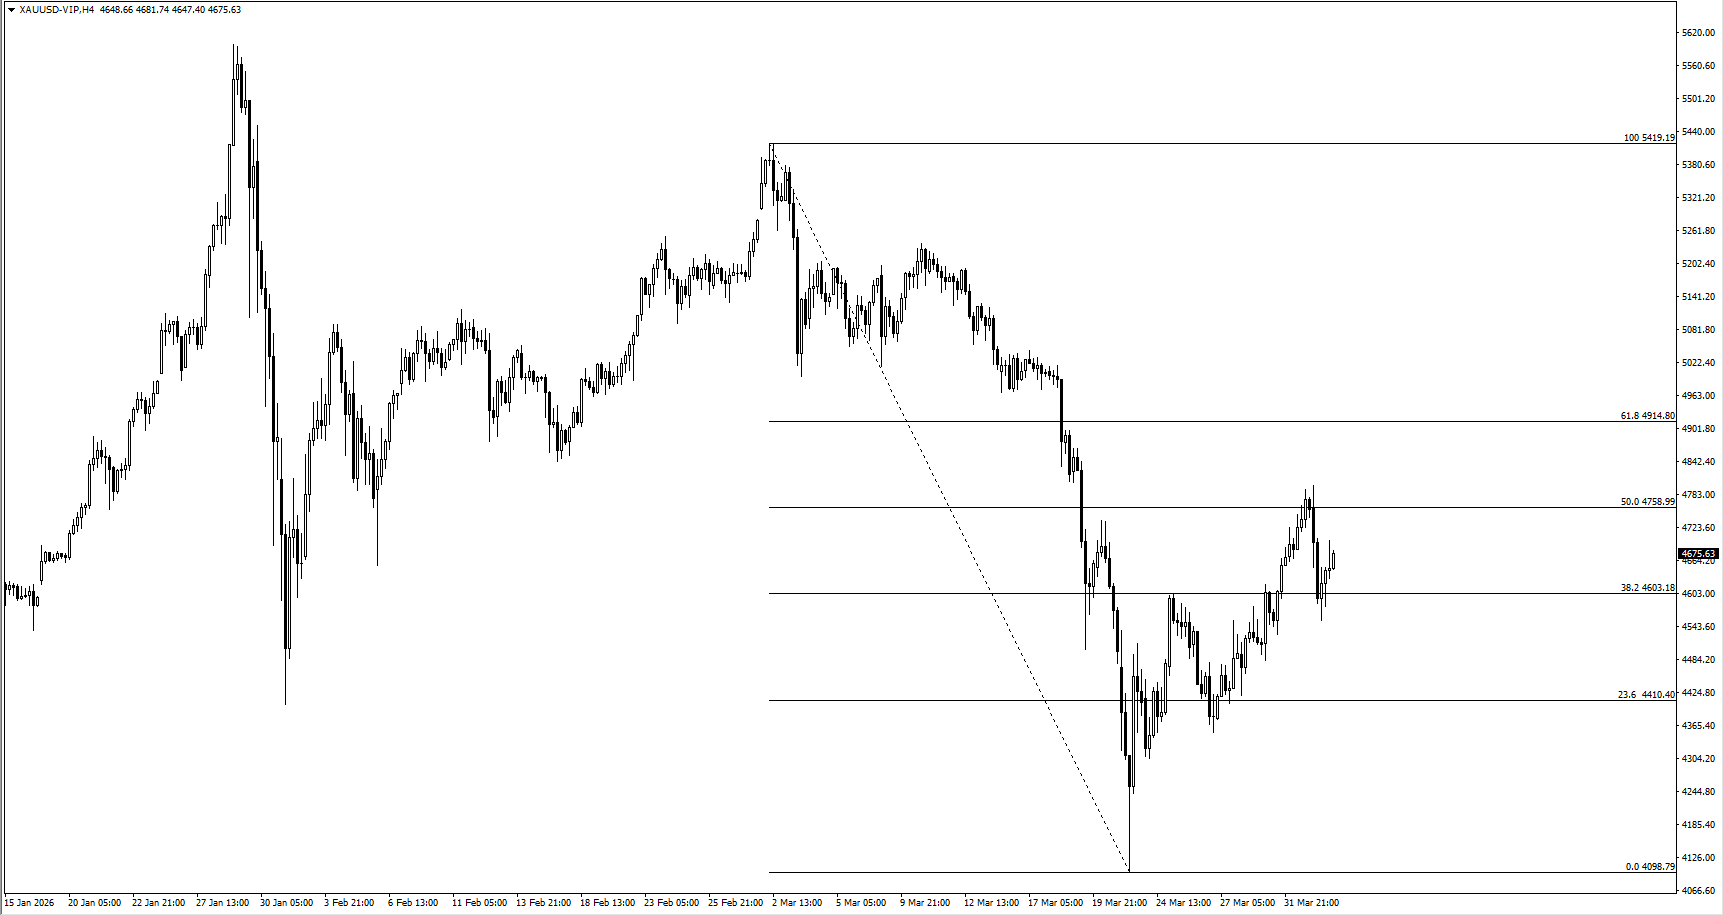
  • Gold softened as USD strength and yields reduced rate-cut hopes.
  • Tuesday headlines matter because oil drives the inflation hedge impulse.
  • CPI can quickly change demand if it validates broader inflation pressure.

BTCUSD

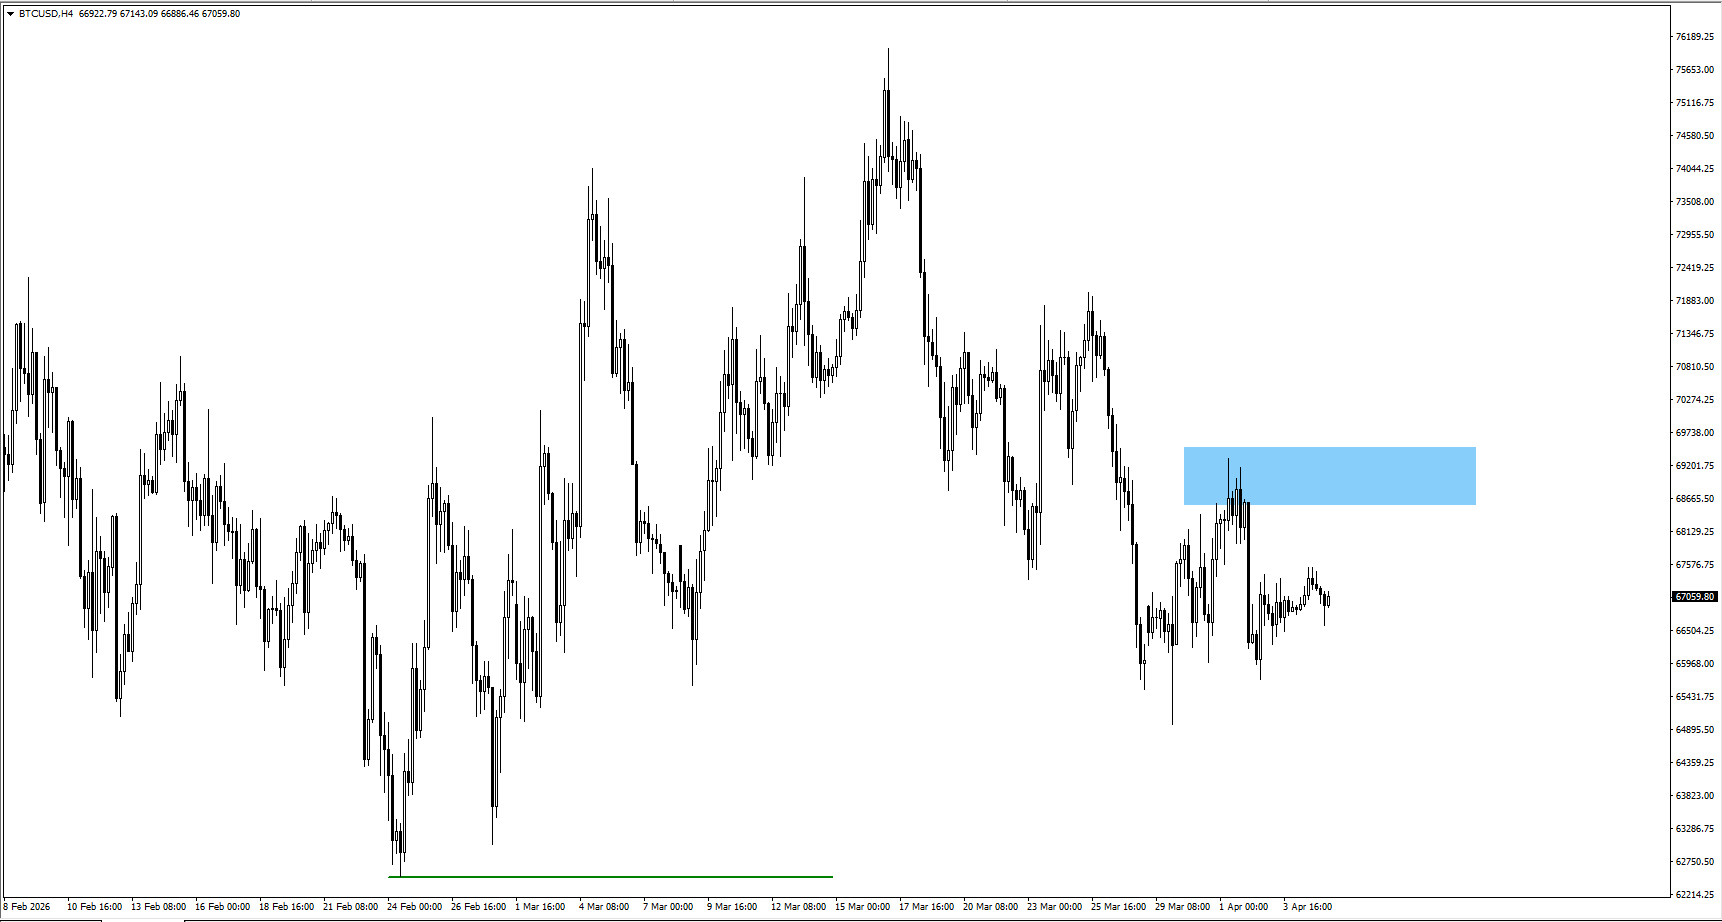
  • BTCUSD remains headline-sensitive as macro risk swings liquidity appetite.
  • A softer inflation tone after CPI would be a tailwind if oil also eases.
  • A renewed oil spike tends to tighten conditions and pressure risk exposure.

SP500

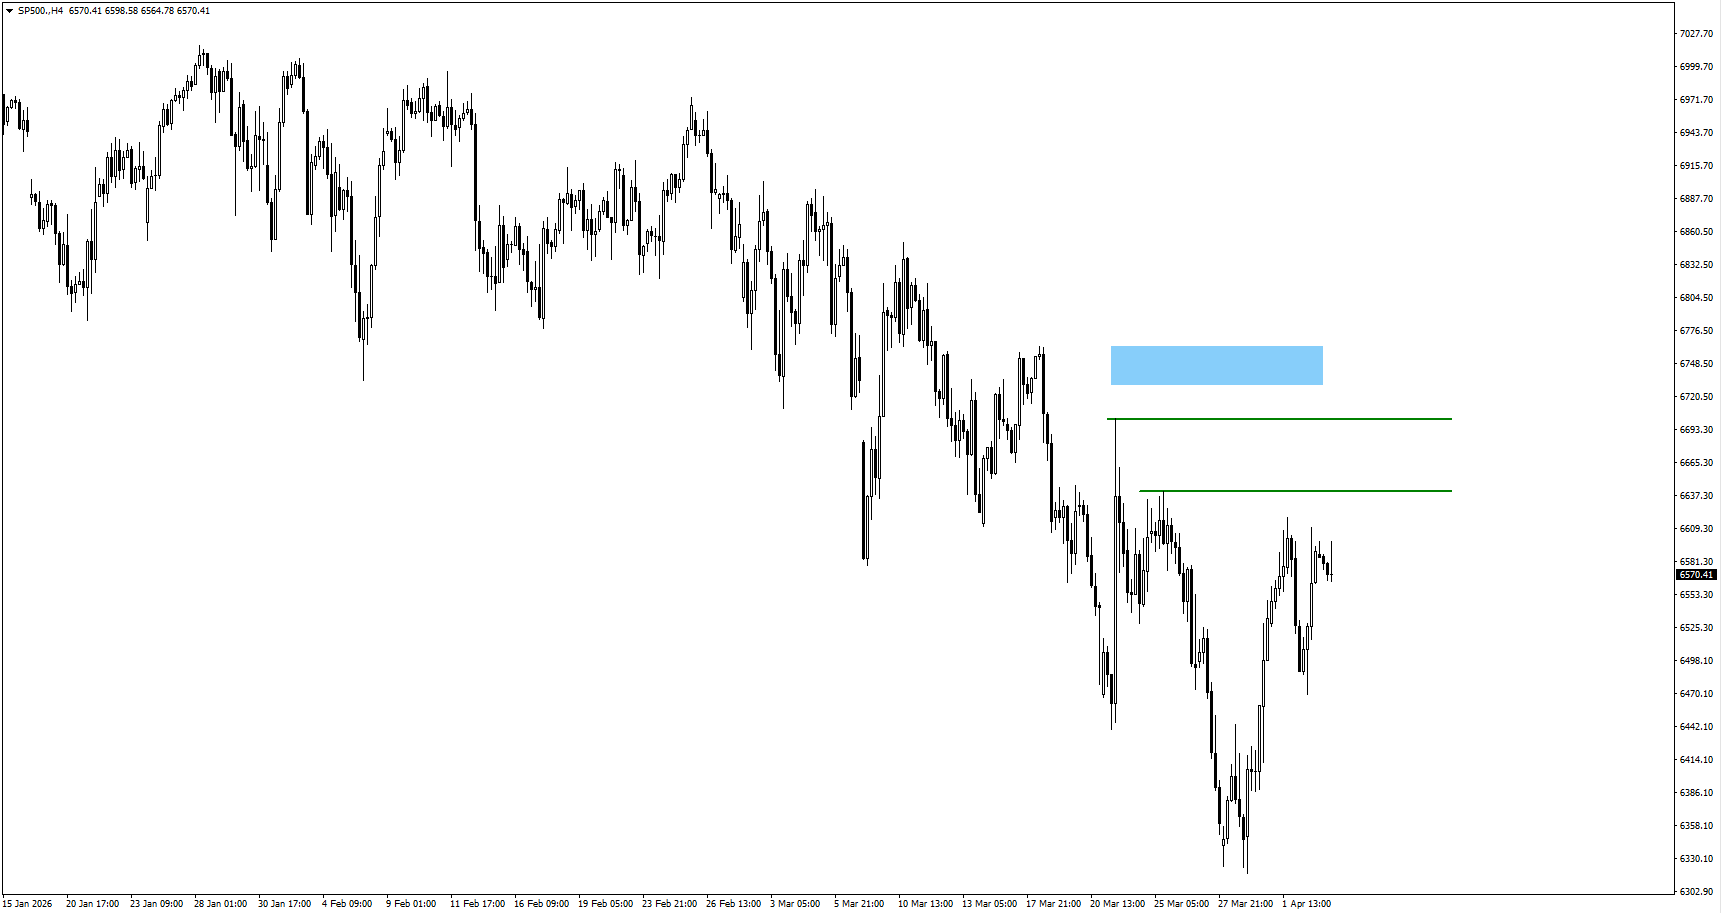
  • Rebound attempts face a simple ceiling while crude stays high and CPI looms.
  • A relief path starts with oil cooling after Tuesday’s peace talk outcome.
  • Hot CPI can revive the higher-for-longer trade and cap equity follow-through.

Bottom Line

This week still runs through the same sequence: oil first, then inflation, then rates. Tuesday’s 8pm EST Iran peace talks are the first real trigger because they can unwind or extend the crude risk premium that is driving the broader cross-asset tone.

If oil stays elevated into Thursday’s Core PCE and Friday’s CPI, markets will find it harder to price a clean easing path, which keeps USDX supported and caps confidence in SP500 and higher-beta risk.

If headlines cool and inflation data comes in calmer than feared, the market gets room to pivot toward relief, but the burden of proof sits with crude and the inflation prints.

Create a live VT Markets account today to access our platform features, including market insights and educational content.

Trader Questions

What Is The Market Actually Pricing Around The Iran Peace Talks?

Markets are pricing the risk premium in crude first. If the talks reduce supply anxiety, USOil can retrace and SP500 can breathe. If they fail, elevated oil keeps inflation expectations firm and supports USDX.

Why Do Core PCE And CPI Matter More When Oil Is High?

Higher oil feeds headline inflation quickly and can spill into inflation expectations. Core PCE helps show whether underlying price pressure is cooling or staying sticky. If both Core PCE and CPI run firm, traders tend to push back rate-cut bets and keep the dollar bid.

How Can Traders Read The Cross-Asset Signal Without Overthinking It?

Start with USOil, then check USDX, then SP500. If oil stays high and USDX stays firm, conditions are still defensive and risk rallies struggle to follow through. If oil cools and USDX softens, SP500 and BTCUSD usually get cleaner upside air.

What Are The Key Levels Traders Usually Watch This Week?

Traders will keep an eye on whether BTCUSD can accept above 71,000, whether USDX can hold around the 100 area, and whether USOil can stay supported near 112. XAUUSD tends to react most sharply after CPI when the market reprices inflation and rates.

Start trading now – Click here to create your real VT Markets account

Natural Gas Stays Weak Despite Iran Risk

Key Points

  • US natural gas futures are around $2.84 per MMBtu, still close to their lowest level since August 2025.
  • The EIA reported a 36 Bcf injection for the week ending March 27, versus a five-year average 4 Bcf withdrawal for the same week.
  • Middle East tension is lifting oil and LNG risk, but US gas remains cushioned because domestic fundamentals stay loose and export terminals are already running near capacity.

US natural gas is trying to bounce, but the broader tone remains soft. NG-C trades at 2.893, up 0.035 or 1.22%, while broader pricing sits around $2.84 to $2.89 per MMBtu. Even with the small uptick, futures are still sitting close to the weakest levels since August 2025.

Spring weather is doing most of the work. Mild temperatures are cutting heating demand just as the market shifts from winter withdrawals into refill season. That soft demand backdrop is strong enough to overpower a large part of the geopolitical premium.

A cautious near-term view still favours a heavy market unless weather turns hotter or supply tightens more clearly.

Storage Data Keeps Balance Loose

The latest storage report reinforced the bearish setup. Working gas in storage rose by 36 Bcf in the week ending March 27, taking inventories to 1,865 Bcf. For the same week, the five-year average shows a 4 Bcf withdrawal.

That contrast is the key point. At this stage of the calendar, the market would usually still be drawing gas from storage. Instead, inventories are already building. That tells traders supply is outrunning current demand by a wide enough margin to keep pressure on prices.

That is why natural gas has struggled to rally even while broader energy markets remain tense.

Iran Risk Matters Less for Henry Hub Than for Oil

The geopolitical threat is still real. Trump warned that the US could strike Iranian infrastructure if the Strait of Hormuz is not reopened, and that has kept oil and global LNG markets on edge.

Henry Hub reacts differently. Oil is directly exposed to Hormuz. US natural gas is much less exposed because domestic production remains abundant and LNG export terminals are already operating near practical limits.

A global gas shock can lift sentiment, but it does not automatically create room for materially higher US exports when the export system is already close to full.

That caps the international spillover into US gas pricing.

A cautious forecast still allows for short-lived spikes on war headlines, but the market needs a domestic tightening signal before it can hold them.

Export Constraints Are Limiting the Upside Response

The export ceiling is what keeps the market grounded. A disrupted Hormuz route threatens a large share of global crude, products, and LNG flows, which supports international gas prices. US natural gas still cannot fully capture that upside when liquefaction capacity is already near max.

Without a meaningful new export outlet, extra overseas demand does not translate into the same kind of runaway move seen in crude. Domestic balances still matter more than foreign panic.

That leaves US gas in a different category from oil. Oil is trading on the shipping shock directly. Natural gas is trading with weather, storage, and export bottlenecks first, then adding a modest geopolitical premium on top.

Technical Analysis

Natural gas (NG) is trading near 2.89, hovering just above recent lows as the market continues to struggle for direction following its sharp decline from the 5.69 peak earlier in the year. Price action remains subdued, with the latest candles reflecting weak rebounds and a lack of sustained buying interest.

The recent low around 2.83–2.84 is holding for now, but the broader structure still shows a series of lower highs and lower lows, keeping pressure on the downside.

From a technical standpoint, the trend remains bearish. Price is trading below all key moving averages, with the 5-day (2.90) and 10-day (2.95) acting as immediate resistance, while the 20-day (3.08) continues to slope downward, reinforcing the underlying weakness. The compression of price near recent lows suggests consolidation, but without a clear reversal signal, this appears more like a pause within a broader downtrend.

Key levels to watch:

  • Support: 2.84 → 2.80 → 2.70
  • Resistance: 2.95 → 3.10 → 3.40

In the near term, price is consolidating just above 2.84, a level that has provided recent support. A break below this zone could trigger another leg lower toward 2.80 and potentially 2.70 if selling accelerates.

On the upside, 2.95 is the first level to reclaim. A move above this could lead to a short-term recovery toward 3.10, though any upside is likely to remain corrective unless price breaks and holds above the 3.40 region.

Overall, natural gas remains under sustained bearish pressure, with weak rallies and persistent selling defining the structure. Unless buyers can reclaim key resistance levels, the bias stays tilted to the downside, with consolidation near current levels likely preceding the next directional move.

What Traders Should Watch Next

The next move depends more on domestic balance than on foreign headlines. Weather comes first, then the next EIA storage report, then any change in LNG feedgas flows.

If injections keep running this far above normal, the market can stay pinned near the lows even with oil and global LNG under pressure. If hotter forecasts arrive or output slips enough to tighten balances, natural gas can recover from the $2.84 to $2.89 area. If mild weather persists and storage continues to build early, the market may remain trapped near the recent floor at around 2.837.

Learn more about trading Energies on VT Markets here.

Trader FAQs

Why is US Natural Gas Weak Even With Iran Risk in the Background?

US natural gas is trading more off domestic fundamentals than Middle East headlines. Mild weather has reduced heating demand, storage is building early, and LNG export capacity is already near full use. That combination has limited the risk premium.

What is the Main Reason Prices Are Near Their Lowest Since August 2025?

The biggest reason is loose supply-demand balance. The market is moving out of winter with weak weather demand, while inventories are already rising instead of falling.

What Did the Latest Storage Report Show?

The latest EIA data showed a 36 Bcf injection for the week ending March 27, compared with a five-year average 4 Bcf withdrawal for the same period. That is a much looser result than normal for this time of year.

Why Does a 36 Bcf Injection Matter So Much?

It shows supply is comfortably outpacing demand. At this stage of the calendar, traders would usually expect storage to still be drawing down or at least building more slowly.

Why is Natural Gas Not Rallying Like Oil?

Oil is directly exposed to Hormuz disruption. US natural gas is less exposed because domestic production is strong and LNG export terminals are already operating near maximum capacity. Global gas stress helps sentiment, but it does not translate into unlimited extra US demand.

Start trading now – Click here to create your real VT Markets account

Intel’s Ireland Fab Deal Reshapes the Recovery Narrative

Key takeaways

  • Intel is buying back Apollo’s 49% stake in Fab 34 for $14.2 billion, restoring full ownership of the Ireland facility.
  • Intel shares jumped more than 9% after the announcement, showing how strongly the market responded to the deal.
  • Fab 34 is a strategic site tied to Intel 4 and Intel 3 production, including Core Ultra and Xeon processors.
  • Intel’s latest reported quarter showed $13.7 billion in Q4 2025 revenue, down 4% year over year, with adjusted EPS of $0.15.
  • Intel will report Q1 2026 earnings on April 23, 2026, which may become the next major catalyst for the stock.

Intel is back in focus after announcing a $14.2 billion deal to repurchase Apollo’s 49% stake in Fab 34, its advanced manufacturing joint venture in Ireland.

The news sent Intel shares up more than 9%, but the bigger story is the change in perception around the company. Instead of focusing only on Intel’s past struggles, investors are beginning to ask whether this marks a more credible phase in its recovery.

That shift matters because Intel is no longer being judged only as a legacy chipmaker tied to PCs and servers. The market is increasingly focused on whether the company can rebuild its manufacturing edge, support its foundry ambitions, and compete more effectively in a semiconductor industry being reshaped by AI demand. In that discussion, Fab 34 now sits near the centre of Intel’s turnaround narrative.

Intel’s Strategic Position in a Changing Semiconductor Market

Intel remains one of the most established names in the global semiconductor industry. The company designs and manufactures processors and related technologies used across personal computers, enterprise systems, data centres, and cloud infrastructure.

What makes Intel different from many of its peers is that its story still depends heavily on manufacturing ownership, not just chip design. That is a strength when execution is working, but it also makes Intel more exposed when capital spending is high and returns take time to emerge. This is an inference based on Intel’s business model and how analysts are framing the stock today.

That is also why the Fab 34 repurchase is being treated as more than a routine transaction. For Intel, this is not simply an asset buyback. It is a move that suggests management wants fuller ownership of a site that is increasingly central to the company’s product roadmap and manufacturing credibility.

Reuters noted that the plant produces chips on Intel 4 and Intel 3, while market commentary has framed the buyback as a signal of confidence in Intel’s foundry prospects.

Fab 34 Gives Intel a Stronger Story, but Not a Free Pass

Intel’s decision to repurchase Apollo’s stake matters because it reflects a clear change in posture. In 2024, Apollo’s $11.2 billion investment gave Intel financing flexibility when the company was under heavier pressure and trying to fund a costly manufacturing buildout without weakening its balance sheet further.

The Wall Street Journal reported that the original arrangement helped Intel avoid more expensive funding at a more fragile point in the cycle. By taking the stake back, Intel is signalling that the company is strong enough to own the facility outright again.

Intel CFO David Zinsner said the company is in a stronger financial position now than it was two years ago. Intel also said the deal should help improve profits and strengthen its credit profile by 2027.

This helps explain why the market responded positively. The deal improves Intel’s story in a few ways:

  • It shows more confidence in Intel’s manufacturing business
  • It makes the recovery story easier to understand
  • It shows Intel wants full ownership of an important asset
  • It gives investors a clearer view of Intel’s manufacturing and foundry plans

Furthermore, analysts have taken the deal as a positive signal. UBS analyst Timothy Arcuri, cited by MarketWatch, saw it as a sign of confidence in Intel’s manufacturing plans, while Barron’s said the move helped improve investor sentiment at a time when the broader tech market was still under pressure.

The deal price also matters. Apollo paid $11.2 billion for the stake in 2024, while Intel is now paying $14.2 billion to buy it back. That means Intel is willing to pay a meaningful premium to regain full ownership, which suggests management sees stronger long-term value in the asset today.

Read our analysis on how the AI race is reshaping the broader tech landscape

Why Fab 34 Carries More Weight Than a Typical Factory

The deal carries added weight because of the role Fab 34 plays within Intel’s manufacturing network. Based in Leixlip, Ireland, the facility is one of Intel’s key advanced fabs, producing chips on Intel 4 and Intel 3, including Core Ultra and Xeon processors. It was also the company’s first high-volume site to use EUV lithography for Intel 4.

Its importance goes beyond production capacity alone. Intel’s recovery depends not only on product demand, but also on rebuilding confidence in its manufacturing execution. In that sense, Fab 34 is directly tied to Intel’s broader effort to restore credibility in advanced process technology.

Reuters also noted that Intel is increasing its focus on 18A, which management views as a major part of its comeback strategy. Seen in that light, taking full ownership of Fab 34 suggests Intel wants closer control over the manufacturing foundation behind its next stage of recovery.

A Stronger Narrative, but Not Yet a Proven Turnaround

The bullish interpretation is fairly clear. Intel appears to be moving away from financial defence and toward more assertive strategic control. A company that previously sold part of a key fab to preserve flexibility is now buying it back, which naturally reads as a sign of greater confidence. Barron’s cited Melius Research’s Ben Reitzes, who viewed the move as a strong indicator of Intel’s improving position, especially as investors focus more on AI-driven server demand and infrastructure exposure.

Even so, the operating picture still requires caution. Intel’s latest reported quarter showed Q4 2025 revenue of $13.7 billion, down 4% year over year, while adjusted EPS came in at $0.15. Full-year 2025 revenue was $52.9 billion, flat year over year. Those numbers suggest stabilisation, but they do not yet show a clean return to strong growth.

Source: Intel

What investors still need to see is fairly clear:

  • Better margin improvement
  • Stronger utilisation across manufacturing assets
  • More consistent earnings momentum
  • Clearer evidence that strategic actions are translating into operating progress

In that context, the Fab 34 buyback matters because it has sharpened Intel’s story while also raising expectations. The market may reward the signal in the near term, but sustaining that confidence will depend on whether management can turn greater control into visibly better results.

Competitive Pressure Has Not Disappeared

The excitement around Intel’s stock move should also be kept in perspective. NVIDIA continues to dominate AI mindshare, while AMD remains a highly credible competitor across CPUs and data centres. Intel’s Fab 34 repurchase may strengthen its manufacturing narrative, but it does not by itself close the competitive gap.

This remains partly an analytical view, but it broadly reflects how Intel is being framed in current market coverage, as a company making progress while still trailing the sector’s leading AI names. That broader backdrop was also evident in our recent piece on Big Tech earnings and the AI cycle.

Investors therefore remain cautious. Turnaround stories that depend on heavy capital investment can draw strong buying when sentiment improves, but they can also face quick doubt if results disappoint. Intel is no longer being assessed only on its ability to stabilise. It is now being judged on whether it can regain strategic relevance in a semiconductor market shaped by AI infrastructure, manufacturing execution, and capital discipline.

Explore other stocks shaping the AI and semiconductor landscape on the VT Markets app.

The Next Earnings Report Matters Most

The next major test will be Intel’s first-quarter 2026 earnings report on April 23, 2026. That update is likely to matter more than the initial reaction to the Fab 34 deal, because it will show whether stronger control over key assets is leading to real operating progress.

If the report shows steadier demand, improving profitability, and stronger business traction, the market may treat the buyback as an early sign of a more credible turnaround. If not, the deal may end up being remembered as a bold strategic move that arrived before the numbers were ready to fully support it.

For now, Intel has improved the narrative. The next step is proving that the narrative can hold up under earnings, margins, and execution.

Bottom Line

Intel’s decision to repurchase Apollo’s stake in Fab 34 has strengthened the company’s recovery narrative by restoring full ownership of a strategically important manufacturing asset. The move suggests greater confidence in Intel’s long-term manufacturing plans and offers investors a clearer view of its strategic direction.

At the same time, the transaction does not remove the need for further proof. The market will still be looking for stronger margins, better utilisation, and more consistent operating progress before viewing this as a confirmed turning point in Intel’s recovery.

Create a live VT Markets account today to access our platform features, including market insights and educational content.

Frequently Asked Questions

1. Why did Intel stock go up?

Intel stock went up after the company announced a $14.2 billion deal to buy back Apollo’s 49% stake in Fab 34 in Ireland. Investors viewed the move as a sign of stronger confidence in Intel’s recovery strategy.


2. What is Intel’s Fab 34?

Fab 34 is Intel’s advanced chip manufacturing facility in Leixlip, Ireland. It produces chips based on Intel 4 and Intel 3, including Core Ultra and Xeon processors.


3. Why did Intel buy back Apollo’s stake in Fab 34?

Intel bought back Apollo’s 49% stake to regain full ownership of the fab. The move suggests the company sees more value in owning the facility outright as part of its long-term strategy.


4. Does the Fab 34 buyback mean Intel is recovering?

The buyback strengthens Intel’s recovery story, but it does not prove the turnaround is complete. Investors still want to see better margins, stronger earnings, and clearer operating progress.


5. When is Intel’s next earnings report?

Intel is scheduled to report first-quarter 2026 earnings on April 23, 2026. Investors will be watching that report closely for signs that the company’s recovery is gaining momentum.


6. Is Intel still behind Nvidia and AMD?

Intel remains a major semiconductor company, but it is still widely seen as trailing Nvidia in AI leadership and facing strong competition from AMD in CPUs and data centres. The Fab 34 deal improves Intel’s story, but the company still needs stronger results to narrow that gap.

Start trading now – Click here to create your real VT Markets account

Dividend Adjustment Notice – Apr 03 ,2026

Dear Client,

Please note that the dividends of the following products will be adjusted accordingly. Index dividends will be executed separately through a balance statement directly to your trading account, and the comment will be in the following format “Div & Product Name & Net Volume”.

Please refer to the table below for more details:

Dividend Adjustment Notice

The above data is for reference only, please refer to the MT4/MT5 software for specific data.

If you’d like more information, please don’t hesitate to contact [email protected].

Weekly Dynamic Leverage Schedule Notification  – Apr 03 ,2026

Dear Client,
To ensure fair trading conditions and manage market volatility during major economic announcements, VT Markets will apply temporary leverage adjustments on certain trading products during specific news periods and market opening/closing.
These adjustments are designed to protect clients from abnormal market fluctuations, sudden liquidity changes, and extreme price movements that may occur during high-impact news releases.

1.Products Affected

The temporary leverage adjustment may apply to the following products:
• Forex
• Gold
• Silver
• Oil
• Indices
• Commodities (including XPT and XPD)

2. Adjusted Leverage During News Releases and Market Opening/Closing

During the specified news period, maximum leverage will be adjusted as follows:
Forex: 200
Gold: 200
Silver: 50
Oil: 20
Indices: 50
Commodities: 5

Please note that each product with leverage already below the above will not be affected.

3. News Events That Can Trigger the Adjustment

Leverage adjustments may be applied during major economic announcements including:
• FOMC Interest Rate Decisions
• CPI (Consumer Price Index)
• GDP
• PMI / NMI
• PPI
• Retail Sales
• Non-Farm Payroll (NFP)
• ADP Employment Data
• Crude Oil Inventories

The above data is for reference only. Other significant macroeconomic releases from major economies may also be included.

Please refer to the table below for details of the upcoming events and affected instruments:

All dates and times are stated in GMT+3 (MT4/MT5 server time).

4. Affected Period of News Releases and Market Opening/Closing

Temporary leverage adjustments apply during the following periods:
Economic News Period
• 15 minutes before the announcement
• 5 minutes after the announcement
Market Opening / Closing Period
• 3 hours before the weekly market closing (Friday)
• 30 minutes after market reopening (Monday)
• 30 minutes before daily market closing (Monday – Thursday)

After the above period ends, leverage will automatically return to the original leverage.

5. Important Rules

• The adjustment only affects new positions open during the adjustment period.
• Positions opened before the adjustment period will not be affected.
• Once the adjustment period ends, original leverage will resume automatically.

We strongly encourage clients to take these temporary leverage adjustments into account when planning trading strategies during high-impact economic events.
If you have any questions, please contact our support team: [email protected].

USDJPY Holds as BOJ Doubt Keeps Yen Weak

Key Points

  • USDJPY trades at 159.623, up 0.048 (+0.03%), with price still pressing the upper end of the recent range.
  • Traders price roughly a 70% chance of a BOJ rate increase, which means a hold could jar markets already on edge.
  • Finance Minister Satsuki Katayama warned that speculative activity has increased in both currency and crude oil markets.

The yen is back near the level that keeps Tokyo on alert. USDJPY is trading at 159.623, close to the 160 area that previously triggered intervention fears, while the pair remains well above the January low at 152.095 shown on the chart.

The move reflects a market that still prefers the dollar when energy prices are high and geopolitical risk remains live. Japan imports most of its energy, so a weak yen and firmer oil work in the same direction. They lift import costs, worsen the terms of trade, and keep pressure on households and corporate margins.

The pair is not exploding higher today, but it is sitting close enough to 160 to keep officials, macro funds, and short-term traders focused on the next headline. A cautious near-term view still favours elevated levels unless oil cools or the BOJ gives markets a firmer signal.

BOJ Uncertainty is Driving the Trade

The Bank of Japan remains the main domestic variable. The market expects a meaningful chance of a rate increase at the next meeting, yet uncertainty over guidance is keeping the yen exposed. The BOJ left rates at 0.75% in March while maintaining a tightening bias, and pricing around the next step has stayed live into April.

That leaves USDJPY in an unstable balance. Expected tightening gives the yen some support underneath. A vague hold, or even a cautious hike without strong forward guidance, could still disappoint traders who want a clearer policy path.

Governor Kazuo Ueda has also signalled that exchange-rate moves now feed into inflation more directly than before, because companies are more willing to pass on higher costs.

Oil Keeps Tilting the Balance Against the Yen

Oil is still shaping the currency story. Higher crude prices have increased inflation pressure in Japan while also darkening the growth outlook. That weakens the yen’s usual defensive appeal. In a standard risk-off move, the yen often benefits from haven demand.

In this environment, high oil prices dilute that effect because the same shock is also increasing Japan’s import bill.

That explains why USDJPY can stay elevated even while broader markets worry about conflict. The dollar still has the cleaner relative-growth and energy-security story. A cautious forecast still favours upside pressure in USDJPY if oil stays high and the BOJ remains hesitant.

Tokyo is Raising the Volume on Intervention Warnings

Japanese officials have become more explicit. Finance Minister Satsuki Katayama said speculative activity in both oil futures and currency markets had increased significantly and warned that the government was prepared to respond if disruptions persisted.

Officials have also started describing parts of the yen move as speculative, which is firmer language than Tokyo used at the start of the conflict.

The warning may not reverse the trend by itself, but it can slow momentum and trigger sharp pullbacks if traders become too aggressive above 160. The bar for direct intervention still looks higher than in earlier episodes because this move is tied less to a one-way carry trade and more to oil, geopolitics, and broad dollar demand.

Technical Analysis

USDJPY is trading near 159.62, holding just below recent highs as the pair continues to press against the upper end of its range. Price action reflects steady bullish pressure, with higher lows forming since the February bottom around 152.09, and the market now testing resistance near the 160.00–160.50 zone, where upside has recently stalled.

From a technical standpoint, the trend remains constructive. Price is trading above the key short-term moving averages, with the 5-day (159.28) and 10-day (159.30) tightly clustered around current levels, acting as immediate support.

The 20-day (159.07) is also trending higher, reinforcing the ongoing upward structure, although momentum appears to be slowing slightly as price consolidates near resistance.

Key levels to watch:

  • Support: 159.30 → 159.00 → 157.95
  • Resistance: 160.50 → 161.10 → 162.00

The pair is currently consolidating just below 160.50, a level that has capped recent upside attempts. A clean break above this resistance could open the path toward 161.10, with further upside potential if momentum builds.

On the downside, 159.30 is acting as immediate support. A break below this level could trigger a pullback toward 159.00, though any decline is likely to remain corrective while the broader structure holds above the 157.95 region.

Overall, USDJPY remains in a steady uptrend with controlled pullbacks, reflecting persistent demand for the dollar against the yen.

However, with price hovering near the 160 handle, traders should remain alert to potential volatility or intervention risks, as this zone continues to attract heightened attention.

What Traders Should Watch Next

The next move in USDJPY depends on three things lining up. First, whether oil stays elevated. Second, whether the BOJ signals conviction ahead of the April 27–28 meeting window. Third, whether Tokyo’s warnings remain verbal or turn into action.

If oil remains firm and the BOJ stays vague, the market may test 160.461 again. If the BOJ sharpens its guidance or officials escalate intervention language further, USDJPY may keep moving sideways rather than breaking cleanly higher.

Learn more about trading Forex Pairs on VT Markets here.

Trader Questions

Why is USDJPY Staying So Close to 160?

USDJPY is staying elevated because the market still favours the dollar when oil prices are firm, geopolitical risk is live, and the Bank of Japan has not yet given traders a fully convincing policy signal. Your chart shows USDJPY at 159.623, still close to the recent high at 160.461.

Why Does Higher Oil Weaken the Yen?

Japan imports most of its energy, so higher crude prices raise import costs, worsen the trade balance, and increase inflation pressure without improving domestic growth. That combination usually works against the yen when energy shocks persist.

What Are Markets Expecting From the BOJ Right Now?

Markets are pricing a meaningful chance of another BOJ move, with recent reporting putting the probability in roughly the 60% to 70% range for the next step around the April meeting window. That supports the yen underneath, but it also raises the risk of disappointment if the BOJ holds or gives cautious guidance.

Why Would a BOJ Hold Be Negative for the Yen?

A hold would matter because traders already expect a decent chance of a hike. If the BOJ stays at 0.75% and sounds vague again, the market may treat that as a softer outcome than current pricing assumes, which could push USDJPY back toward the highs.

Why Has Tokyo Started Talking More About Speculation?

Officials are trying to slow one-way positioning before it becomes disorderly. Finance Minister Satsuki Katayama said speculative activity has increased in both FX and crude markets and warned the government is prepared to respond if disruption continues.

Start trading now – Click here to create your real VT Markets account

USDCNH Slips as Hormuz Hopes Lift Yuan

Key Points

  • USDCNH trades at 6.88362, down 0.00544 (-0.08%), while the offshore yuan edges firmer around 6.88 per dollar.
  • China’s composite PMI fell to 51.5 in March from 55.4 in February 2026, with manufacturing at 50.8 versus 52.1 and services at 52.1 versus 56.7.
  • The yuan is set for a weekly gain after four straight weekly losses, helped by hopes that pressure on the Strait of Hormuz may ease.

The offshore yuan edged higher on Friday, with USDCNH at 6.88362, as traders trimmed some of the safe-haven demand that had pushed the dollar higher through the Middle East crisis. The immediate shift came from improving sentiment around the Strait of Hormuz. Iran and Oman may begin monitoring transit through the waterway, which gave markets a reason to ease back from the most defensive positions.

That does not mean the risk has gone away. The market is still treating the Strait as a live threat to energy flows. The move in the yuan reflects a softer dollar tone and a little more confidence that the worst-case supply shock may not deepen straight away.

A cautious path from here still depends on shipping. If the Strait stays open enough to reduce oil panic, USDCNH can keep drifting lower. If the route tightens again, the dollar may regain support quickly.

China’s PMI Data Limits the Upside

The yuan’s gains have run into a softer domestic growth signal. The figures you shared showed China’s composite PMI at 51.5 in March, down from 55.4 in February 2026. The slowdown was broad, with manufacturing at 50.8 versus 52.1 and services at 52.1 versus 56.7.

Weaker domestic demand and slower export momentum have added to the downturn of private-sector and industrial services.

That leaves the currency in a narrow balance. Better sentiment around Hormuz supports the yuan. Softer Chinese activity keeps that support from becoming a stronger trend.

External Diplomacy Is Doing Part Of The Work

The broader backdrop has become more multipolar. India and the Philippines are reportedly negotiating with Tehran on vessel safety, while China and Pakistan are pushing their own diplomatic framework. That matters for the yuan because Beijing is not only exposed to oil prices.

It also has a direct interest in keeping trade lanes functional and freight costs contained.

China is one of the largest importers of oil moving through Hormuz, but it is also better placed than many peers to absorb some disruption through diverse supply sources, large inventories, and state-directed controls.

That gives the yuan some resilience when markets calm, but it does not turn the currency into a clean winner. China can absorb stress better than some importers, yet it still pays a growth cost when energy and logistics stay expensive.

Technical Analysis

USDCNH is trading near 6.8836, holding within a tight consolidation range after a prolonged downtrend from the 7.07 highs.

Price action shows the pair attempting to stabilise following the sharp decline into the 6.82 low, with recent candles reflecting indecision rather than strong directional conviction. The market is now moving sideways, suggesting a pause in bearish momentum as traders assess the next macro driver.

From a technical standpoint, the broader structure still leans bearish. Price remains capped below the key moving averages, with the 5-day (6.8896) and 10-day (6.8956) acting as immediate resistance, while the 20-day (6.8910) continues to flatten, signalling a loss of trend strength but not yet a reversal.

The inability to reclaim and hold above these levels keeps downside pressure intact, even as short-term momentum stabilises.

Key levels to watch:

  • Support: 6.8800 → 6.8260 → 6.8000
  • Resistance: 6.8950 → 6.9200 → 6.9500

In the near term, price is compressing around the 6.88–6.89 zone, with neither buyers nor sellers fully in control. A break below 6.8800 would likely reopen the move toward the 6.82 lows, while a sustained push above 6.8950 could trigger a short-term recovery toward 6.92.

Overall, USDCNH remains in a soft downtrend, but the current consolidation suggests momentum is fading. Traders should watch for a breakout from this narrow range, as it will likely dictate the next directional move.

What Traders Should Watch Next

The next move in USDCNH depends on whether Hormuz relief turns into actual flow stability and whether China’s softer March private PMI becomes a one-month pause or the start of a broader slowdown.

The latest China PMI reporting already showed weaker domestic demand and slower export orders in services, while manufacturing faced sharper input costs and longer delivery times.

A cautious forecast suggests that the exchange rate will remain within a narrow range around current levels. A significant decrease in USDCNH is likely to depend on a combination of calmer oil prices, stronger economic data from China, and a weaker dollar. However, any new disruptions in shipping could quickly push the pair back under upward pressure.

Learn more about trading Forex Pairs on VT Markets here.

Trader Questions

Why is USDCNH falling toward 6.88?

USDCNH eased because sentiment improved around the Strait of Hormuz and traders pulled back some defensive dollar positions. Reuters reported that hopes of monitored transit through the waterway helped support the yuan after four straight weekly losses.

What is supporting the offshore yuan right now?

The yuan is getting support from a softer dollar tone and from hopes that oil-shipping risks may ease. Reuters said the currency was heading for a weekly gain as markets reacted to signs that pressure around Hormuz could moderate.

Why has China’s PMI data limited yuan gains?

China’s March data showed slower momentum. The figures you provided showed the composite PMI at 51.5 versus 55.4 in February, with manufacturing at 50.8 versus 52.1 and services at 52.1 versus 56.7. Reuters also reported weaker private-sector demand and softer export momentum, which capped yuan upside.

Does a PMI above 50 still support the yuan?

Yes, but only partly. Readings above 50 still point to expansion, yet the slowdown from February means growth is losing speed. Currency markets usually reward improving momentum more than simple expansion.

Why does the Strait of Hormuz matter for USDCNH?

China imports a large amount of oil that moves through Hormuz. If the route stays disrupted, energy costs rise, freight costs stay high, and growth pressure builds. Reuters reported that China can absorb some of the shock through inventories and diversified supply, but it still faces a real economic cost.

What is the difference between the private PMI and China’s official PMI?

The private readings in your note softened sharply, while China’s official March data looked firmer. Reuters reported official manufacturing PMI at 50.4 and non-manufacturing PMI at 50.8, which suggests the economy is still expanding even though private surveys point to slower demand and rising cost pressure.

What does the USDCNH chart show right now?

The chart shows USDCNH at 6.88362, below the short-term moving averages at MA5 6.88960, MA10 6.89558, and MA20 6.89099. That keeps the short-term bias slightly softer for the dollar, though the move still looks like a cautious drift rather than a strong breakdown.

Start trading now – Click here to create your real VT Markets account

ORCL Stock: How Oracle Is Positioning Itself in the AI Boom

Key Points:

  • ORCL stock is increasingly being revalued through an AI lens, driven by the growth of its cloud infrastructure business and its positioning within enterprise data environments.
  • Oracle is emerging as an AI infrastructure enabler, not just a legacy software provider.
  • Its cloud platform is benefiting from rising enterprise demand for AI workloads.
  • ORCL offers lower-volatility exposure to the AI theme compared to high-momentum names.

Oracle has long been associated with databases and enterprise software, but that identity is evolving. As artificial intelligence (AI) reshapes how companies operate, the market is beginning to reassess where ORCL fits within this new landscape.

The AI boom is not just about models or chips. It is about the infrastructure that allows those systems to run at scale. This includes compute, storage, and data environments—areas where Oracle is becoming increasingly relevant.

  • AI adoption is driving demand beyond just software.
  • Infrastructure providers are gaining importance alongside chipmakers.
  • Enterprise data is becoming central to how AI is deployed.

This shift is what is quietly bringing ORCL stock back into focus.

From Legacy Software to Cloud Infrastructure

Oracle’s transformation begins with its move away from traditional licensing and toward cloud-based services. Historically, the company generated most of its revenue from database licences and enterprise software contracts. These provided stability, but limited growth.

The pivot to Oracle Cloud Infrastructure (OCI) changes that trajectory.

OCI is designed to support modern workloads, particularly those tied to AI and large-scale data processing. These workloads are far more demanding than traditional enterprise applications, requiring both scale and performance.

  • AI workloads require high compute density and fast data access.
  • Enterprises need secure, scalable environments to run models.
  • Cloud infrastructure turns usage into recurring, scalable revenue.

Oracle has responded by expanding its data centre footprint and investing heavily in performance optimisation. As a result, cloud revenue has become one of the fastest-growing parts of the business, often delivering double-digit growth.

This is not just a business shift. It is a valuation shift. The more Oracle looks like a cloud infrastructure provider, the more it gets compared to growth-driven tech names rather than legacy software firms.

Oracle’s Role in the AI Stack

The AI ecosystem is layered, even if the market often simplifies it.

At a high level, it can be broken into three parts:

  • Hardware layer: Led by companies like NVIDIA, supplying the chips that power AI systems
  • Infrastructure layer: Where Oracle operates, hosting and scaling AI workloads
  • Application layer: Companies like Microsoft are integrating AI into their products

Oracle’s positioning sits in that middle layer, and that is where its advantage lies.

Many enterprises already store critical data in Oracle systems. As AI adoption grows, companies want to run models on that data without migrating everything elsewhere.

  • Data already lives within Oracle environments
  • AI workloads tend to follow where data is stored
  • Infrastructure demand increases as usage scales

This creates a natural pathway for Oracle to capture AI-related demand without needing to dominate the entire cloud market.

How ORCL Compares to Other AI Stocks

Oracle is part of the AI trade, but it behaves differently from the names that typically dominate headlines.

A company like NVIDIA offers direct exposure to chip demand. Its growth is closely tied to how quickly AI infrastructure is being built out, which makes it highly sensitive to expectations and sentiment.

Meanwhile, Microsoft and Amazon combine infrastructure with platform and application layers, giving them broader exposure across the AI value chain.

Oracle may not lead the AI headlines, but it sits within the same infrastructure cycle driving the broader tech rally. Track AI-linked equities, cloud providers, and semiconductor names through CFD Shares on the VT Markets app.

Oracle sits in a narrower but still important position.

  • More enterprise-focused than consumer-facing.
  • More infrastructure-driven than application-led.
  • Less dependent on short-term AI hype cycles.

This gives ORCL a different trading profile. It tends to move with the broader AI theme, but with less extreme volatility.

For traders, that creates a second-order opportunity. ORCL may not lead rallies, but it can benefit from the same structural drivers.

Oracle’s Position in Geopolitics and Sovereign AI

One of the more underappreciated aspects of Oracle’s positioning in the AI race is its deep and long-standing relationship with governments and defence institutions.

While much of the market focuses on commercial AI adoption, a growing share of demand is coming from what is often referred to as sovereign AI. Sovereign AIs are systems developed and deployed at a national level for security, intelligence, and infrastructure resilience.

Oracle is already embedded in this space.

The company has long been a cloud and database provider to the US government and continues to expand its footprint across defence and public-sector contracts. More recently, Oracle has been rolling out dedicated cloud regions and AI-capable infrastructure designed specifically for government and military use.

This includes deployments and partnerships across:

  • The US Department of Defence (DoD).
  • Branches such as the US Air Force and the US Army.
  • Allied defence institutions, including the UK Royal Navy.
  • International government partners, such as Singapore’s defence sector.

These contracts are not just incremental revenue streams. They represent high-trust, long-duration agreements that often involve mission-critical systems. That creates a different type of demand profile compared to commercial cloud usage.

From a market perspective, this matters for two reasons.

First, government and defence contracts tend to be:

  • Longer-term.
  • Less sensitive to economic cycles.
  • Tied to national budgets rather than corporate spending.

Second, sovereign AI is becoming a strategic priority. Countries are increasingly looking to build:

  • Domestic AI capabilities
  • Secure data environments
  • Independent cloud infrastructure

Larry Ellison has been particularly vocal about this shift. He emphasised that AI will require not just software innovation, but secure, large-scale infrastructure capable of handling sensitive data.

This focus on security and sovereign capability sets Oracle apart from some of its competitors, particularly in highly regulated or defence-related use cases.

Unlike newcomers in the AI boom, Oracle has years of state-backed demand. In the commercial AI space, traders will likely see more stable, persistent growth from the company over time.

  • Sovereign AI demand is structural, not cyclical.
  • Defence contracts provide revenue visibility and durability.
  • Government adoption reinforces Oracle’s role in high-trust infrastructure environments.

As geopolitical tensions rise and countries prioritise technological independence, this segment of the market is likely to become increasingly important.

ORCL is just one piece of a much wider AI and cloud ecosystem. Build a broader watchlist of related tech stocks and trade them through CFD Shares on the VT Markets app.

What Oracle’s Earnings Are Really Showing

Oracle’s earnings are increasingly reflecting structural demand rather than cyclical growth.

The key is not just revenue, but where that revenue comes from. In recent quarters, Oracle has reported total revenue growth in the high single digits to low double digits, but the composition of that growth tells a much clearer story. Cloud infrastructure, particularly OCI, has been expanding at a much faster pace than the rest of the business.

  • OCI growth is leading overall performance. Oracle Cloud Infrastructure has been growing at roughly 30%–50% year-on-year, significantly outpacing total company revenue. This highlights how demand for AI-related compute and enterprise cloud workloads is driving the top line.
  • Legacy segments are becoming less dominant. Traditional licensing and on-premise software have grown at a much slower pace, often in the low single digits, meaning their contribution to overall growth is steadily declining.
  • Recurring revenue is increasing visibility. Cloud services and support now account for over 70% of Oracle’s total revenue, giving the company a more predictable and scalable earnings profile compared to its historical model.

At the same time, capital expenditure is rising sharply as Oracle builds out the infrastructure needed to support AI demand.

  • Higher capex signals confidence in long-term demand: Oracle has significantly increased investment into data centres and cloud capacity, with capital expenditure rising into the multi-billion dollar range annually, reflecting strong forward demand for AI workloads.
  • It can also create short-term margin pressure: Despite strong revenue growth, operating margins have faced pressure at times due to higher infrastructure costs, as the company invests ahead of demand.

For traders, this is where interpretation matters. Strong investment is typically viewed as bullish when it is backed by sustained demand, but the market will closely watch whether that capex translates into continued OCI growth and long-term revenue expansion.

The Hidden Driver: Data and Enterprise Lock-In

One of Oracle’s strongest advantages is not always obvious in headlines. It is the concept of data gravity.

Large organisations store critical data within Oracle systems. Moving that data is difficult, expensive, and risky. This creates a form of embedded positioning.

As AI adoption increases, companies need to run models on that data. This creates a natural dynamic:

  • Data remains within existing Oracle systems.
  • AI workloads are built on top of that data.
  • Infrastructure demand grows within the same ecosystem.

This is not driven by hype. It is driven by operational efficiency. And over time, that can be more durable than sentiment-driven narratives.

What Traders Should Watch

For traders, ORCL is less about headlines and more about confirmation of trends.

The first signal is cloud growth. Sustained strength in OCI indicates that AI infrastructure demand is translating into real revenue.

The second is capital allocation. Investment into data centres and infrastructure needs to be matched by long-term usage and contracts.

Beyond that, several indicators can help frame the trade:

  • OCI growth consistency: Confirms whether AI demand is sustaining.
  • Enterprise deal flow: Signals real adoption rather than narrative.
  • Capex vs revenue balance: Shows whether investment is being monetised.
  • Relative performance vs AI leaders: Helps identify rotation or lag effects.

ORCL often follows the broader AI trade, even if it does not lead it.

How ORCL Fits Into a Broader Trading Strategy

ORCL is rarely the headline trade, but that is part of its value.

It offers exposure to the AI theme without relying entirely on high-momentum sentiment. For traders, this can make it a useful complement within a broader portfolio.

  • Can balance higher-volatility AI names
  • Offers exposure to enterprise AI adoption
  • Provides a way to track infrastructure demand trends

It also creates natural links to other tradable assets. Traders watching ORCL often track related names across semiconductors, cloud, and tech indices, building a broader view of how the AI cycle is evolving.

Bottom Line

Oracle is not the loudest name in the AI boom, but it is becoming one of the more important supporting players.

Its role in infrastructure, data, and enterprise systems places it in a position to benefit from long-term AI adoption. For traders, ORCL offers a way to participate in that trend without relying entirely on short-term hype cycles.

Create a live VT Markets account today to access our platform features, including market insights and educational content.

Article Recap

What is ORCL stock?

ORCL stock represents shares of Oracle Corporation, a technology company focused on cloud infrastructure, enterprise software, and database systems.

Is Oracle an AI stock?

Oracle is increasingly viewed as an AI-related stock because its cloud infrastructure supports enterprise AI workloads.

Why is ORCL stock gaining attention?

Growth in Oracle Cloud Infrastructure and rising demand for AI computing are driving renewed interest.

How does Oracle compare to Nvidia or Microsoft?

Oracle focuses on infrastructure and enterprise systems, while Nvidia leads in hardware and Microsoft in software integration.

Is ORCL a high-growth AI stock?

It offers AI exposure, but with a more moderate and stable growth profile compared to leading AI stocks.

Start trading now – Click here to create your real VT Markets account

Dividend Adjustment Notice – Apr 02 ,2026

Dear Client,

Please note that the dividends of the following products will be adjusted accordingly. Index dividends will be executed separately through a balance statement directly to your trading account, and the comment will be in the following format “Div & Product Name & Net Volume”.

Please refer to the table below for more details:

Dividend Adjustment Notice

The above data is for reference only, please refer to the MT4/MT5 software for specific data.

If you’d like more information, please don’t hesitate to contact [email protected].

Italy’s year-on-year, non-seasonally adjusted industrial sales fell to -1%, down from 3.6% previously

Italy’s year-on-year industrial sales, not seasonally adjusted, fell by 1% in January. This was down from 3.6% in the previous period. The latest result shows a move from growth to contraction. It reports a 4.6 percentage point change from the prior reading.

Italian Industrial Sales Signal Downturn

This new data from January showing a 1% year-over-year decline in Italian industrial sales is a significant bearish signal, reversing the positive trend seen at the end of last year. It suggests weakening domestic and external demand, which may pressure Italian equities. We should consider buying put options on the FTSE MIB index, targeting expirations in the next 45 to 60 days to capture a potential downturn. This Italian weakness is not an isolated event, as it follows last week’s German IFO Business Climate index which missed expectations, coming in at 90.2 against a forecast of 91.5. This points to a broader slowdown in the Eurozone’s industrial core. Therefore, bearish positions on the EURO STOXX 50 index, perhaps through selling call spreads, could be a prudent strategy to hedge against wider European market risk. We expect implied volatility to rise from its current lows given this increased economic uncertainty. The VSTOXX, Europe’s main volatility index, is currently trading near 18, but this kind of industrial data could easily push it above 22. Buying VSTOXX call options or volatility futures could provide a profitable hedge against a market correction in the coming weeks. The weakening economic outlook is likely to put downward pressure on the Euro. With the EUR/USD exchange rate already struggling to hold the 1.07 level, this news could be the catalyst for a break lower. We see an opportunity in shorting EUR/USD futures or buying puts on currency ETFs like FXE.

Policy Shift Could Support Bonds

Looking back at the economic recovery of 2025, central bank policy was focused on taming stubborn inflation. Now, expectations are shifting towards potential rate cuts by the European Central Bank later this year to combat this slowdown. This makes long positions in Italian government bond futures (BTPs) attractive, as bond prices would rise if the ECB signals a more dovish stance in its upcoming April meeting. Create your live VT Markets account and start trading now.

Start trading now – Click here to create your real VT Markets account

Back To Top
server

Hello there 👋

How can I help you?

Chat with our team instantly

Live Chat

Start a live conversation through...

  • Telegram
    hold On hold
  • Coming Soon...

Hello there 👋

How can I help you?

telegram

Scan the QR code with your smartphone to start a chat with us, or click here.

Don’t have the Telegram App or Desktop installed? Use Web Telegram instead.

QR code