Italy’s Consumer Price Index (CPI) rose to 1.7% year on year in March. It was 1.5% in the previous reading.
This means the annual rate of consumer price inflation increased by 0.2 percentage points from the prior figure.
Implications For Rates And Bonds
The uptick in Italian inflation to 1.7% is a notable development for us to watch. This data point adds pressure on the European Central Bank to maintain its cautious stance on future interest rate cuts. We’re already seeing Italian 10-year BTP yields climb towards 3.90% on the news, a move that could signal further upward pressure on borrowing costs.
This reading is not an isolated event, as broader Eurozone core inflation has remained stubbornly above the 2% target, holding at 2.4% in the latest figures. The Italian number strengthens the argument that the final stretch of disinflation is proving difficult. This challenges the market’s pricing for a potential rate cut in the second quarter, which now looks less certain.
Looking back at how markets reacted to inflation surprises in 2025, we should anticipate increased volatility in fixed-income markets. We should consider positioning for higher yields by shorting German Bund or Italian BTP futures. The spread between Italian and German debt, a key risk indicator, has already widened by 5 basis points today and could widen further.
For equities, this persistent inflation suggests headwinds for the Italian FTSE MIB index, which has a heavy weighting of financial and utility companies sensitive to interest rates. Buying put options on the index could offer a hedge against a potential market downturn. Implied volatility on these options has already jumped from 15% to 17% this morning, suggesting the market is beginning to price in more risk.
Euro Reaction And Levels To Watch
In the currency market, a more hawkish ECB relative to other central banks is supportive for the Euro. The EUR/USD pair has climbed from 1.0850 to 1.0910 in the hours following the release. We could see a test of the 1.10 resistance level in the coming weeks if subsequent Eurozone data confirms this inflationary stickiness.
Create your live VT Markets account and start trading now.
Start trading now – Click here to create your real VT Markets account
Italy’s EU-harmonised Consumer Price Index (CPI) rose by 1.6% month on month in March. This compares with a 0.5% month-on-month increase in the previous month.
The latest figure shows a faster monthly rise in consumer prices than before. The release uses the EU harmonised method for measuring consumer inflation.
Market Implications For ECB Policy
This Italian inflation figure is a significant jolt to markets that were getting comfortable with the idea of disinflation. The jump to 1.6% month-on-month is far hotter than anticipated and challenges the narrative that price pressures are fully contained. We must now seriously question the European Central Bank’s ability to begin an easing cycle this summer.
The immediate focus should be on short-term interest rate derivatives, as they will reprice the fastest. We see value in selling December 2026 Euribor futures, as the market is still pricing in at least one rate cut by then, a scenario that this data puts in jeopardy. This hawkish surprise comes just as German manufacturing orders showed an unexpected 0.8% rise last month, suggesting underlying economic resilience that could support inflation.
When we look back at the energy price spikes of late 2025, we recall how quickly inflation expectations can become unanchored. That period taught us that initial inflation reports, even from a single country, can signal a broader trend. Historical data from the 2022-2023 inflation wave shows that services inflation, in particular, proved incredibly sticky once it took hold.
Consequently, we should consider paying fixed on 2-year Euro interest rate swaps to hedge against, or profit from, a sustained period of higher-for-longer rates. This move positions us for a repricing of the entire front end of the yield curve. The VSTOXX Index, a measure of Euro Stoxx 50 volatility, has been hovering near a low of 14.5, suggesting complacency and making options strategies relatively cheap.
This environment is negative for equities, which are sensitive to rising discount rates. With the Euro Stoxx 50 trading at a forward price-to-earnings ratio of 15, which is above its five-year average, the index is vulnerable to a correction. We are therefore buying put options on the Euro Stoxx 50 with June expirations as a direct hedge against this risk.
Foreign Exchange Positioning After CPI
In the foreign exchange market, this data could create short-term Euro strength against currencies with a more dovish central bank outlook. Given that U.S. weekly jobless claims ticked up to 225,000 last Thursday, the policy divergence between the ECB and the Fed could widen. We are positioning for this by buying EUR/USD call options.
Create your live VT Markets account and start trading now.
Start trading now – Click here to create your real VT Markets account
Silver (XAG/USD) pulled back from a four-day high in the mid-$73.00s reached on Tuesday. It traded just above $72.00 in early European hours, up 3.0% on the day and rising for a third session.
The near-term setup stays bearish while price remains below the 100-day Simple Moving Average (SMA) near $75. The 100-day SMA is rising but is acting as resistance, as silver moves towards the 200-day Exponential Moving Average (EMA) near $63.
Bearish Momentum Signals
Momentum signals point lower, with the MACD (12, 26, 9) below its signal line and in negative territory, and a weak histogram. The Relative Strength Index (RSI) is 41.83, below 50, indicating ongoing selling pressure rather than oversold conditions.
Support is near $69.00, with the recent low at $67.85 underneath. A break below this zone may open a move towards $63.00, where the 200-day EMA is located.
Resistance is around $75.00, where the 100-day SMA meets a prior breakdown area. A daily close above $75.00 could reduce bearish pressure and leave $80.00 as the next barrier.
The note states the technical analysis was produced with help from an AI tool.
Trading Implications And Key Risks
Given the technical pressure on silver, we should view the current rally toward the mid-$73.00s as a potential selling opportunity. The $75.00 level, where the 100-day moving average sits, represents a formidable ceiling. For derivative traders, this suggests establishing short positions or buying put options on any sign of weakness below this key resistance in the coming days.
This bearish view is supported by the broader economic environment, as the latest US inflation figures for February 2026 came in slightly above expectations at 3.4%. This data makes it less likely the Federal Reserve will rush to cut interest rates, which provides underlying support for the US dollar. A stronger dollar is typically a headwind for silver prices, reinforcing the negative technical signals.
We are also seeing sentiment turn against precious metals, as the most recent Commitment of Traders report shows managed money has been cutting its net long exposure to silver futures. In addition, major silver-backed ETFs have recorded net outflows of over 12 million ounces in the first quarter of 2026, indicating that investment demand is softening. This lack of buying interest from large players makes a sustained rally less probable.
A potential strategy is to target a move down to the initial support area around $69.00. We recall a similar technical pattern in the third quarter of 2025, where a failure at the 100-day SMA led to a quick retest of lower support levels. If the $67.85 low is breached, the primary target becomes the 200-day average near $63.00, which offers a more attractive risk-reward for bearish plays.
The main risk to this outlook is a decisive daily close above the $75.00 resistance zone. Such a move would invalidate the current bearish structure and could force a quick covering of short positions, potentially pushing prices toward the $80.00 barrier. Therefore, any short positions should have a defined stop-loss just above the $75.00 mark to manage this risk effectively.
Create your live VT Markets account and start trading now.
Start trading now – Click here to create your real VT Markets account
New Bank of Japan data indicate underlying inflation is near or above the target and the output gap is positive. With USD/JPY testing 160, the risk of a Bank of Japan rate rise before Standard Chartered’s Q3 baseline has increased.
Standard Chartered says there is still a high hurdle for the Bank of Japan to meet market expectations of two rate hikes in 2026. The bank also notes that market pricing for roughly two Bank of Japan hikes by December stayed stable in March.
Rising Volatility Risks Around Usd Jpy
The analysis points to policy remaining accommodative, using a benchmark rate of 0.75% that is below the estimated neutral rate range. It links this backdrop to bear steepening in the 2Y/10Y Japanese government bond spread since the outbreak of the war, reflecting inflation risks tied to higher fuel costs.
It contrasts this with other developed markets, where 2Y/10Y spreads have mostly bear flattened. That pattern is attributed to policy rate increases being priced back in after the recent oil price shock.
The article states it was produced with the help of an AI tool and reviewed by an editor.
With USD/JPY now testing the 160 level, the risk of a Bank of Japan (BoJ) rate hike coming sooner than our Q3 expectation has grown significantly. We are watching for a potential spike in currency volatility, especially recalling the Ministry of Finance’s interventions back in 2024 when the pair crossed similar thresholds. As of this morning, the pair is trading around 159.85, putting immense pressure on policymakers.
Potential Boj Hike Timeline
The BoJ is falling behind the curve, and recent data supports this view. The latest core inflation reading for February 2026 came in at 2.3%, remaining above the bank’s 2% target, while strong Q4 2025 GDP growth of 0.5% confirms the economy has a positive output gap. With a policy rate of just 0.75%, the current monetary stance is far too loose for these conditions.
For derivative traders, this situation signals an opportunity to position for increased price swings in the coming weeks. We believe buying short-dated USD/JPY options, like one-month straddles, is a sound strategy to capitalize on this building tension. This allows a trader to profit from a large move in either direction, whether from a surprise hike or a decisive break above 160.
The Japanese government bond market is also sending unique signals about lingering inflation risks. We see the 2-year/10-year yield spread continuing to steepen, meaning long-term borrowing costs are rising faster than short-term ones. This is different from other developed markets, where a fear of immediate hikes is causing yield curves to flatten.
Despite the drama at the 160 level, the swaps market has remained stable, pricing in roughly two rate hikes by December 2026. We remember how the BoJ moved very cautiously throughout 2025, which suggests the hurdle to meet even this pricing is high. Any action or inaction that challenges this two-hike consensus will create a significant trading opportunity.
Create your live VT Markets account and start trading now.
Start trading now – Click here to create your real VT Markets account
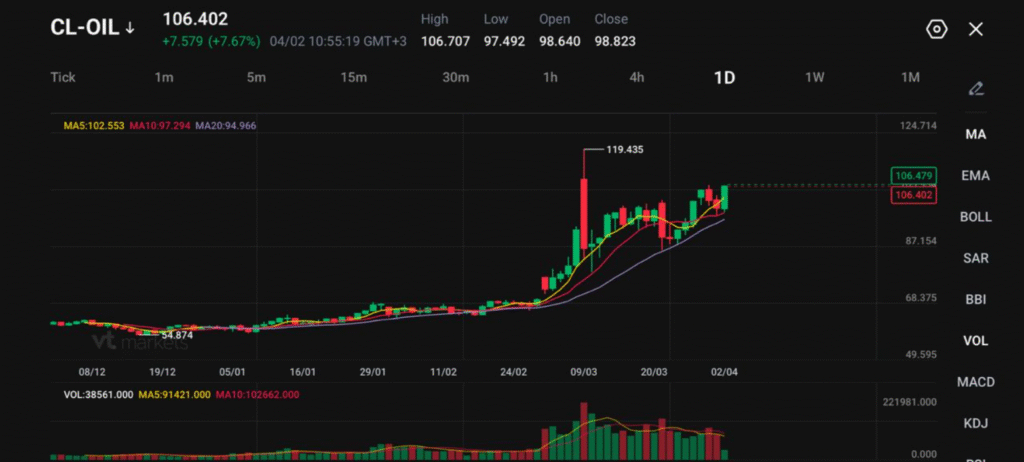
WTI trades at 106.402, up 7.579 or 7.67%, after printing a session high of 106.707.
Trump said the US has enough gas and oil to handle the shock, but Moody’s says higher prices will still hit growth and inflation.
Supply disruption is still driving the market. Brent above $107 after Trump’s Iran speech and said US clean fuel exports rose to a record 3.11 million bpd in March.
Oil is trading like a supply shock is still in force. WTI sits at 106.402, up 7.67%, and the chart shows buyers stepping back in after the latest pullback. The market is not questioning whether the US can produce oil. It is pricing the cost of a global disruption that keeps freight, fuel, and input prices high even when domestic supply is available.
That is why Trump’s claim that the US has plenty of gas and oil has not settled the market. The US is better positioned than major energy importers, but oil is priced globally.
President Trump's threat to bomb Iran back to the Stone Age has sharply raised stakes in a war now in its fifth week and crushed investors' hopes for a swift end to a conflict that is squeezing oil supplies and fanning inflation https://t.co/MUAfGpA4kb
When shipping lanes are impaired and replacement flows stretch across longer routes, businesses and consumers still pay more.
Domestic Supply Does Not Cancel Global Price Pressure
US fuel exports hit a record in March as Europe and Asia rushed to replace the disrupted Middle East supply. Clean petroleum product exports rose to 3.11 million barrels per day, up from 2.5 million bpd in February. Europe took 414,000 bpd, Asia took 224,000 bpd, and Africa took 148,000 bpd.
That supports one part of Trump’s argument. The US does have barrels to sell. It also shows why Moody’s pushback carries weight. Export strength helps global buyers, but it also tightens the domestic balance and keeps prices elevated. US fuel exports became politically sensitive as gasoline moved above $4 per gallon and diesel approached $5.50.
LNG ships have avoided the strait since the conflict broke out on February 28, disrupting about a fifth of the world’s supply of the fuel https://t.co/0l6yYBH3II
The immediate issue is cost, not scarcity. Businesses do not need to run out of fuel for growth to slow. They only need to pay enough more for fuel, freight, chemicals, and transport to cut margins and delay spending.
Inflation Pressure and Slower Growth Can Arrive Together
That is the hard part of this setup. Higher oil pushes inflation up while also dragging on activity. Moody’s Analytics argued that the US is not exposed in the same way as countries that cannot produce oil domestically, but it still cannot avoid the economic damage from disrupted supply chains and higher costs. That is the exact mix that revives stagflation fears.
Economist Nouriel Roubini: Trump is likely to escalate the Iran war — risking '1970s stagflation' https://t.co/dNCUa7G4k3
Brent rose above $107, stocks fell, and the dollar strengthened as investors priced a longer disruption and a tougher inflation path.
That backdrop explains why oil above $106 carries more weight than the reassuring line that the US has enough supply. Domestic output can cushion the blow. It cannot erase the inflation premium while the wider system is still under stress.
Technical Analysis
CL-OIL is trading near 106.40, extending its aggressive upside move after a strong breakout from the consolidation phase around the mid-$90s. Price has surged sharply from the late-February base, with momentum accelerating into the recent spike toward 119.43, before entering a period of controlled consolidation just below current highs.
The latest price action shows buyers stepping back in, with the market attempting to push higher again after holding firm above key short-term levels.
From a technical standpoint, the trend remains firmly bullish. Price is trading well above all major moving averages, with the 5-day (102.55) leading higher and the 10-day (97.29) and 20-day (94.96) trailing beneath, all sloping upward. This alignment reflects strong trend continuation, while the recent consolidation above the $100 handle suggests the market is building a base for a potential next leg higher rather than showing signs of reversal.
Key levels to watch:
Support: 102.50 → 100.00 → 97.30
Resistance: 106.70 → 110.00 → 119.40
The immediate focus is on the 106.50–107.00 zone, which aligns with recent highs. A sustained break above this area could open the path toward 110.00, with further upside potential if momentum builds.
On the downside, 102.50 acts as first support, reinforced by the rising 5-day average. A break below this level would likely trigger a deeper pullback toward 100.00, though such a move would still be considered corrective within the broader uptrend.
Overall, oil remains in a strong uptrend with higher highs and higher lows intact. The current consolidation appears constructive, and unless price slips back below the $100 region, the bias remains tilted to the upside as the market continues to price in supply-side risks and sustained demand.
What Traders Should Watch Next
The next move depends on whether the market sees more real relief in fuel flows or just more confidence talk. Physical trade is adjusting through record US exports and rerouted supply, but prices remain high because the system is still strained.
Watch Brent’s reaction above $107, watch whether US product exports stay near the March record, and watch how quickly fuel costs feed into broader inflation measures. If transport and energy prices keep rising, oil can stay high even without another headline shock.
Learn more about trading Energies on VT Markets here.
Trader Questions
Why Are Oil Prices Still Rising Even Though The US Has Plenty Of Supply?
US supply helps cushion the shock, but oil is priced in a global market. When shipping routes are disrupted and freight costs rise, domestic production does not stop higher global prices from feeding into US fuel and input costs.
What Did Trump Say About The Energy Situation?
Trump said the US has plenty of gas and oil, along with supply from Venezuela, and argued the economy is well prepared to handle the current disruption.
Why Do Analysts Still See Risks For The US Economy?
Higher oil prices still raise transport, logistics, and operating costs for businesses and consumers. That can slow growth even if the US does not face an outright fuel shortage.
How Do Higher Oil Prices Affect Inflation?
Oil feeds into petrol, diesel, shipping, aviation, and manufacturing costs. When those costs rise, broader inflation tends to follow, especially if the move lasts more than a few weeks.
Why Can Growth Slow Even If The US Produces Its Own Oil?
Domestic production reduces vulnerability, but it does not shield the economy from globally higher prices. Companies still pay more for fuel and supply chains still get more expensive.
Start trading now – Click here to create your real VT Markets account
On the evening of 1 April 2026, President Donald Trump addressed the nation from the White House Cross Hall in what was billed as an “important update” on the war in Iran. It was his first formal primetime address since Operation Epic Fury began on 28 February and markets were watching closely for signs of clarity.
Instead, the 20-minute speech left investors with more uncertainty. Trump praised battlefield progress, extended the war’s timeline, threatened to bomb Iran’s power grid, and left the Strait of Hormuz question wide open. Oil jumped nearly 4% within minutes of him leaving the podium.
Key takeaways
Trump’s 1st April speech was his first formal address since Operation Epic Fury began on 28 February
Trump signalled that the US would strike Iran “extremely hard” over the next two to three weeks, lifting Brent crude above $104 and reversing the market’s pre-speech optimism
The Strait of Hormuz remains severely disrupted, placing at risk a corridor that carries roughly one-fifth of global oil supply, with no clear US plan to restore normal shipping conditions
Bank of America economists expect oil to remain near $100 per barrel through the rest of 2026, alongside slower growth and firmer inflation
The War at a Glance: Five Weeks In
The US–Israeli military campaign against Iran has now entered its fifth week. What began as a targeted strike operation focused on Iran’s missile programme, destroying its navy, and eliminating its path to a nuclear weapon has evolved into a broad regional conflict with significant humanitarian, economic, and diplomatic fallout.
The fallout is no longer limited to Iran itself. Attacks on vessels and the growing security risk in the Strait of Hormuz have severely disrupted commercial traffic through one of the world’s most important energy chokepoints. Israeli strikes have extended to Beirut, while Yemen’s Houthi rebels have launched missile attacks on Israel and threatened further escalation. The reported kidnapping of a US journalist in Baghdad has added to concerns that the conflict is spreading well beyond its original theatre.
For the past five weeks, traders and analysts have been trying to make sense of a steady stream of conflicting signals from Washington. Treasury Secretary Scott Bessent said the US would “retake control of the straits.” Trump, by contrast, suggested other nations may need to “fend for themselves.”
He also claimed that Iran’s president had requested a ceasefire, a statement Iran dismissed as “false and baseless.” At other points, Trump threatened to strike Iran’s oil infrastructure, before later saying the US was “not going to have anything to do with” what happens in the strait.
Markets had rallied strongly in the two days before the speech on growing optimism the war might end soon. That rally unwound fast once Trump’s speech content became clear.
As the first formal primetime presidential address of the conflict, the speech carried more weight than a passing remark to reporters. It signalled a deliberate effort to project control and shape both public perception and market expectations.
What Trump Was Trying to Achieve Politically
Polling consistently shows American patience wearing thin. The war has pushed average US petrol prices above $4 per gallon. Bank of America economists forecast slower growth, higher inflation, and oil at $100 per barrel through the rest of 2026. Trump enters midterm-election territory with an increasingly unpopular war on his hands.
The speech’s political architecture was clear:
Restate the four objectives of Operation Epic Fury as achieved or near-achieved — destroying Iran’s missiles, navy, terror-proxy network, and nuclear capability
Compare the conflict’s brevity favourably to past US wars (WW1, WW2, Korea, Vietnam, Iraq)
White House officials later said they were pleased with the address. But the reaction was far from uniform. Former Representative Marjorie Taylor Greene offered a much harsher verdict, saying the speech was all about war and did nothing to address the rising cost of living.
The Mixed Signal Problem — and Why It’s the Real Risk
The speech was supposed to bring clarity. Instead, it added another layer of uncertainty. That leaves markets trying to price not one clear outcome, but several competing ones.
Trump‘s statement that other countries must “fend for themselves” on the Strait of Hormuz is particularly significant. It suggests the US could step back while the Strait of Hormuz remains disrupted. For markets, that would still be a problem because even if US involvement eases, the supply risk would not go away.
How the War Is Already Affecting Fuel, Trade, and Sentiment
Energy
Brent crude reached $104.44 per barrel on 1 April, rising more than 3% on the day of the speech. US crude traded at $102.36. Countries in Asia that rely heavily on Middle Eastern oil could face fuel pressure in the weeks ahead, with Europe also exposed if disruption continues. The supply risk has already become more visible, with reports of a Kuwaiti oil tanker being hit by Iranian drones near Dubai and a QatarEnergy-chartered tanker struck by a missile off Qatar.
Equity markets had rallied in the two days before the speech on hopes that a ceasefire might be close. That mood reversed once Trump confirmed that military action could continue for another two to three weeks. Crude futures jumped more than 5% in after-hours trading, while US stock futures moved lower. A speech that was meant to reassure instead reinforced the market’s view that disruption may last longer than expected.
The honest answer: it has deepened them, at least in the short term. A formal national address naturally raised expectations of clarity. Instead, Trump largely restated positions the market had already heard: progress was claimed, threats were renewed, the timeline was repeated, and the conditions for an exit remained unclear.
Senator Mark Warner said the address “did little to answer the most basic questions the American people deserve when our nation is engaged in a costly and dangerous conflict.” For markets, the central question is not simply whether the war will end, but when it will end and under what conditions the Strait of Hormuz will reopen. On that point, the speech offered little clarity.
The next two to three weeks will be decisive. Markets will be watching for any move against Iran’s electricity infrastructure, the diplomatic track being led by UK Foreign Secretary Yvette Cooper, and any signal that Hormuz traffic is resuming. Until then, volatility is likely to remain the clearest message for investors.
Refresher
1. How did markets react to Trump’s Iran speech?
Markets reacted negatively, with oil prices rising and equities coming under pressure. Investors shifted to a risk-off sentiment due to heightened geopolitical uncertainty and lack of clarity in the speech.
2. Why did oil prices surge after the speech?
Oil prices climbed because traders feared prolonged conflict and potential disruptions to global supply, especially around the Strait of Hormuz. This key shipping route is critical for global energy flows.
3. What made investors uncertain after Trump’s address?
The speech delivered mixed signals—suggesting progress in the war but also indicating continued military action without a clear timeline. This ambiguity left investors unsure about the duration and risks of the conflict.
4. How did the speech impact currency and safe-haven assets?
The US dollar strengthened as investors sought safety, while other risk-sensitive assets faced pressure. In broader market trends, geopolitical tensions typically support safe-haven flows and increase volatility.
5. What role does the Strait of Hormuz play in market reactions?
The Strait of Hormuz is a crucial global oil transit chokepoint. Any threat to its operations raises concerns about supply shortages, which directly impacts oil prices and global inflation expectations.
6. What should traders watch following the speech?
Traders should monitor geopolitical developments, especially any escalation or de-escalation signals, oil price movements, and central bank responses to rising inflation risks. Market volatility is likely to persist until clearer direction emerges.
Start trading now – Click here to create your real VT Markets account
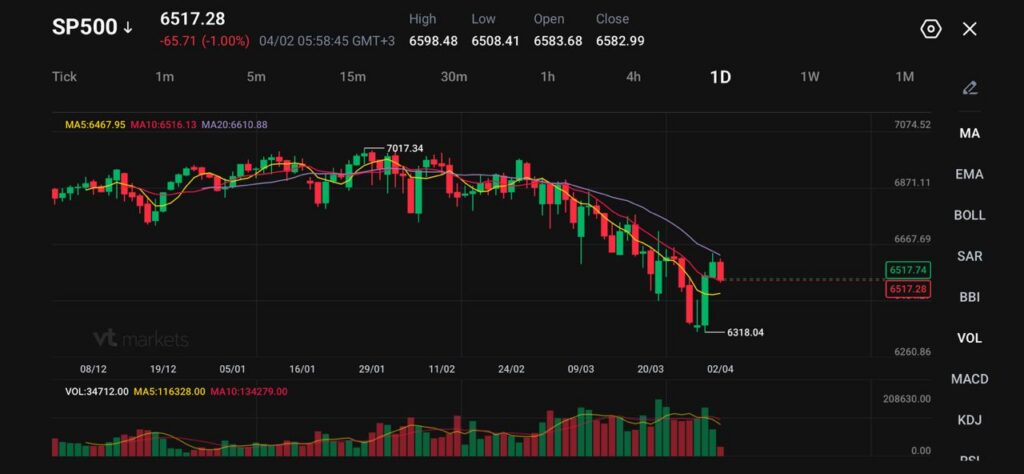
S&P 500 futures fell 1%, while the cash index in your chart trades at 6517.28, down 65.71 (-1.00%).
Brent rose about 5% to $106.16 a barrel after Trump gave no clear signal on when the Strait of Hormuz might reopen.
The US dollar index rose 0.3% to 99.858, while the euro slipped 0.25% to $1.156 as traders moved back into defensive positions.
Markets went back into defence after President Donald Trump said the US would hit Iran “extremely hard” within weeks and did not give traders the timeline they wanted for an end to the conflict.
Stocks fell and the dollar rose as markets stayed jittery after President Donald Trump warned the US would hit Iran “extremely hard” within two to three weeks, disappointing traders who had hoped for clearer signs of an end to the war https://t.co/V4XdV0DXX5
That shift matters for the S&P 500 because the rebound over the prior two sessions had relied on hopes that the war might wind down soon. Trump’s comments removed that support.
Traders started selling equities again because the market is still trying to price two things at once: higher energy costs and weaker growth. That combination is what keeps dragging the discussion back toward stagflation.
Five weeks into a Middle East war that’s sending shockwaves through the global economy, the US stock market has settled into a predictable pattern https://t.co/FkqCOTfglf
The market is no longer asking whether the conflict is serious. It is asking how long the energy disruption lasts and how much economic damage builds while it stays in place.
Oil Above $106 Reopens the Inflation Problem
The sharpest signal came from crude. Reuters reported that the front-month Brent contract rose about 5% to $106.16 per barrel after the speech failed to offer reassurance on the Strait of Hormuz. Our research desk believes the only thing that really matters is whether the Strait reopens soon, and Trump’s remarks did not suggest that would happen quickly.
For equities, that is the problem in one line. Expensive oil lifts inflation, squeezes margins, and cuts into consumer spending power. The S&P 500 can absorb a geopolitical shock for a while if energy stays contained. It struggles much more when crude moves back toward crisis levels and the market cannot see a clear reopening path for a major fuel artery.
That also explains why the earlier optimism faded so fast. A war can continue politically and still leave markets calm if oil routes function. Once supply routes stay impaired, the macro cost rises quickly.
Dollar Strength Tightens Conditions Again
The dollar also turned higher as traders moved back into the usual haven trade. Reuters reported that the dollar index rose 0.3% to 99.858 after falling nearly 1% over the prior two days on ceasefire optimism. The euro weakened 0.25% to $1.156.
Stocks fell and the dollar rose as markets stayed jittery after President Donald Trump warned the US would hit Iran “extremely hard” within two to three weeks, disappointing traders who had hoped for clearer signs of an end to the war https://t.co/V4XdV0DXX5
That adds another layer of pressure to the S&P 500. A firmer dollar tightens financial conditions and weighs on multinational earnings when overseas revenue is translated back into dollars. It also signals that traders are reducing risk rather than preparing to re-enter cyclicals and growth names.
When equities are already under pressure from higher yields and higher energy costs, a stronger dollar usually makes the rebound harder.
Technical Analysis
S&P 500 is trading near 6517, attempting a modest rebound after a sharp decline that pushed price down to the 6318 low. The broader structure remains under pressure following the rejection from the 7017 high, with price still struggling to regain upward momentum. Recent candles show a short-term bounce, but the recovery lacks strength, suggesting the move is more corrective than a true reversal.
From a technical standpoint, the trend remains bearish in the near term. Price is trading below the 10-day (6516) and 20-day (6610) moving averages, which are both sloping downward and acting as overhead resistance. The 5-day (6467) is beginning to turn higher, reflecting the current bounce, but this remains fragile unless price can reclaim higher levels. The broader structure continues to show lower highs and sustained selling pressure.
Key levels to watch:
Support: 6400 → 6318 → 6200
Resistance: 6520 → 6610 → 6700
The index is currently testing the 6515–6520 zone, which aligns closely with the 10-day average and is acting as immediate resistance. A sustained move above this level could open a recovery toward 6610, though stronger resistance is likely to emerge there.
On the downside, 6400 remains the first key support. A break below this level would expose the recent low at 6318, with further downside risk if selling resumes.
Overall, the S&P 500 remains in a short-term downtrend, with the current bounce showing limited conviction. Unless price can reclaim the 6610 area, rallies are likely to face resistance, keeping the bias tilted to the downside while the market works through this corrective phase.
What Traders Should Watch Next
The next move depends on oil, not speeches alone. Brent holding near $106.16, the status of the Strait of Hormuz, and the dollar’s reaction will drive the tone into the next session more than any single earnings or sector story. Both USD and oil should move higher while risk is shed, and that remains the cleanest way to frame the market right now.
A cautious path from here is clear. If crude stays high and the dollar keeps firming, the S&P 500 may struggle to recover more than a short relief bounce.
If oil falls back and the market sees real progress on shipping routes, the index can start rebuilding from the 6517 area toward resistance near 6610.
Why Did the S&P 500 Drop Again After Two Better Sessions?
The market had been hoping for a clearer end to the Iran conflict, but Trump’s speech offered no firm timeline and repeated threats to hit Iran “extremely hard” within weeks. That pushed traders back into defence and sent S&P 500 futures down 1%.
Why Are Oil Prices So Important for the S&P 500 Right Now?
Higher oil prices push up inflation, raise business costs, and squeeze consumer spending. Reuters reported Brent up about 5% to $106.16 a barrel after the speech, which brought the inflation problem back to the centre of equity pricing.
What is Driving Stagflation Fears in Markets?
Traders are now dealing with a weaker growth outlook amid high energy-driven inflation. That is the classic stagflation setup, and Reuters said Trump’s comments revived those concerns after the market had briefly hoped the war might wind down.
Why Did the Dollar Strengthen While Stocks Fell?
Traders moved back into the US dollar because the speech raised the odds of a longer conflict and kept energy supply fears alive. Reuters reported the dollar index up 0.3% to 99.925, showing that traders were rotating back into havens.
How Does the Strait of Hormuz Affect Us Equities?
The Strait of Hormuz is one of the most important fuel shipping routes in the world. If it stays blocked or restricted, energy prices stay high for longer. Reuters said the speech gave no real reassurance about when or how the strait would reopen, leaving markets on edge.
Start trading now – Click here to create your real VT Markets account
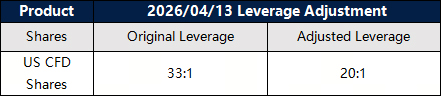
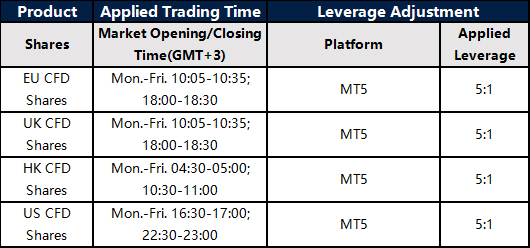
To provide a favorable trading environment to our clients, VT Markets will modify the trading setting of all Shares products. Please refer to the following details:
1. All US Shares products leverage will be adjusted to 20:1.
2. MT5 All Shares products dynamic leverage: New positions opened within 30 minutes before market closing and after market opening will start with a leverage of 5:1. After the mentioned period, the leverage will be resumed to original leverage and will not be adjusted back to 5:1.
The above data is for reference only, please refer to the MT4/MT5 software for specific data.
Friendly reminders:
1. All specifications for Shares CFD stay the same except leverage during the mentioned period.
2. The margin requirement of the trade may be affected by this adjustment. Please make sure the funds in your account are sufficient to hold the position before this adjustment.
If you’d like more information, please don’t hesitate to contact [email protected].
Silver (XAG/USD) pulled back from a four-day high in the mid-$73.00s reached on Tuesday. It traded just above $72.00 in early European hours, up 3.0% on the day and rising for a third session.
The near-term setup stays bearish while price remains below the 100-day Simple Moving Average (SMA) near $75. The 100-day SMA is rising but is acting as resistance, as silver moves towards the 200-day Exponential Moving Average (EMA) near $63.
Bearish Momentum Signals
Momentum signals point lower, with the MACD (12, 26, 9) below its signal line and in negative territory, and a weak histogram. The Relative Strength Index (RSI) is 41.83, below 50, indicating ongoing selling pressure rather than oversold conditions.
Support is near $69.00, with the recent low at $67.85 underneath. A break below this zone may open a move towards $63.00, where the 200-day EMA is located.
Resistance is around $75.00, where the 100-day SMA meets a prior breakdown area. A daily close above $75.00 could reduce bearish pressure and leave $80.00 as the next barrier.
The note states the technical analysis was produced with help from an AI tool.
Trading Implications And Key Risks
Given the technical pressure on silver, we should view the current rally toward the mid-$73.00s as a potential selling opportunity. The $75.00 level, where the 100-day moving average sits, represents a formidable ceiling. For derivative traders, this suggests establishing short positions or buying put options on any sign of weakness below this key resistance in the coming days.
This bearish view is supported by the broader economic environment, as the latest US inflation figures for February 2026 came in slightly above expectations at 3.4%. This data makes it less likely the Federal Reserve will rush to cut interest rates, which provides underlying support for the US dollar. A stronger dollar is typically a headwind for silver prices, reinforcing the negative technical signals.
We are also seeing sentiment turn against precious metals, as the most recent Commitment of Traders report shows managed money has been cutting its net long exposure to silver futures. In addition, major silver-backed ETFs have recorded net outflows of over 12 million ounces in the first quarter of 2026, indicating that investment demand is softening. This lack of buying interest from large players makes a sustained rally less probable.
A potential strategy is to target a move down to the initial support area around $69.00. We recall a similar technical pattern in the third quarter of 2025, where a failure at the 100-day SMA led to a quick retest of lower support levels. If the $67.85 low is breached, the primary target becomes the 200-day average near $63.00, which offers a more attractive risk-reward for bearish plays.
The main risk to this outlook is a decisive daily close above the $75.00 resistance zone. Such a move would invalidate the current bearish structure and could force a quick covering of short positions, potentially pushing prices toward the $80.00 barrier. Therefore, any short positions should have a defined stop-loss just above the $75.00 mark to manage this risk effectively.
Create your live VT Markets account and start trading now.
Start trading now – Click here to create your real VT Markets account
New Bank of Japan data indicate underlying inflation is near or above the target and the output gap is positive. With USD/JPY testing 160, the risk of a Bank of Japan rate rise before Standard Chartered’s Q3 baseline has increased.
Standard Chartered says there is still a high hurdle for the Bank of Japan to meet market expectations of two rate hikes in 2026. The bank also notes that market pricing for roughly two Bank of Japan hikes by December stayed stable in March.
Rising Volatility Risks Around Usd Jpy
The analysis points to policy remaining accommodative, using a benchmark rate of 0.75% that is below the estimated neutral rate range. It links this backdrop to bear steepening in the 2Y/10Y Japanese government bond spread since the outbreak of the war, reflecting inflation risks tied to higher fuel costs.
It contrasts this with other developed markets, where 2Y/10Y spreads have mostly bear flattened. That pattern is attributed to policy rate increases being priced back in after the recent oil price shock.
The article states it was produced with the help of an AI tool and reviewed by an editor.
With USD/JPY now testing the 160 level, the risk of a Bank of Japan (BoJ) rate hike coming sooner than our Q3 expectation has grown significantly. We are watching for a potential spike in currency volatility, especially recalling the Ministry of Finance’s interventions back in 2024 when the pair crossed similar thresholds. As of this morning, the pair is trading around 159.85, putting immense pressure on policymakers.
Potential Boj Hike Timeline
The BoJ is falling behind the curve, and recent data supports this view. The latest core inflation reading for February 2026 came in at 2.3%, remaining above the bank’s 2% target, while strong Q4 2025 GDP growth of 0.5% confirms the economy has a positive output gap. With a policy rate of just 0.75%, the current monetary stance is far too loose for these conditions.
For derivative traders, this situation signals an opportunity to position for increased price swings in the coming weeks. We believe buying short-dated USD/JPY options, like one-month straddles, is a sound strategy to capitalize on this building tension. This allows a trader to profit from a large move in either direction, whether from a surprise hike or a decisive break above 160.
The Japanese government bond market is also sending unique signals about lingering inflation risks. We see the 2-year/10-year yield spread continuing to steepen, meaning long-term borrowing costs are rising faster than short-term ones. This is different from other developed markets, where a fear of immediate hikes is causing yield curves to flatten.
Despite the drama at the 160 level, the swaps market has remained stable, pricing in roughly two rate hikes by December 2026. We remember how the BoJ moved very cautiously throughout 2025, which suggests the hurdle to meet even this pricing is high. Any action or inaction that challenges this two-hike consensus will create a significant trading opportunity.
Create your live VT Markets account and start trading now.
Start trading now – Click here to create your real VT Markets account