Back

The New Tech Order: Hedging Against the Decline of Legacy Software

From hype to industry-changing sentiments, AI has even loom as a market-clearing event threatening upheaval across industries. In early February 2026, markets witnessed the Software-mageddon— an anxious sell off by traders and investments moving away from tech stocks.

The rapid rise of AI has been through hyperspeed and hyperscale evolution amidst 2025 and is making way for the upcoming IPOs of OpenAI and Anthropic, the two big names creating market pulses in moving trillions of dollars in pre-IPO stage.

Trader’s Takeaway:
– AI Industry Shake-Up reshaping industries
– CFD traders should focus on the impact on legacy tech stocks
– Learn Float Risk and impact of anticipation on actual supply
– Find CFD short opportunities in IPO Timeline

The Trillion-Dollar Semiconductor and AI Industry

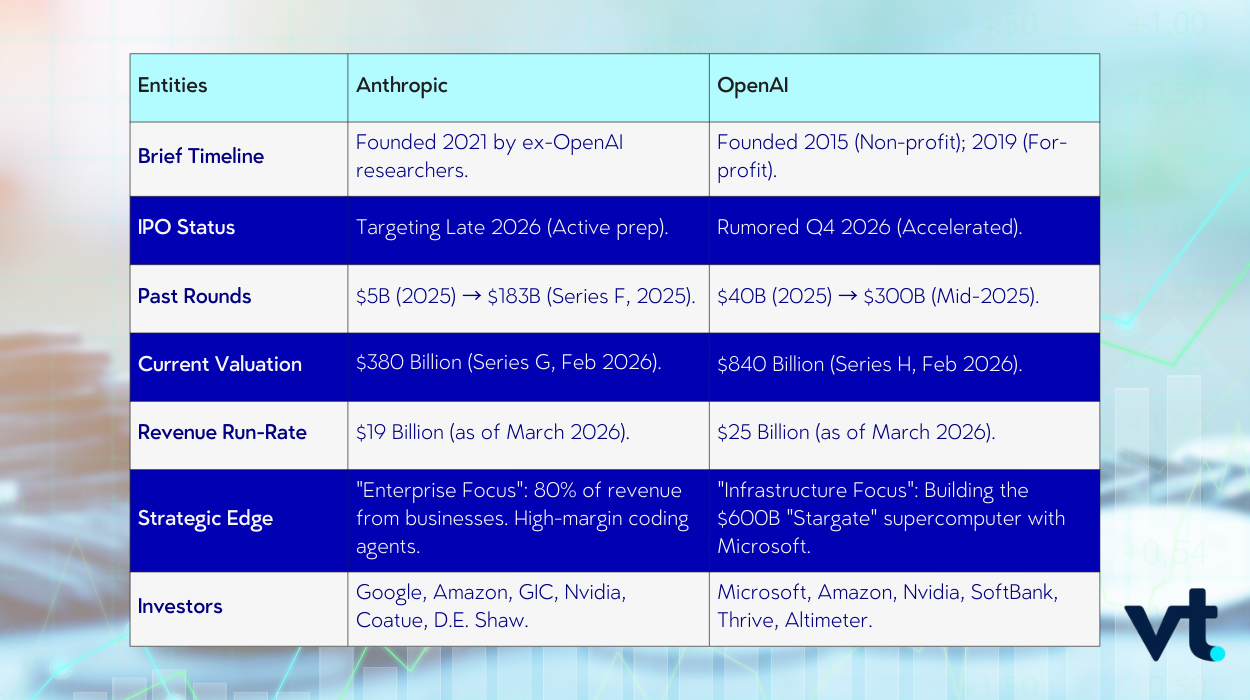
As the industry matures, the “buzz” has shifted from chatbots to infrastructure. OpenAI, recently valued at $840 billion following its February mega-round, and Anthropic, at $380 billion, are no longer just startups; they are the new gravity of the tech sector.

With such a massive valuation that continues to bump up from every funding round, even the market is looking to boost these two companies for further innovation. These companies’ biggest competitors are also their biggest benefactors.

The shift towards Strategic Tech Consolidation where Big Tech and these entities are formulating a critical infrastructure has started.

Any news on these entities creates immediate, tradeable volatility across the entire Magnificent Seven and the semiconductor sector. We are no longer trading isolated companies; we are trading an interconnected AI web.

Download the VT Markets app to monitor real-time price action.

Strategic Hedging

For CFD traders, this creates a dual opportunity: speculating on the AI giants while simultaneously hedging against the “old guard.

Because these fundings accumulate from the revenue of other public companies, the world’s largest companies are concentrated and transforming into a Circular Economy pattern within the AI Supply Chain.

The Contagion Trade: When the Backers Become the Risk

Microsoft(MSFT), Alphabet (GOOG), and Amazon (AMAZON) are no longer just traditionally reliable tech companies. In backing heavily in OpenAI and Anthropic, they are also leveraged proxies, indicating sentiments and a ‘report card’ for AI’s growth.


The Disruptive Force: Legacy Tech is Narrowing

With Anthropic being enterprised-focus, it is looking to dominate software spaces and enable business level automation. The company is merging as a major disruptor to traditional software-as-a-service (SaaS) business models,


Look to Calmer Markets In Blind Volatility

When a massive listing like OpenAI goes live, individual stock movements can become erratic and unpredictable. A more removed exposure to the AI boom might exist in CFD Indices (e.g. NAS100) that distribute performance within just a single stock and supports a general Tech to AI stack.

A Race for Sustainable Intelligence

That said, consolidation within the technology sector can also create a cannibalisation of features and offerings. At that point, the question is no longer on how good the product is, but how far the business can go, a primary metric for Anthropic and OpenAI on their way to market leadership.

Comparing Anthropic and OpenAI IPO Strategies

Strategy PillarAnthropic (The Efficiency Play)OpenAI (The Infrastructure Play)
Primary StrategyEnterprise-First: Focused on high-margin B2B tools like Claude Code. 80% of revenue comes from stable business contracts.Ecosystem-First: Building a global “AI Operating System” and “Stargate” infrastructure to own the entire value chain.
Cost ManagementMulti-Cloud Diversification: Spreads compute across AWS, Google Cloud, and Oracle to arbitrage chip prices and avoid provider lock-in.Vertical Integration:Building proprietary data centersband in-house chips to reduce long-term dependency on Nvidia.
Infrastructure Spend“Capital Light”: Spends heavily on R&D but leases infrastructure, allowing for a faster pivot to cash-flow positivity.“Capital Intensive”: Tied to a $1.4 Trillion long-term data center roadmap, leading to massive short-term burn.
Profitability StatusProjected Cash-Flow Positive by 2027/28.Projected $14B Loss in 2026; profit delayed until ~2030 to fund massive scale.

OpenAI works towards a for-profit structure, gaining more control from investors for a high-beta momentum play. Its path is longer and riskier, but its scale is unmatched.

Anthropic is the “Efficiency” play, aiming for profitability years sooner, by avoiding debt trap and distributing reliance.

The agenda remains clear, it is about who can beat the other towards IPO countdown.


Opportunities in the IPO Timeline

In the world of CFDs, timing is the difference between a successful trade and a missed opportunity. Here is how to navigate an IPO countdown when it happens:

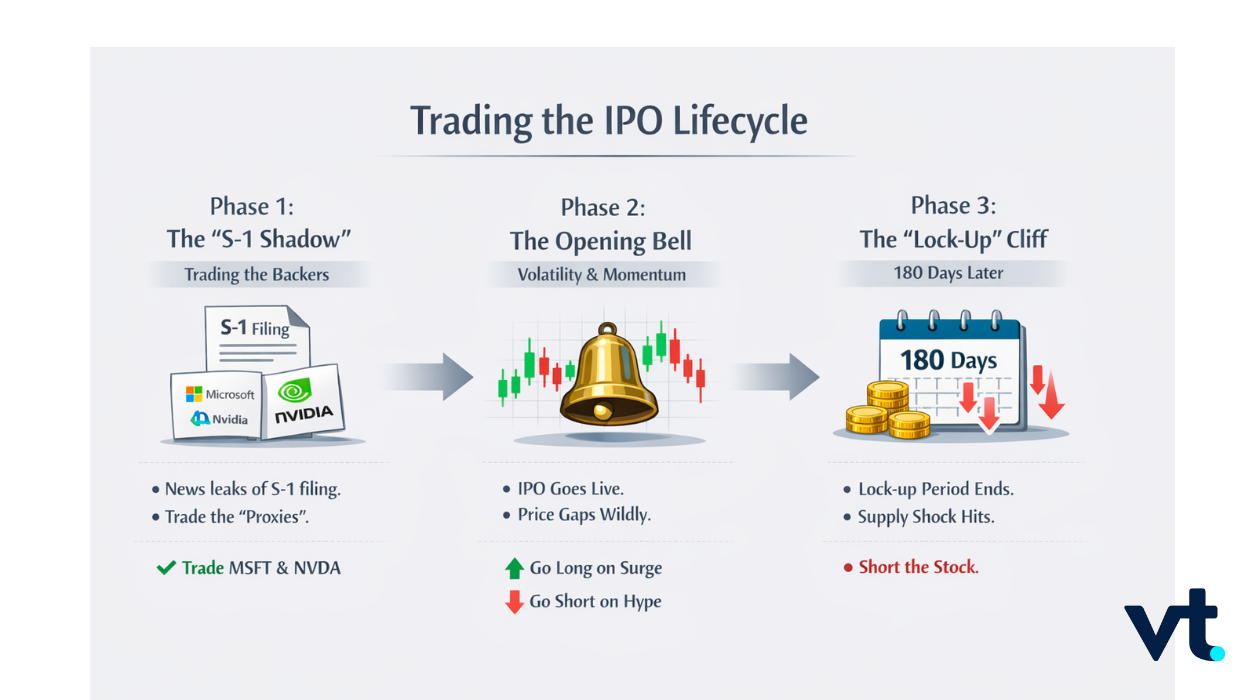
In initial prep, the companies that reflect revenue growth, will boost the stock prices of its primary backersoften surge as discussed in The Contagion Trade section.

When the ticker goes live in phase 2, the low float often causes the price to gap violently, making opportunity for Momentum Trading. A moment to choose long or short with demand surges or price correction.

Finally, approximately six months after an IPO, early investors are finally allowed to sell their shares. This supply shock correction is often another window for price to fall, creating another trade opportunity.

Understanding Float Risk: The CFD Advantage in IPO

In Pre-IPO discussions like now, traders may find opportunities in market fluctuations as these companies move ahead, particularly if there is a rush of investor interest or volatility following their public listing.

For massive IPOs like OpenAI ($840B) and Anthropic ($380B), its been assessed that a “normal” float of 15–20% simply isn’t going to cut it. Experts predict that these companies will debut with just 3% to 7% of shares available, which will likely create massive price gaps when the stock hits the market.

Float risk is the primary driver of the “Opening Bell” price movements for these IPOs. The small float means there’s limited supply of shares to meet demand, which causes extreme volatility, an inviting time for CFD trades.

Until IPO, Industry Still Moves

In the Applications stage of the AI lifecycle, the AI stack is scaling. Anthropic’s focus on ethical AI positions adds to the safety-first regulatory approach like what we’ve seen in AI Identity Access Management, while OpenAI bets on becoming the global AI operating system. Both these entities are transitioning into market leaders regardless.

Remember, the ‘Software-mageddon’ sweep shows us the market might be more unanimous than ever, but trading opportunities can still be found.

At VT Markets, we equip traders with the tools, insights, and execution capabilities to navigate these transformative shifts, helping you position ahead of major market developments.

Quick Refresher
  • What are the primary trading opportunities in OpenAI and Anthropic’s IPOs?
    The best opportunities come from managing float risk and volatility. Traders can capitalize on sharp price movements after the IPO listing and the lock-up period when early investors sell shares.
  • How does float risk impact IPO trading?
    Float risk occurs when a company releases only a small percentage of shares, creating price volatility. This limited supply often leads to rapid price swings, which traders can exploit for short-term gains.
  • Why is shorting legacy tech stocks a smart strategy now?
    As AI companies like OpenAI and Anthropic disrupt industries, legacy tech stocks may experience declining value, making them ripe for shorting as market capital shifts toward AI-driven growth.
  • What is legacy tech?
    Legacy tech refers to established technology companies and their products, such as software and hardware firms, that may struggle to adapt to new AI-driven trends and innovations in the market.
  • How can CFD traders prepare for AI IPOs like OpenAI and Anthropic?
    CFD traders should focus on momentum trading during the IPO, keep an eye on float risk, and track industry shifts in AI that may affect broader sectors, especially legacy tech.

Start trading now – Click here to create your real VT Markets account

Trump said US hit Kharg Island military sites, warning Iran’s oil facilities might be targeted if disruption continues

US President Donald Trump said the US hit military targets at Kharg Island in the Persian Gulf and warned it could strike oil sites next if Iran keeps disrupting energy flows through the Strait of Hormuz. He described the operation as one of the most powerful bombing raids in the history of the Middle East and said US forces did not target oil infrastructure. Kharg Island handles nearly all of Iran’s crude oil exports and had largely been avoided by the US and Israel. Reports said officials in the Trump administration have discussed seizing the island as a possible option.

Iran Retaliation Threats

Iran warned it would retaliate against US-linked energy assets. Iran’s Al-Anbiya Central Headquarters said oil and energy facilities linked to companies cooperating with the US would be “immediately destroyed and turned to ashes” if Iran’s energy infrastructure is targeted. Qatar’s Defence Ministry said its forces intercepted a missile attack aimed at the country, AFP reported. The developments add to a two-week conflict in the region. WTI is West Texas Intermediate crude, one of three major benchmarks alongside Brent and Dubai. It is a US-sourced, light, sweet crude distributed via the Cushing hub. WTI prices are driven by supply and demand, geopolitical disruption, OPEC decisions, and the US dollar. API and EIA weekly inventory reports can move prices; their results are within 1% of each other 75% of the time, and API is published Tuesday with EIA the next day. OPEC has 12 members and meets twice yearly, while OPEC+ includes ten non-OPEC members, including Russia.

Market Impact And Trading Approach

With the US striking Kharg Island, we should anticipate a significant spike in crude oil prices when markets open. The immediate strategy involves positioning for this upside, primarily through buying WTI and Brent call options or futures contracts. This direct military engagement in a critical export hub signals a severe escalation that will likely price in a substantial risk premium. The Strait of Hormuz, through which over a fifth of the world’s daily oil consumption passes, is now the center of a direct military conflict. Iran’s threat to retaliate against US-linked energy infrastructure puts a significant portion of that supply in immediate jeopardy. Any actual attack on tankers or facilities in the region would send shockwaves through the market, pushing prices much higher. We expect a dramatic surge in market volatility, which will be reflected in options pricing. The CBOE Crude Oil Volatility Index (OVX), which was hovering around 40 last week, will likely gap up significantly, potentially testing highs not seen since the 2022 energy crisis. Buying call options allows us to profit from both the rise in oil prices and this expansion in implied volatility. This situation has historical parallels, such as the initial phase of the conflict in Ukraine back in 2022, when WTI crude prices surged past $120 per barrel. Given that this new conflict directly targets oil infrastructure, a move toward those previous highs in the coming weeks seems plausible. Traders should use these past events as a rough guide for setting potential price targets. A key trade to consider is the widening of the Brent-WTI spread, as Brent crude is more directly exposed to Middle Eastern supply disruptions. As of early March 2026, the spread was a narrow $4, but we can expect this to widen considerably as the geopolitical risk is centered in the Persian Gulf. Going long Brent futures while simultaneously shorting WTI futures could capture this divergence. We must also monitor the response from OPEC+, which currently holds an estimated 3.5 million barrels per day of spare production capacity. While this could theoretically soften the blow of a supply disruption, bringing it online takes time and may not be enough to calm a market facing a full-blown military crisis. Weekly inventory reports from the EIA will be critical to watch, as any surprise drawdowns will add more fuel to the rally. Create your live VT Markets account and start trading now.

Start trading now – Click here to create your real VT Markets account

After four bearish sessions, EUR/USD closed near 1.1400, falling under 200-day SMA, ending weekly lower

The euro ended the week down over 1.74% against the US dollar and fell 0.84% on the day. EUR/USD logged four straight down sessions after dropping below the 200-day simple moving average at 1.1672, and it was trading at 1.1414. On the weekly chart, EUR/USD is below 1.1450 and the Relative Strength Index moved into negative territory three weeks ago after slipping under the 50 level. This points to continued downward movement, with support levels at 1.1400 and 1.1300.

Technical Levels And Trend

If those supports break, the next major area is the 100-week simple moving average at 1.1165. On the daily chart, the nearest support is the 1 August 2025 swing low at 1.1391. A break below 1.1391 brings the 29 May 2025 daily low at 1.1210 into view. If weakness continues, the 12 May 2025 low at 1.1065 is the next level to watch. Looking back at the analysis from late 2025, we saw a strong bearish bias form in the EUR/USD after it broke below its 200-day moving average. That sentiment appears justified, as the fundamental picture has since confirmed a weakening Euro. The technical breakdown we observed then was the start of a more significant move. The core of the issue is diverging central bank policy, which has become clearer in early 2026. With the latest US inflation data from February 2026 holding firm at 3.2%, the Federal Reserve is maintaining a restrictive stance with rates at 4.75%. In contrast, the European Central Bank, facing weaker growth, made a 25 basis point cut in January 2026, bringing its main rate to 2.75%.

Fundamental Drivers And Trade Ideas

This interest rate difference makes holding US dollars more attractive than euros, pressuring the pair lower. Recent economic data further supports this, with final Q4 2025 US GDP growth at a solid 2.3% annualized rate, while the Eurozone composite PMI for February 2026 dipped to 48.9, indicating a contraction in business activity. This economic divergence gives traders a fundamental reason to expect continued Euro weakness. For derivative traders in the coming weeks, this environment favors strategies that profit from a falling EUR/USD. Buying put options with strike prices below the current market level offers a clear way to speculate on further downside. Alternatively, selling out-of-the-money call spreads can generate income by betting the pair will not rally significantly. The key support levels identified back in 2025 remain highly relevant targets for these positions. As we approach mid-March 2026, the 1.1300 and the more significant 100-week moving average, which was noted at 1.1165, are the next logical areas of interest. A decisive break below these levels could accelerate the selling pressure. Create your live VT Markets account and start trading now.

Start trading now – Click here to create your real VT Markets account

WSJ reports a federal judge quashed Justice Department subpoenas targeting Federal Reserve Chair Jerome Powell in investigation

A Wall Street Journal report said a federal judge cancelled two subpoenas that the Justice Department sent to Federal Reserve Chair Jerome Powell. The subpoenas were thrown out by a US District Court judge. US District Judge James Boasberg issued a decision that was unsealed on Friday. He ruled the subpoenas were improper.

Subpoenas Against Powell Thrown Out

The ruling affected a criminal investigation led by US Attorney Jeanine Pirro into Powell. The inquiry looked at whether Powell gave false testimony to Congress last summer about the Federal Reserve’s renovation project. Powell made a public statement on 11 January. He said the investigation was being used as a pretext linked to pressure on the Federal Reserve to cut interest rates and weaken its independence. The judge’s decision to throw out the subpoenas against the Federal Reserve Chair is a significant event for us. It removes a major cloud of political uncertainty that has been hanging over the market since last summer. We should expect implied volatility to fall in the coming weeks, as seen by the VIX index already dropping from around 19 to below 16 after the news broke. This ruling directly impacts interest rate expectations, as the threat of a politically forced rate cut has diminished. Looking at the CME FedWatch Tool, we saw the market immediately reprice the odds of an April rate cut from nearly 40% down to just 15%. This indicates a collective belief that the Fed will now stick firmly to its data-dependent approach.

Market Implications For Rates And Dollar

This is especially relevant given the latest inflation data, which showed the Consumer Price Index for February was still a stubborn 3.1%. An independent Fed is now more likely to hold rates steady to fight this inflation, rather than caving to outside pressure. Traders should adjust their positions in interest rate futures and options to reflect a more hawkish, or at least less dovish, path forward. We can recall the market jitters from the 2018-2019 period, when similar political pressure on the Fed led to spikes in volatility. This legal victory for Powell suggests a more stable policy environment compared to what we saw back then. This newfound stability should make long-term planning easier and reduce the premium on short-term hedges. With the Federal Reserve’s independence reaffirmed, the US dollar should find a stronger footing. A Fed focused on controlling domestic inflation is supportive of a stronger currency. We should therefore re-evaluate any positions that are betting on significant dollar weakness in the near term. Create your live VT Markets account and start trading now.

Start trading now – Click here to create your real VT Markets account

Gold slides towards weekly losses as the dollar index tops 100, driven by Middle East tensions, inflation fears

Gold fell about 0.70% on Friday and was set to end the week down more than 2%. It traded near $5,032 after hitting $5,128, and slipped below $5,050 as the US Dollar strengthened. The US Dollar Index rose 0.70% to 100.43, while the US 10-year Treasury yield added nearly 2.5 basis points to 4.286%. Oil prices also climbed, with WTI reaching a year-high of $113.00.

Us Data Signals Slower Growth

US data pointed to slower growth, with Q4 2025 GDP (second estimate) revised down from 1.4% to 0.7% year-on-year. Core PCE inflation held at 3.1% year-on-year in January, while headline PCE eased from 2.9% to 2.8%. Markets priced in 20 basis points of easing, based on Chicago Board of Trade data. Standard & Poor’s warned that the Iran war could cause supply shocks, lowering US GDP growth and raising inflation. US petrol prices rose by more than 20% to $3.60 per gallon over two weeks. Traders are watching the Fed meeting on 17–18 March, plus Industrial Production, housing data, PPI, and jobs figures. Technical levels cited include support at $5,000, the 50-day SMA at $4,925, then $4,841 and $4,655. Resistance levels include $5,050, $5,100, and $5,238, and the RSI is below 50. Central banks added 1,136 tonnes of gold worth around $70 billion in 2022, the highest on record. Gold is described as moving inversely to the US Dollar and US Treasuries.

February 2025 Support Break Confirmed

Looking back at the end of February 2025, we saw gold weaken as predicted due to a strong dollar and rising bond yields. The price did indeed break below the key $5,000 support level, confirming the bearish technical signals we were observing at the time. This move was driven by investors seeking safety in the Greenback amidst the ongoing Middle East conflict. The fundamental pressures on gold have not subsided in the weeks since. As of today, the US Dollar Index has remained strong, currently trading around 101.50, and the 10-year Treasury yield has crept higher to 4.35%. This environment continues to make non-yielding assets like gold less attractive for new capital. Inflation fears, which were a major concern, have proven to be persistent. The most recent inflation data for February showed Core PCE, the Fed’s preferred gauge, holding stubbornly at 3.2%, slightly above the prior month’s reading. This has been largely fueled by energy costs, with WTI crude oil prices staying elevated around $108 per barrel following the expanded US sanctions against Iran. With the Federal Reserve’s meeting just days away on March 17-18, market expectations have hardened significantly. The probability of a rate cut has been completely priced out for this meeting, with the CME FedWatch Tool now showing a 95% chance the Fed will hold rates steady. The primary focus will be on the Fed’s statement and any change in its forward-looking guidance on inflation and growth. Given this backdrop of high uncertainty and a major event catalyst, traders should consider strategies that can profit from a spike in volatility. A long straddle, buying both a call and a put option with the same strike price and expiration date on a gold ETF or futures contract, could be an effective way to play a significant price move in either direction following the Fed announcement. This strategy limits risk to the premium paid for the options. For those anticipating a hawkish tone from the Fed, which would likely strengthen the dollar and push gold lower, buying puts offers a more directional play. If the Fed signals rates will remain higher for longer than anticipated, we could see a test of the lower support levels identified back in February, such as the $4,841 swing low. This approach provides a defined-risk way to position for further downside in the precious metal. Create your live VT Markets account and start trading now.

Start trading now – Click here to create your real VT Markets account

US CFTC gold net non-commercial positions increased to 163.1K, up from 160.1K previously

US CFTC data shows gold non-commercial net positions rose from 160.1K to 163.1K. This is an increase of 3.0K positions from the previous reading.

Speculative Positioning Signals

The latest figures show large speculators have increased their net bullish bets on gold to 163,100 contracts. This move suggests growing conviction that gold prices will rise in the near term. We see this as a reaction to persistent economic uncertainty and shifting central bank expectations. Last week’s February 2026 CPI report came in hotter than expected at 3.4%, unsettling markets that had priced in a more rapid decline in inflation. The Federal Reserve minutes released shortly after hinted at delaying any potential rate cuts until the third quarter, a shift from their earlier dovish tone. This situation is drawing capital towards non-yielding assets like gold as a hedge. Adding to the uncertainty, renewed trade disputes surrounding semiconductor exports have flared up over the past month. These tensions are raising concerns about potential supply chain disruptions and a global growth slowdown. From the perspective of 2025, we saw a similar pattern during the inflationary period of 2022 and 2023. Back then, rising speculator net positions often preceded significant upward moves in the gold price as the Fed battled inflation. This historical precedent supports the current bullish sentiment. Traders should consider positioning for a potential move towards the $2,200 an ounce level in the coming weeks. Buying call options or implementing bull call spreads could offer a defined-risk way to capitalize on this expected upward momentum. Implied volatility has ticked up slightly but remains reasonable, suggesting options are not yet prohibitively expensive.

Key Levels And Trade Risks

We must also watch the key resistance level at $2,150, which capped the rally back in January 2026. A failure to break and hold above this price could indicate this recent buying from funds is not strong enough to sustain a new trend. Create your live VT Markets account and start trading now.

Start trading now – Click here to create your real VT Markets account

UK CFTC data shows non-commercial GBP net positions fell to £-84.2K, from £-72.7K previously

UK CFTC data shows GBP non-commercial net positions fell to £-84.2K. The previous reading was £-72.7K. We are seeing large speculators increase their bearish bets against the pound, with net short positions growing to -£84.2K. This is a notable shift from the -£72.7K level, showing growing conviction that the currency will weaken. For derivative traders, this suggests the path of least resistance for GBP may be downwards in the near term.

Speculative Positioning Turns More Bearish

This sentiment is backed by recent economic data showing UK inflation falling faster than expected, recently hitting a two-year low of 3.4%. With the Bank of England holding rates at 5.25% but with a growing minority calling for cuts, the market is pricing in rate reductions later this year. These factors reduce the appeal of holding the pound, justifying the increase in short positions. Traders may consider buying put options on GBP/USD to profit from a potential decline while capping risk. Alternatively, selling GBP futures contracts is a more direct way to express this bearish view. We are also looking at pairs like GBP/JPY, where a dovish Bank of England contrasts sharply with potential policy shifts elsewhere. However, we must remain cautious as this short position becomes more crowded. If any unexpected positive UK economic news is released, it could trigger a sharp rally as these shorts are forced to buy back their positions. We saw a much more extreme version of this after the Brexit vote in 2016, so while the current sentiment is bearish, it is not yet at a historical panic level. This bearish trend is consistent with the economic challenges we observed throughout 2025, which followed the technical recession confirmed in the second half of 2024. The UK’s struggle for significant growth has been a persistent theme, influencing our long-term view on the currency. Therefore, this increase in short positions feels like an extension of an already established macro trend.

Key Risk Crowded Shorts

Create your live VT Markets account and start trading now.

Start trading now – Click here to create your real VT Markets account

US CFTC reports non-commercial oil net positions rising to 228K, up from 172.2K previously

US Commodity Futures Trading Commission data shows oil net non-commercial positions rose to 228,000. The previous figure was 172,200.

Speculative Positioning Turns Sharply Bullish

We are seeing a significant surge in bullish sentiment for crude oil. The jump in net long positions from 172.2K to 228K is the largest weekly increase in speculative buying we have tracked in over a year. This indicates that large traders are positioning for higher prices in the near future. This shift is likely driven by improving global demand signals and persistent supply discipline. Recent data from early March 2026 showed China’s industrial output growing at a 5.8% annual pace, beating expectations and signaling robust energy consumption. This coincides with OPEC+ signaling it will maintain its current production cuts through the second quarter. Further supporting this view, the most recent Energy Information Administration (EIA) report showed U.S. crude inventories unexpectedly fell by 2.5 million barrels. This drawdown, happening just as we head into the higher-demand spring season, tightens the supply-demand balance. Historically, a combination of falling inventories and rising speculative interest, like we saw in the spring of 2024, preceded a strong rally. We remember how the market was weighed down by recessionary fears for much of 2025, which kept speculative positioning relatively muted. That period saw prices trapped in a range as traders awaited a clear economic signal. The current breakout in positioning suggests that conviction is now building for a sustained move higher.

Derivatives Ideas For A Bullish Tape

In the coming weeks, derivatives traders should consider strategies that benefit from rising prices and potentially increasing volatility. Buying near-the-money call options for May or June delivery could capture this expected upward move. For a more risk-defined approach, bull call spreads offer a way to finance long calls by selling a further out-of-the-money call. Create your live VT Markets account and start trading now.

Start trading now – Click here to create your real VT Markets account

Australia’s CFTC AUD non-commercial net positions slipped to 54.2K from the prior 67.8K

Australia’s CFTC data shows Australian dollar non-commercial net positions fell to 54.2K from 67.8K in the previous report. This is a drop of 13.6K in net positions from the prior figure.

Speculative Positioning Signals Weaker Conviction

We are seeing large speculators reduce their bullish bets on the Australian dollar. This drop in net long positions from 67.8k to 54.2k contracts is a clear signal that conviction is weakening. Traders should view this as a warning sign for any existing long AUD positions. This shift in sentiment is likely tied to softening commodity prices, especially iron ore. Recent data shows iron ore prices have fallen nearly 15% from their late 2025 highs, now trading below $115 per tonne due to reports of slowing industrial output from China. This directly impacts Australia’s export outlook and, by extension, the AUD’s strength. Furthermore, interest rate expectations are playing a major role. While the US Federal Reserve maintains a hawkish tone with inflation still proving stubborn around 2.5%, the Reserve Bank of Australia has signaled it is on an extended pause. This narrowing yield differential makes holding the US dollar more attractive than the Aussie. Given this context, derivative traders should consider buying AUD/USD put options with expirations in the next four to six weeks. This strategy allows for profiting from a potential downturn while capping the maximum risk to the premium paid. It is a prudent way to position for a potential slide towards the 0.6500 level.

Historical Positioning Shifts Matter

We should remember what happened in the second half of 2025 when a similar, though smaller, reduction in net longs occurred. That event foreshadowed a choppy, sideways market for two months before a notable dip in the currency. History suggests that ignoring such a significant shift in positioning by speculative funds is unwise. Create your live VT Markets account and start trading now.

Start trading now – Click here to create your real VT Markets account

US CFTC reports S&P 500 non-commercial net positions rose, narrowing from -168.2K to -134.5K

US CFTC data showed S&P 500 NC net positions rose to -134.5K. The previous reading was -168.2K. The change is an increase of 33.7K, but the total remains net short. The figures relate to non-commercial positioning in S&P 500 futures.

Speculative Shorts Ease

The latest data shows speculative net short positions in the S&P 500 have been significantly reduced. While the overall sentiment among large traders is still bearish, the aggressive bets against the market are being unwound. This is the largest weekly reduction in net shorts we have seen in over six months. This shift in positioning follows the February 2026 jobs report, which showed a healthy but not overheated labor market with wage growth moderating to a 3.1% annual rate. This data has increased confidence that the Federal Reserve will not need to resume the rate-hiking cycle we endured in 2025. The market is now pricing in a greater than 70% chance that rates will remain on hold through the summer. We saw a similar pattern of extreme short covering in late 2022, just before the market staged a significant recovery in 2023. Given this historical context, traders should be cautious about maintaining large short positions. It may be prudent to lighten bearish exposure or hedge short bets by buying out-of-the-money call options. This unwinding of shorts has also contributed to a decline in market volatility. The VIX index has recently fallen from over 24 to below 18, reflecting a drop in demand for portfolio insurance.

Volatility Falls

This lower volatility makes strategies like selling cash-secured puts on high-quality stocks more attractive for traders looking to enter positions at a discount. Create your live VT Markets account and start trading now.

Start trading now – Click here to create your real VT Markets account

Back To Top
server

Hello there 👋

How can I help you?

Chat with our team instantly

Live Chat

Start a live conversation through...

  • Telegram
    hold On hold
  • Coming Soon...

Hello there 👋

How can I help you?

telegram

Scan the QR code with your smartphone to start a chat with us, or click here.

Don’t have the Telegram App or Desktop installed? Use Web Telegram instead.

QR code