Since peaking on 30 October 2025, the Nasdaq (NQ) has traded in a sideways range. The fall from that peak completed wave (W) at 23,994.5, followed by a rally that ended wave (X) at 26,349.
After wave (X), the index turned down into wave (Y). Wave (Y) is described as forming a double three Elliott Wave correction.
Current Structure And Key Levels
From the end of wave (X), a decline completed wave W at 24,000. A new wave X then started as a zigzag, with wave ((a)) rising to 25,217.5.
Wave ((b)) is now under way as a pullback. It is correcting the move that began from the 9 March 2026 low.
If the pivot at 23,994.8 holds, the index may rise in wave ((c)) to finish wave X. After that, the broader move is expected to continue lower.
We see the current pullback from the March 9, 2026, high as a temporary and corrective phase. This dip appears linked to the recent February 2026 Consumer Price Index data, which at 3.4% came in slightly hotter than anticipated, causing some short-term profit-taking. As long as the Nasdaq holds above the critical 23,994.8 pivot level, the structure favors another move higher in the coming weeks.
This outlook suggests traders could position for a short-term rally, which we are labeling wave ((c)). Using strategies like buying call options or deploying bullish call spreads could capture this expected, but temporary, upward move. Conflicting economic signals, such as February’s solid job creation being offset by a rise in the unemployment rate to 4.1%, support the view that this will be a limited, corrective rally rather than the start of a new, sustained bull market.
Broader Risk And Downside Bias
The larger pattern since the peak on October 30, 2025, remains a complex correction that is ultimately expected to resolve to the downside. Traders should therefore watch for signs of this anticipated rally stalling, as that would signal the time to shift toward bearish positions like buying puts. The CBOE Volatility Index (VIX) hovering around 19 reflects this underlying uncertainty and suggests that significant risk remains after any near-term strength fades.
This type of choppy, sideways price action is not unusual after a major market top, reminiscent of the consolidation we saw in prior post-bull run periods. Looking back from our current standpoint, the high set in late 2025 marked a significant turning point into this corrective phase. The broader market continues to grapple with the prospect of interest rates remaining higher for longer than previously hoped, capping any significant upside potential for now.
Create your live VT Markets account and start trading now.
Start trading now – Click here to create your real VT Markets account
EUR/USD fell for a third session and traded near 1.1540 in Asian hours on Thursday, slipping below 1.1550. The move followed a firmer US Dollar, linked to higher energy prices that raised inflation risks and lowered the chance of Federal Reserve rate cuts.
US CPI data for February showed inflation rose 0.3% month-on-month and 2.4% year-on-year. Core CPI rose 0.2% month-on-month and 2.5% year-on-year.
Fed Outlook And Key Data
The figures supported expectations that the Fed may keep rates steady in the near term. Markets are now watching US Personal Consumption Expenditures (PCE) data due on Friday.
In Europe, markets are still pricing European Central Bank rate rises in 2026. ING analysts said euro rates remain sensitive to energy prices, with lower energy potentially pulling 2-year yields down.
ECB officials said they are watching energy-driven inflation risks in the Eurozone. They also said the ECB is ready to respond if higher energy costs linked to the Iran war keep inflation elevated.
We are seeing the US Dollar strengthen as surging energy prices, linked to the Iran war, push Brent crude above $105 a barrel. This is putting direct pressure on the EUR/USD pair, pushing it below the 1.1550 level. The market is now pricing out any chance of a near-term Federal Reserve rate cut, especially after last week’s US jobs report showed over 250,000 jobs were added in February.
Volatility And Strategy Considerations
This environment of geopolitical tension and central bank uncertainty suggests volatility is the primary trade for the coming weeks. The Cboe EuroCurrency Volatility Index (EVZ) has already climbed to a six-month high, and we expect it could climb further as traders await fresh inflation data. Buying options, such as straddles, on EUR/USD is a viable strategy to position for a significant price move without betting on a specific direction.
For those with a directional view, the path of least resistance appears to be a weaker euro, given the direct impact of high energy costs on the European economy. Unlike the temporary energy spike we saw in the autumn of 2025, this situation feels more persistent, making put options on the EUR/USD an attractive way to hedge or speculate on further declines. These options provide a defined-risk way to gain short exposure in what is becoming a very choppy market.
We must also monitor the European Central Bank, as officials sound increasingly ready to act against rising prices. European interest rate markets are now pricing in at least one ECB rate hike by the end of 2026, a sharp reversal from just a few months ago. This creates a complex dynamic, as any ECB action to fight inflation could also damage an already fragile Eurozone economy, potentially leading to even more currency weakness.
Create your live VT Markets account and start trading now.
Start trading now – Click here to create your real VT Markets account
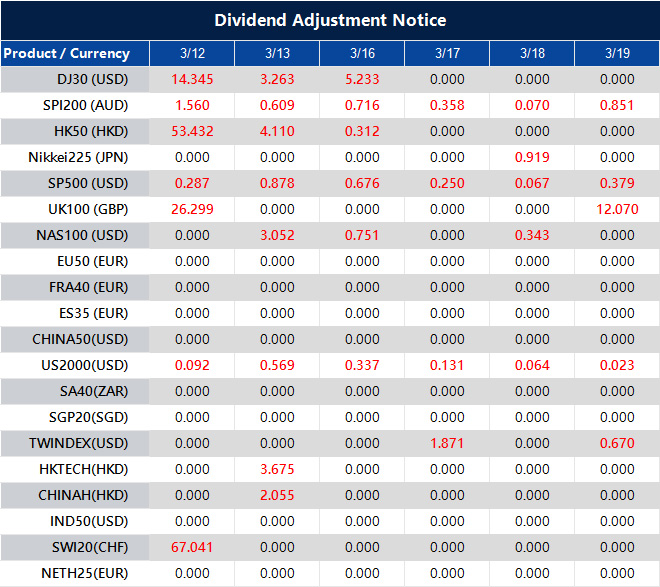
Please note that the dividends of the following products will be adjusted accordingly. Index dividends will be executed separately through a balance statement directly to your trading account, and the comment will be in the following format “Div & Product Name & Net Volume”.
Please refer to the table below for more details:
The above data is for reference only, please refer to the MT4/MT5 software for specific data.
If you’d like more information, please don’t hesitate to contact [email protected].
Silver fell in Asia to below $84.00, then rebounded but did not extend gains. It traded just under the mid-$85.00s and was down 0.40% on the day.
Price action stayed below the 100-hour EMA near $86.15, which limited intraday rises. The near-term tone was neutral with a slight bearish tilt.
The MACD histogram turned marginally positive and the MACD line moved above the signal line, near the zero level. This pointed to only limited upside momentum after a prior drop.
The RSI was near 43 and remained below its midline, which suggested ongoing selling pressure. Resistance was first seen at $86.15, with the next level near $87.20 if price breaks higher.
Support sat near $85.30, then around $84.85, which held the latest rebound. A sustained move below $84.85 could open the lower $84.00 area, while a move above $86.15 could reduce the bearish bias.
The technical analysis was produced with help from an AI tool.
We are seeing that silver’s inability to hold gains above the mid-$85.00s points to underlying weakness. Any attempt to rally is quickly being sold off, particularly as it approaches the key resistance level around $86.15. This pattern suggests that sellers are currently in control of the short-term price action.
This price behavior is consistent with recent macroeconomic data. The US Dollar Index has remained firm above 105 following last week’s stronger-than-expected jobs report, creating headwinds for dollar-denominated commodities like silver. Furthermore, we note that manufacturing PMI data out of China for February 2026 came in at a contractionary 49.8, signaling a slowdown in industrial demand which is critical for silver.
For traders using options, this creates an opportunity to sell call credit spreads with a short strike above the $86.15 resistance level. This strategy would profit from either a continued decline in price or if silver simply remains range-bound below that key hurdle in the coming weeks. The limited upside momentum shown by the MACD indicator supports this neutral-to-bearish stance.
Those holding short futures positions should view the $84.85 level as the first critical support to watch. A decisive break below this price would confirm the bearish trend and likely lead to a test of the lower $84.00 area. Any sustained move back above the $86.15 mark would be our signal to reconsider bearish positions.
This current technical setup is reminiscent of the price action we observed during the third quarter of 2025. Back then, a similar failure at a key moving average preceded a significant leg down in price. We are watching carefully to see if history repeats itself, as the broader market conditions appear just as challenging now as they did then.
Start trading now – Click here to create your real VT Markets account
The US Dollar Index (DXY) was near 99.35 in Asian trading on Thursday, moving above 99.00. It edged higher as conflict in the Middle East escalated, with US weekly Initial Jobless Claims due later on Thursday.
Market focus remained on disruption risks around the Strait of Hormuz. Iran launched what was described as its most intense operation since the start of the war to try to halt traffic through the oil route, while Bahrain reported fuel tanks at one facility were targeted and an Iraqi port official said two foreign tankers were hit, caught fire, and leaked oil.
Inflation Data And Fed Expectations
In US data, the Consumer Price Index rose 0.3% month on month in February, compared with 0.2% previously, matching expectations. Core CPI rose 0.2% month on month, down from 0.3% before, also in line with estimates.
Annual CPI inflation rates were unchanged from January, leaving inflation above the Federal Reserve’s 2% target. Markets priced in nearly a 99.5% chance of no rate change at the Fed’s March meeting, according to CME FedWatch.
Looking back at the situation in early 2025, the escalating conflict in the Middle East was a clear signal for a flight to safety. The US Dollar Index (DXY) was pushing higher, reflecting this sentiment. At that time, we saw the DXY strengthen toward the 104 level through March and April 2025, confirming the safe-haven demand.
Derivative traders should have interpreted this as a cue to go long the US dollar. Buying call options on dollar-tracking ETFs like the Invesco DB USD Bullish Fund (UUP) would have been a direct way to profit from this trend. These positions would have benefited from both the geopolitical tension and the Federal Reserve’s steady hand on interest rates.
Oil Supply Risk And Volatility Hedges
The direct threat to the Strait of Hormuz pointed to a significant risk for global oil supply. We remember West Texas Intermediate (WTI) crude oil prices hovering in the low $80s per barrel range during that period. This made call options on crude oil futures or energy sector ETFs a logical trade to hedge against or speculate on a supply shock.
Such geopolitical uncertainty typically fuels market volatility, making the CBOE Volatility Index (VIX) a key instrument to watch. In March 2025, buying VIX call options would have been a prudent hedge against a broader market sell-off triggered by worsening conflict. As of today, the VIX is trading much lower, near 14, highlighting that this was a specific, event-driven opportunity.
With the market almost fully pricing in a hold from the Fed in March 2025, the focus shifted to the future path of interest rates. We now know the Fed began to signal rate cuts later that year, which ultimately happened. Astute traders at the time would have used options on Secured Overnight Financing Rate (SOFR) futures to position for this eventual pivot away from a hawkish stance.
Create your live VT Markets account and start trading now.
Start trading now – Click here to create your real VT Markets account
The People’s Bank of China (PBOC) set the USD/CNY central rate for Thursday at 6.8959. This compared with the prior day’s fix of 6.8917 and a Reuters estimate of 6.8853.
The PBOC’s main monetary policy aims are price stability, including exchange rate stability, and supporting economic growth. It also works on financial reforms, including opening and developing financial markets.
Pboc Governance And Independence
The PBOC is owned by the state of the People’s Republic of China and is not an autonomous body. The Chinese Communist Party Committee Secretary, nominated by the Chairman of the State Council, has key influence over management and direction, and Pan Gongsheng holds both that role and governor.
The PBOC uses tools including a seven-day Reverse Repo Rate, the Medium-term Lending Facility, foreign exchange interventions, and the Reserve Requirement Ratio. The Loan Prime Rate is China’s benchmark interest rate and affects loan, mortgage, and savings rates, as well as the Renminbi exchange rate.
China has 19 private banks, including digital lenders WeBank and MYbank. In 2014, China allowed domestic lenders fully capitalised by private funds to operate in the state-led financial system.
The People’s Bank of China has set the USD/CNY rate weaker than expected at 6.8959, signaling a tolerance for a weaker yuan. This move diverges from market estimates and suggests a deliberate policy direction from the central bank. For derivative traders, this opens up possibilities for strategies betting on a higher USD/CNY exchange rate in the short term.
Market Implications And Trading Considerations
This decision follows recent data showing China’s exports grew by only 2.3% in the last quarter, missing forecasts and indicating sluggish external demand. A weaker currency can help make Chinese goods more competitive abroad and support the manufacturing sector. Traders should watch for the upcoming industrial production figures, as another weak print could encourage the PBOC to guide the yuan even lower.
Looking back, we saw similar managed depreciation in early 2025 when the economy was facing headwinds from a property sector slowdown. During that period, option volatility on the yuan increased by over 15% in a single month. This history suggests that buying straddles or strangles on USD/CNY could be a viable strategy to profit from expected price swings.
The central bank’s actions also have significant implications for commodity futures, as China is the world’s largest consumer. A weaker yuan makes dollar-denominated imports like crude oil and iron ore more expensive for Chinese buyers, which could temper demand. Consequently, traders should consider hedging long positions in industrial commodities that are sensitive to Chinese consumption.
We know the PBOC uses a broad set of tools, including the Loan Prime Rate (LPR), to manage economic growth. With the currency being allowed to weaken, the market may start to price in a potential cut to the LPR in the coming quarter to further stimulate the economy. Any such move would likely add more downward pressure on the yuan, reinforcing the current trading outlook.
Create your live VT Markets account and start trading now.
Start trading now – Click here to create your real VT Markets account
Oman ordered all vessels to leave its main oil export terminal at Mina Al Fahal as a precaution, Bloomberg reported on Thursday. The terminal handles about 1 million barrels per day (bpd) of Omani crude exports.
The order followed drone strikes on fuel tanks at Oman’s Salalah Port on Wednesday, with other drones intercepted. Bahrain’s Interior Ministry said on Thursday that Iran targeted fuel tanks at a facility in Muharraq Governorate, one of Bahrain’s four administrative regions.
Oil Prices Surge On Supply Risk
Oil prices rose after the reports. West Texas Intermediate (WTI) was up 7.35% on the day at $93.32 at the time of writing.
With crude prices jumping on the news from Oman and Bahrain, we are seeing a significant geopolitical risk premium being added to the market. The evacuation of a terminal handling around 1 million barrels per day creates immediate uncertainty over physical supply. We believe traders should consider buying short-dated call options to capitalize on any further panic-driven price spikes in the coming days.
This situation is especially serious given the market’s current tightness. Recent data from early March 2026 showed global commercial inventories sitting at their lowest level in nearly two years, providing very little cushion for supply shocks. This lack of a buffer means that even small disruptions can have an outsized impact on price, supporting a bullish outlook on crude futures for the immediate term.
We have seen this scenario before, recalling the market’s reaction in 2022 following the escalation of the conflict in Ukraine. Back then, WTI crude futures surged over 30% in just two weeks, illustrating how quickly prices can move when a major supply region is threatened. This history suggests that selling volatility or taking outright short positions is extremely dangerous until there is more clarity on the actual supply impact.
Trading And Volatility Considerations
The sharp increase in fear will cause a spike in implied volatility, making options contracts more expensive. This makes strategies like buying straddles or strangles appealing, as they profit from large price movements in either direction without needing to guess the ultimate outcome. Traders who expect a large move but are unsure of the direction should find these positions valuable in the current environment.
Looking ahead, we will be monitoring tanker traffic data around Mina Al Fahal to see if the evacuation translates into a real, sustained drop in exports. Any statements from major importing nations about potential releases from strategic reserves could also calm the market, as we saw in a smaller-scale event in 2025. If oil flows resume quickly, this price surge may be temporary, creating an opportunity to bet on prices falling back down.
Create your live VT Markets account and start trading now.
Start trading now – Click here to create your real VT Markets account
Status: Passed House (July 17, 2025); Stalled in Senate (March 2026).
Primary Impact: Reclassifies “Digital Commodities” under CFTC jurisdiction, separating them from SEC “Investment Contracts.”
Key Bottleneck: Senate disagreements over stablecoin rewards and anti-money laundering (AML) provisions.
Market Sentiment: Highly sensitive for altcoins (SOL, ADA, BNB) than the broader crypto market.
Impact on Crypto CFDs: With US spot regulation delayed, traders might increasingly turn to crypto CFDs to trade volatility without the legal complexity of direct asset ownership.
Asset Type
Current Oversight (2025)
Proposed Oversight (CLARITY)
Bitcoin (BTC)
Commodity (CFTC)
Confirmed Digital Commodity
Decentralised Altcoins
SEC “Security” Uncertainty
Digital Commodity (CFTC) if “Mature”
New Token Issuances
SEC Registration (Howey Test)
4-Year “Maturity” On-ramp
Stablecoins
Mixed (GENIUS Act)
SEC Anti-fraud + CFTC Spot Oversight
The CLARITY Act (2025) is a US federal bill designed to reclassify digital commodities under CFTC jurisdiction and provide a regulatory framework for crypto exchanges. The House passed the CLARITY ACT on July 17, 2025, but it remains stalled in the Senate as of March 2026.
A supportive bill, but not a simple one
The CLARITY Act appears supportive for crypto because it proposes clearer rules for digital assets, exchanges, brokers, and token issuers. However, it remains a proposal, and the final Senate version could differ significantly from the House bill.
Back in July, GENIUS has already created a legal lane for stablecoins.
GENIUS focused on stablecoins, while CLARITY aims to organise the broader crypto market structure, including token trading, exchange registration, and disclosures.
One of the bill’s more important ideas is the term ‘mature blockchain system‘ that distinguishesbetween networks that still look heavily controlled by a central group and networks that operate more independently.
That matters because not all crypto projects and blockchain technology are at the same stage of development. CLARITY tries to reflect that reality, rather than treating every token and blockchain network the same way.
For years, the US digital-asset market has operated with blurred definitions, overlapping oversight, and repeated disputes over which regulator should govern which part of the ecosystem. CLARITY is designed to reduce that confusion by drawing firmer lines around digital assets and the firms that handle them.
That is precisely why the bill has attracted so much attention. Clearer rules would, in principle, make the market easier to navigate for compliant exchanges, institutional participants, and token issuers that want a more workable path into the US market. In other words, the supportive case is easy to see.
What CLARITY is trying to achieve
At its core, CLARITY is trying to move the US crypto market from a grey-zone system to a more rules-based one. In practical terms, the bill would:
create clearer categories for digital commodities
expand registration paths for exchanges, brokers, and dealers
introduce provisional status while rules are still being finalised
apply more tailored disclosure expectations to qualifying token activities
Area
What already exists
What CLARITY is meant to add
Stablecoins
GENIUS Act created a federal payment stablecoin framework
CLARITY does not replace that; it addresses broader token-market structure
Exchanges, brokers, dealers
No fully settled crypto-wide market-structure framework
Registration paths and provisional status for digital commodity intermediaries
Token disclosures
Patchy and contested expectations
More tailored disclosure rules for qualifying digital commodities
Blockchain classification
Ongoing debate over how to treat different networks
A statutory path for identifying whether a blockchain system is mature
The bill’s immediate relevance is strongest in spot-market structure and token-market treatment. Once that structural aim is understood, the market’s optimism becomes easier to assess.
For larger institutions and compliant exchanges, this could make the market easier to enter and operate in. However, for firms that have benefited from regulatory uncertainty, it could mean a tougher environment.
How Cryptocurrency Markets will React
The market sees CLARITY as supportive for one main reason: it could make crypto trading infrastructure easier to defend, operate, and scale in the US.
Secondary trading could become clearer If exchanges and market makers gain more confidence that trading a token after issuance is not automatically a securities transaction, that would remove one of the biggest legal overhangs on US token markets.
Disclosures could become more tailored The bill does not force every crypto project into a traditional stock-market model. Instead, it creates a more crypto-specific route for qualifying digital commodity activity.
The impact goes beyond Bitcoin CLARITY is aimed at token-market structure more broadly, which means the potential benefit sits across the wider crypto market rather than only in the largest names.
That said, this remains an early-stage story. Markets can reasonably interpret CLARITY as a sign that US lawmakers are moving closer to a more durable digital-asset framework. But that is not the same thing as having that framework in place.
This distinction matters because legislation does not move in a straight line. The House bill gives one view of how the crypto market structure could be organised, but the Senate has not simply adopted that version.
Liquidity Risk Sensitivity in Crypto
The market is still reacting to a direction of travel rather than a final destination.
If CLARITY continues to drive headlines, the products most likely to react are generally altcoin-linked instruments rather than the broad crypto complex as a whole. The reason is straightforward: regulatory clarity tends to matter most where legal uncertainty has been most visible.
That creates a useful distinction between benchmark crypto exposure and regulation-sensitive altcoin exposure. Bitcoin may still reflect the broader mood of the sector, but many altcoins sit closer to the specific questions CLARITY is trying to answer. As a result, they may show stronger sensitivity if traders begin to price in changes around market access, legal treatment, or exchange confidence.
The closer an asset sits to the questions of listing support, exchange treatment, and token-market structure, the more relevant CLARITY becomes to how traders interpret its outlook.
If the market starts to distinguish between broad crypto sentiment and regulation-linked token sentiment, that would be one of the clearest signs that traders are moving beyond politics and beginning to price structure.
This week’s market outlook has already shown it can respond to the idea of progress. The next stage is whether it responds to substance.
On balance, CLARITY points toward a more structured direction for US crypto regulation. The real test remains what survives Senate negotiations, how the final text divides regulatory authority, and how workable those rules look once translated from legislative language into actual market practice.
Scenario
What it would mean
Likely market reaction
Bullish scenario: Senate alignment improves
The Senate moves closer to the House framework and preserves the bill’s core market-structure logic
Positive for altcoin sentiment, exchange-linked tokens, and regulation-sensitive crypto products
Base case: Progress continues, but slowly
CLARITY stays alive politically, but final wording and timing remain uncertain
Intermittent upside bursts on headlines, but no clean repricing across the market
Bearish scenario: Talks stall or the bill is diluted heavily
The market loses confidence that CLARITY will deliver a meaningful framework soon
Short-term disappointment, weaker sentiment in altcoins, and fading enthusiasm around regulation-driven trades
Until those answers become clearer, the most sensible stance is neither blind celebration nor outright dismissal, but disciplined attention to where the market is starting to draw its own lines.
What the CLARITY Act Means for Crypto CFD Trading
While the CLARITY Act debates whether altcoins like SOL or ADA are “securities” or “commodities,” crypto CFD (Contract for Difference) traders are largely unaffected. CFD traders speculate on price movements rather than owning the underlying tokens, meaning they are not subject to custody or wallet-registration requirements currently being debated in the Senate.
At the same time, regulatory headlines such as the March 8 delay can trigger sharp price swings. With crypto CFDs, traders can go long if there are signs of a Senate breakthrough, or go short if political delays weaken market sentiment.
For crypto CFD traders, the CLARITY Act is therefore less about immediate product changes and more about volatility and sentiment in the broader crypto market.
Expected Impact by Asset Tier
Impact Level
Assets
Rationale
Tier 1 (High)
SOL, ADA, BNB, UNI
Highest sensitivity to security vs. commodity classification.
Established networks with existing institutional alignment.
For traders looking to navigate this uncertainty:
Monitor the SAVE Act: If it passes quickly, the CLARITY Act could move back to the front of the queue.
Focus on Tier-1 Altcoins: Assets like SOL, BNB, and ADA remain the most sensitive to CLARITY Act headlines.
Leverage CFD Flexibility: Use the agility of CFDs to hedge against or capitalise on regulatory delays.
Download the VT Markets app to monitor real-time price action in the CFD cryptocurrency market.
CLARITY Act Refresher
What is the CLARITY Act of 2025?
The CLARITY Act is a proposed US federal framework designed to establish a formal market structure for digital assets. Its primary function is to reclassify Digital Commodities under the jurisdiction of the Commodity Futures Trading Commission (CFTC), effectively separating them from SEC Investment Contracts.
Is the CLARITY Act already law?
No. As of March 10, 2026, the House-passed CLARITY Act is not yet law. It passed the US House of Representatives in July 2025, but Senate negotiations are still ongoing, which means the final version and timing remain uncertain.
What is the CLARITY Act in simple terms?
The CLARITY Act is a proposed US crypto market-structure bill. Its main goal is to create clearer rules around digital commodities, token issuers, exchanges, brokers, dealers, and regulatory oversight, with a larger role for the CFTC in parts of the digital-asset market.
Why is the CLARITY Act seen as positive for crypto?
Many market participants view the CLARITY Act as positive because it could replace regulatory ambiguity with a more structured framework. Clearer rules may support exchange confidence, improve secondary trading conditions, and make it easier for institutions and compliant firms to participate in the crypto market.
Why are traders still cautious about the CLARITY Act?
Traders are still cautious because the bill has not completed the legislative process. Senate negotiations have faced delays and disagreements, so there is still uncertainty around what the final market structure will look like and how the rules would be implemented in practice.
Could the CLARITY Act affect altcoins more than Bitcoin?
Potentially, yes. Altcoins may be more sensitive because the bill is closely tied to token-market structure, listings, exchange access, and disclosure treatment across the wider digital-asset market. That means regulatory clarity could have a stronger effect on tokens that have faced more legal or listing uncertainty.
What is the current status of the CLARITY Act in 2026?
House Status: The bill successfully passed the US House of Representatives on July 17, 2025.
Senate Status: As of March 10, 2026, the bill remains stalled in the Senate due to disagreements over stablecoin rewards and Anti-Money Laundering (AML) provisions.
Legal Standing: The act is not yet law; it is currently a legislative proposal undergoing intense negotiation
Does the CLARITY Act directly affect crypto CFDs?
Not directly in the same way it affects US spot digital-asset market structure. For crypto CFD traders, the main relevance is likely to come through sentiment, volatility, liquidity, and price action in the underlying crypto market rather than a direct rewrite of the CFD product itself. At VT Markets, we provide a regulated and reliable trading platform to continue Crypto CFD trading.
Start trading now – Click here to create your real VT Markets account
Australia’s consumer inflation expectations rose to 5.2% in March, up from 5.0% previously. This indicates a 0.2 percentage point increase month on month.
This morning’s data showing consumer inflation expectations rising to 5.2% is a notable shift. It suggests that the fight against inflation is far from over, complicating the Reserve Bank of Australia’s path forward. This figure challenges the view that price pressures were steadily easing, a narrative we have been following since the persistent inflation battles of 2024 and 2025.
Implications For Rate Cut Pricing
For interest rate traders, this means we should re-evaluate the pricing of RBA rate cuts for the remainder of 2026. The market may now begin to price out any easing that was anticipated for the second half of the year, potentially pushing short-term bond yields higher. We should consider positions that benefit from the RBA holding its current cash rate of 4.10% for an extended period.
In the currency market, this data is supportive of the Australian dollar. A more hawkish RBA relative to other central banks, like the US Federal Reserve which has signaled a pause, could push the AUD/USD cross higher. We saw this dynamic play out repeatedly in 2025 when rate differentials drove currency strength, and we could see a test of the 0.6800 level in the coming weeks.
This environment creates a headwind for equities, so we should anticipate increased volatility in the ASX 200. Higher-for-longer interest rates tend to pressure company valuations, especially in the growth and technology sectors. Using index options to hedge long portfolios or to position for a potential pullback from the recent highs near 7,900 points would be a prudent strategy.
The RICS UK housing price balance measured **-12%** in February. This was below the forecast of **-9%**.
The result points to a weaker reading than expected for that month. It indicates that more survey respondents reported price falls than rises.
Uk Housing Market Signal
The latest RICS housing data is worse than expected, signaling persistent weakness in the UK property market. This negative reading of -12% reinforces the view that higher borrowing costs are weighing heavily on consumer demand. For us, this increases the probability of a more dovish stance from the Bank of England in its upcoming meetings.
We should consider increasing positions that bet on lower future UK interest rates, possibly through SONIA futures contracts. With the latest GDP figures showing the economy stagnated in the last quarter and CPI inflation easing to 2.8%, this poor housing data could be the catalyst for the BoE to signal rate cuts sooner than the market currently prices. This continues the trend of economic softening we saw build throughout 2025.
The outlook for the British Pound is now more bearish, and we should look at positioning for further downside against the US dollar. We could build positions by buying GBP/USD put options to hedge against or profit from a decline. A weaker housing market often acts as a significant drag on the currency, a lesson we saw reinforced during the downturn in 2024 and 2025.
We see heightened risk for UK domestic stocks, particularly in the homebuilding and banking sectors which are sensitive to property market health. Buying put options on the FTSE 250 index, which has greater exposure to the UK economy than the FTSE 100, could be a prudent move. This data confirms the challenges for these sectors, which struggled for much of 2025 under similar pressures.