EUR/USD fell for a second day and was down 0.38% at 1.1567 after failing to break the 200-day simple moving average (SMA) near 1.1672. The move followed broad US Dollar strength, helped by expectations of no near-term Federal Reserve rate cut and higher US Treasury yields.
The pair has moved sideways after peaking near 1.2082 on 27 January, then pulling back towards 1.1700. It then formed lower highs and lower lows, reached 1.1507, and rebounded to the current level.
Technical Levels And Trend
EUR/USD is now trading below the 200-day SMA at 1.1672, after moving above it on 3 March. A drop below 1.1500 may open support at the 5 November 2025 daily low of 1.1468, then 1.1450, and next 1.1391 from 1 August 2025.
On the upside, price may need to regain 1.1600 to retest 1.1672. If it moves above both levels, resistance is seen at 1.1700.
Given the EUR/USD has fallen below its 200-day moving average, we see a bearish outlook for the coming weeks. The failure to hold above 1.1672 suggests weakening momentum, a view supported by recent data showing US 10-year Treasury yields firming around 4.6% and a slightly hotter-than-expected US CPI reading last week. This reinforces the idea that the Federal Reserve will not be in a rush to cut interest rates.
For derivative traders, this environment favors strategies that profit from a decline or stagnation in the euro. We believe buying put options with strike prices at or below the key 1.1500 psychological level is a direct way to position for further downside. Expiration dates in late April or May 2026 would provide enough time for the pair to test the lower support targets mentioned.
Options Strategies For A Bearish Bias
Another approach is to establish bear call spreads to capitalize on the strong resistance overhead. By selling a call option with a strike price near 1.1650 and buying a protective call at 1.1700, we can generate income if the EUR/USD stays below our sold strike. This strategy has a defined risk and benefits from time decay as long as the pair remains capped by the 200-day average.
Looking back at the price action in 2025, we recall that a sustained break of the 200-day average often preceded a multi-week trend. The lows from November 2025 at 1.1468 and August 2025 at 1.1391 are not just lines on a chart; they are significant levels that could be revisited if the 1.1500 floor gives way. Traders should therefore watch this 1.1500 level closely as a trigger for a potential second leg down.
However, we must manage the risk that this bearish view is wrong. Any strong daily close back above the 1.1600 handle would be the first sign of a bullish reversal, signaling that bearish positions should be reduced or closed. If the pair were to reclaim the 200-day SMA at 1.1672, it would invalidate our current bearish thesis entirely.
Create your live VT Markets account and start trading now.
Start trading now – Click here to create your real VT Markets account
New Zealand’s manufacturing sales fell by 0.5% in the fourth quarter. This followed a 1.1% rise in the previous quarter.
The latest figure shows a shift from growth to decline between the two quarters. No further breakdown or cause was provided in the data shared.
Manufacturing Data Signals Broader Slowdown
The drop in manufacturing sales to -0.5% for the fourth quarter of 2025 is a clear signal of a contracting New Zealand economy. This negative turn suggests that domestic and international demand is weakening more than previously thought. We are now watching for signs that this weakness is spreading to the broader services sector, increasing the risk of a recession in the first half of 2026.
This data strongly suggests the Reserve Bank of New Zealand will shift to a more dovish stance. With recent inflation data from February showing a decline to 2.8%, well within the target band, the RBNZ has the justification it needs to consider cutting the Official Cash Rate from its current 4.25%. We should therefore be positioning for lower interest rates, anticipating that interest rate futures will begin pricing in a rate cut by the May meeting.
A dovish RBNZ makes the New Zealand dollar significantly less attractive, and we expect it to underperform. The NZD/USD exchange rate, currently hovering around 0.6250, is vulnerable to a sharp decline as interest rate differentials favor the US dollar. Traders should consider buying put options on the NZD to protect against or profit from a slide towards the 0.6000 level.
This economic slowdown will also weigh heavily on the New Zealand equity market. Companies on the NZX 50, especially those in the industrial and consumer discretionary sectors, are likely to see their earnings forecasts revised downwards. We can use index futures to initiate short positions, or buy put options on the index, to hedge against a market downturn in the coming weeks.
Historically, as seen during the economic slumps following 2008 and 2020, the RBNZ has not hesitated to cut rates aggressively to support the economy. The market tends to anticipate these moves well in advance of the official announcements. Waiting for confirmation from the RBNZ is a losing strategy; the profitable move is to act now on this leading manufacturing data.
Higher oil prices and South Korea’s reliance on Middle Eastern crude have increased volatility in the won. USD/KRW has traded between 1,420 and 1,500 since December 2025.
Year-to-date, KRW is down 1.8% against the US dollar. The Bank of Korea has warned that intervention risks are rising as it views recent won moves as diverging from economic fundamentals.
The central bank is expected to keep interest rates unchanged for now. It is also expected to adopt a wait-and-see approach while focusing on foreign exchange stability.
Market support may include smoothing operations in both the onshore and offshore KRW markets. This could be backed by the central bank’s foreign exchange reserves.
With Brent crude futures trading above $115, the pressure on the Korean won is intensifying due to our high dependence on imported oil. Data from late 2025 confirmed that nearly 70% of our crude imports originated from the Middle East, explaining why the USD/KRW pair has been stuck in a volatile 1,420 to 1,500 range. This situation makes the won particularly vulnerable to global energy shocks.
The Bank of Korea is now signaling it has reached its limit with the won’s depreciation. Following the 1.8% drop against the dollar so far this year, the central bank’s recent hawkish warnings indicate a growing readiness to intervene directly in the currency markets. They see the won’s current level as disconnected from the nation’s solid economic fundamentals.
For derivative traders, this means the 1,500 level for USD/KRW is shaping up to be a strong ceiling. Selling call options or implementing bear call spreads with strike prices above this psychological barrier could be an effective strategy in the coming weeks. The BoK’s posture suggests that significant further upside for the pair will be met with resistance.
We should not doubt their ability to follow through, as the latest figures show foreign exchange reserves stand at a substantial $415 billion. We saw similar smoothing operations during the volatility of 2022 and 2023, providing a clear historical precedent for their interventionist playbook. This strong financial backing gives their verbal warnings real teeth.
While the central bank’s tone is hawkish, an actual interest rate hike seems unlikely for now. February’s headline inflation report, which showed an acceleration to 3.5%, justifies the tough talk, but the BoK appears to prefer using its reserves rather than monetary policy to combat this externally-driven price pressure. Therefore, the focus for traders should remain squarely on spotting signs of direct FX intervention.
Start trading now – Click here to create your real VT Markets account
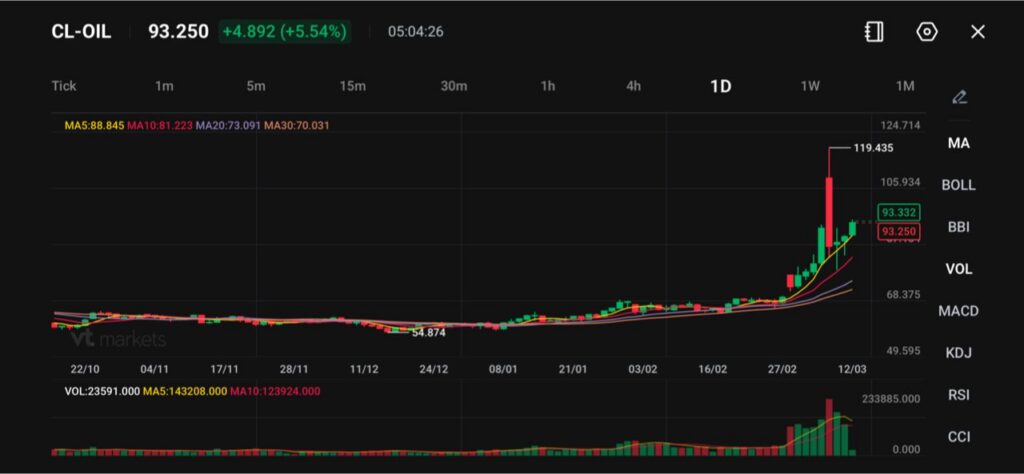
CL-OIL trades at 93.250, up +4.892 (+5.54%), with MA5 88.845, MA10 81.223, MA20 73.091, MA30 70.031.
The IEA plans to release 400 million barrels from reserves, while the US will release 172 million barrels from its Strategic Petroleum Reserve starting next week.
The US release will take roughly 120 days, averaging around 1.4 million barrels per day, while total coordinated supply may reach 3.3 million b/d, which ING says is still far below Gulf supply losses.
Oil prices remain firm even after policymakers unveiled a coordinated reserve release. The International Energy Agency plans to release 400 million barrels from emergency reserves to stabilise markets shaken by supply disruptions in the Persian Gulf.
The United States will contribute 172 million barrels from its Strategic Petroleum Reserve, with the release beginning next week. ING estimates the release will unfold over roughly 120 days, equating to around 1.4 million barrels per day from the US alone.
The U.S. will release 172 million barrels of oil from the Strategic Petroleum Reserve to help lower energy costs during the Iran war, Energy Secretary Chris Wright said Wednesday evening. https://t.co/ATXWJCSpfBpic.twitter.com/douOqnWlXb
However, the strategy appears too small to offset the disruption. If other countries follow a similar schedule, ING calculates the combined release may reach 3.3 million b/d. That remains well below the supply losses currently linked to the Persian Gulf conflict.
As conflict chokes off oil exports from the Persian Gulf, world leaders have decided to release emergency petroleum stockpiles. Here's what to know https://t.co/kEZyp8lvdb
This mismatch between policy action and physical supply loss explains why oil continues to trade with a strong risk premium.
If disruptions persist and reserve releases remain smaller than lost supply, crude may stay elevated even as governments attempt to stabilise prices. If shipping flows resume and exports recover, the reserve release could accelerate a pullback.
Supply Losses Continue to Dominate Oil Pricing
The core driver remains the scale of disrupted Middle East supply. Strategic reserves can smooth short-term shocks, but they rarely replace long-term production losses.
Markets tend to view emergency reserves as temporary relief rather than structural supply. If the conflict continues to constrain exports from the Persian Gulf, traders will keep pricing oil around the expected shortfall rather than the policy response.
Iran said the world should be ready for oil at $200 a barrel as its forces hit merchant ships in the Gulf. Meanwhile, the International Energy Agency recommended a massive release of strategic reserves to dampen one of the worst oil shocks since the 1970s https://t.co/rYini96IOLpic.twitter.com/ACPraRaBju
Even with coordinated intervention, the market is effectively facing a supply deficit that exceeds the 3.3 million b/d cushion policymakers may provide.
As long as Gulf supply remains impaired, oil may trade with sharp upward bursts. If production or shipping routes reopen faster than expected, prices could fall quickly as the market unwinds the geopolitical premium.
Technical Analysis
WTI crude oil (CL-OIL) is trading near $93.25, up roughly 5.54%, as prices continue to rebound following the sharp correction from the spike to $119.43. The market has stabilised above the $90 level after last week’s volatility, suggesting that buyers are attempting to reassert control following the rapid surge and pullback.
From a technical standpoint, oil remains firmly above its key moving averages. The 5-day moving average (88.85) and 10-day (81.22) are both rising steeply, while the 20-day (73.09) and 30-day (70.03) remain well below current prices. This wide separation between price and the longer-term averages reflects the strength of the recent bullish breakout and indicates that the broader trend remains upward despite short-term volatility.
Immediate resistance now sits around $100–$105, which marks the upper portion of the recent consolidation range following the spike. A break above this zone could reopen the path toward $110–$119, where the previous rally peaked.
On the downside, initial support is seen near $90, followed by stronger support around $85, which aligns with the recent breakout structure and the rising short-term moving averages.
Overall, oil markets remain highly volatile but structurally bullish, with prices attempting to build a new base above the $90 region. Holding above this level would reinforce the current recovery phase, while a sustained move above $100 could signal renewed bullish momentum in the energy market.
Policy Versus Physical Supply
The coordinated reserve release represents a clear attempt by policymakers to prevent a full-scale energy shock. Yet the numbers underline the challenge: 400 million barrels of reserves spread over months cannot fully offset lost exports if major Gulf producers remain constrained.
Energy markets tend to respond most strongly to real-time flows rather than policy signals. Until traders see sustained shipping through key export routes, particularly those tied to Gulf supply, the reserve plan alone may struggle to cap volatility.
Reserve releases can slow price spikes and reduce panic buying. However, if geopolitical risk continues to disrupt exports, crude may remain volatile and sensitive to any news on shipping routes, production recovery, or further policy intervention.
Learn more about trading Energies on VT Markets here.
FAQs
What is the IEA Planning to Do With Oil Reserves? The International Energy Agency plans a coordinated release of 400 million barrels of oil from emergency reserves to ease market stress linked to supply losses from the Persian Gulf.
How Much Oil Will the US Release From Its Strategic Petroleum Reserve? The US will begin releasing 172 million barrels from its Strategic Petroleum Reserve starting next week.
How Long Will the US Release Take, and What is the Daily Rate? ING estimates the US release will take roughly 120 days. That works out to around 1.4 million barrels per day.
How Big is the Total Coordinated Release in Barrels Per Day? ING estimates that if other countries follow a similar timeline, the combined release could average 3.3 million b/d.
Why Can Oil Prices Rise Even When Governments Release Reserves? Markets price the gap between supply and demand, plus risk. If the disrupted Gulf supply exceeds the expected 3.3 million b/d relief flow, traders can keep bidding oil higher because the deficit still exists.
Start trading now – Click here to create your real VT Markets account
USD/CHF rose for a second day on Wednesday, gaining over 0.25% after the latest US inflation report. Higher energy prices pushed US Treasury yields and the US Dollar up, with the pair trading near 0.7800.
The pair moved above 0.7800 to a two-day high, but buyers have not cleared resistance at 0.7817, the latest cycle high. The RSI shows bulls gaining strength, though the broader momentum still favours sellers.
Key Resistance And Momentum
A daily close above 0.7800 would set the next resistance at the March 3 high of 0.7878. Further levels above are 0.7900 and 0.8000.
Support sits at the March 6 low of 0.7750. Below that, a trendline from current-year lows around 0.7601 runs through the 0.7670 to 0.7700 zone, and a break there would expose the January 28 swing low of 0.7601.
A correction dated March 11 at 20:59 GMT stated the March 3 high was 0.7878, not 0.7817.
The USD/CHF is showing bullish strength, echoing a familiar pattern. The latest February 2026 Consumer Price Index reading of 3.4% has pushed US Treasury yields higher, strengthening the dollar. This situation is further intensified by WTI crude prices, which have recently surpassed $85 per barrel.
Options Positioning And Policy Divergence
We are seeing a setup reminiscent of this time in 2025, when the pair struggled around the 0.7800 level. Back then, a push above key resistance was needed to confirm bullish momentum. A similar challenge faces us now, making a daily close above 0.7800 a critical signal for traders.
For derivative traders, this suggests considering call options with strike prices just above the current resistance. Buying calls with strikes near 0.7850 or even 0.7900 could be a viable strategy to capitalize on a potential breakout. This approach allows for participation in upward movement while defining risk to the premium paid.
Conversely, if the pair fails to hold above 0.7800, traders should be prepared for a slide. Looking back at the 2025 analysis, a break below 0.7750 signaled further weakness. Therefore, purchasing put options with a strike below that level could serve as a hedge or a speculative play on momentum failing.
Implied volatility is likely to increase around upcoming central bank announcements. The Federal Reserve’s recent hawkish tone contrasts with the Swiss National Bank’s signals for potential easing. This policy divergence strongly supports a continued upward path for the USD/CHF in the coming weeks.
Create your live VT Markets account and start trading now.
Start trading now – Click here to create your real VT Markets account
AUD/NZD traded near 1.2100 on Wednesday and reached its highest level in 13 years, amid market disruption linked to conflict involving Israel, the US and Iran. The pair was quoted at 1.2091 on a 4-hour chart.
The Reserve Bank of Australia lifted the Official Cash Rate by 25 bps to 3.85% after its February meeting. It expects inflation to peak around Q2 2026 and return to the midpoint of the 2–3% target by 2028.
Central Bank Divergence And Market Pricing
In New Zealand, markets are pricing in several interest rate rises this year after a shift from last month’s guidance that the OCR could stay near 2.25% all year. New Zealand Manufacturing Sales for Q4 2025 and Australian Consumer Inflation Expectations for March are due next.
The International Energy Agency said it would release 400 million barrels of oil from strategic reserves to address shortages linked to the Iran war. The report also noted differing central bank paths as a factor affecting the Kiwi.
On the 4-hour chart, price stayed above rising 20- and 100-period SMAs, while RSI was above 70. On the 1-hour chart, RSI was near 76, with resistance at 1.2107 and support at 1.2080, 1.2020, and 1.1980.
Given the current geopolitical turmoil and central bank divergence, we are witnessing a significant rally in the AUD/NZD pair, which is now testing a 13-year high near 1.2100. The Australian dollar is benefiting from its status as a commodity currency, especially with the IEA’s decision to release strategic oil reserves. This backdrop suggests that the path of least resistance for the pair remains upward.
Options Positioning And Key Levels
The monetary policy gap between Australia and New Zealand is a primary driver of this move. We see the Reserve Bank of Australia having already acted decisively, raising its cash rate to 3.85% last month to combat persistent inflation. In contrast, while the market now expects the Reserve Bank of New Zealand to hike rates, it is playing catch-up from a much more cautious stance communicated just last month.
To make this view more credible, we only need to look at the latest data from the fourth quarter of 2025. Australia’s CPI came in at a sticky 4.1%, while New Zealand’s economy showed signs of strain with a 0.2% contraction in GDP. This combination of stubborn Australian inflation and New Zealand’s economic weakness reinforces the case for continued AUD outperformance.
For derivative traders, this environment favors strategies that profit from continued upward movement. Buying call options with a strike price above the current market, perhaps around 1.2150, offers a way to capitalize on further gains with a defined and limited risk. This is particularly attractive given the strong upside momentum we’ve observed.
However, the overbought readings on the RSI indicator, which is above 70, call for some caution. A bull call spread could be a more prudent approach, involving buying a call at 1.2100 and simultaneously selling one at a higher strike like 1.2200 to reduce the initial cost. This strategy caps potential profit but provides a buffer if the rally pauses or pulls back slightly from these highs.
Looking ahead in the coming weeks, the upcoming Australian Consumer Inflation Expectations for March will be a critical data point. A high reading would likely cement expectations for further RBA hawkishness, providing the fuel needed to break through the immediate resistance at 1.2107. We should position ourselves for this potential catalyst while using the 1.2080 level as a key area of short-term support.
Create your live VT Markets account and start trading now.
Start trading now – Click here to create your real VT Markets account
The Australian dollar rose on Wednesday as rate-rise expectations for the Reserve Bank of Australia increased. AUD/USD traded at 0.7152, up 0.47%.
Markets remained focused on Middle East developments, including increased hostilities between Israel and Hezbollah in Lebanon. In an Axios interview, US President Donald Trump said there are no targets left in Iran and that “any time I want it to end, it will end.”
Oil Prices And Inflation Pressure
WTI oil traded at $87.57 a barrel, up nearly 5%, after reversing earlier moves. The International Energy Agency recommended tapping 400 million barrels, and Lloyd’s of London said ships in the Strait of Hormuz will be insured.
Bank of America, Goldman Sachs, Westpac and National Australia Bank expect an RBA rate rise next week. RBA Deputy Governor Andrew Hauser said there would be a “genuine” debate at the meeting and that “inflation is too high”.
US February inflation matched forecasts, with CPI at 2.4% year on year and core CPI at 2.5% year on year. Upcoming releases include Australian Consumer Inflation Expectations and US jobless claims, housing data and the balance of trade.
AUD/USD support levels were noted near 0.7120, 0.7050 and 0.7000, with resistance near 0.7200 and 0.7275. A move below 0.7050 was described as a risk to the upward bias.
Trade Strategy And Risk Management
Based on the strengthening RBA hike bets, we see a clear opportunity in the AUD/USD. The swaps market, as of early March 2025, is now pricing in an over 80% probability of a 25-basis-point hike at next week’s meeting. This strong expectation should continue to support the Australian dollar.
Geopolitical tensions in the Middle East are a key catalyst, pushing WTI crude prices up nearly 15% since the beginning of February 2025. This oil shock directly fuels concerns about imported inflation in Australia, adding significant pressure on the RBA to act. We believe the market is correctly interpreting this as a hawkish signal for the central bank.
Meanwhile, the US February CPI data appears outdated as it does not capture the recent spike in energy costs. While US inflation held at 2.4%, we anticipate future reports will reflect higher prices, but the immediate narrative favors AUD strength. This divergence in real-time inflation pressures gives the Aussie a temporary advantage.
Given this outlook, we are positioning for further upside by buying AUD/USD call options with strike prices near the 0.7200 level. These positions allow us to profit from a continued rally toward the 0.7275 resistance over the next several weeks. The current positive momentum, confirmed by the technicals, supports initiating these bullish trades.
To manage risk, we are considering bull call spreads to cap potential losses if the RBA delivers a surprise hold. A daily close below the 0.7120 support would be our first signal to reduce exposure. Any deeper break below 0.7050 would invalidate the immediate bullish thesis and prompt us to exit the position.
Create your live VT Markets account and start trading now.
Start trading now – Click here to create your real VT Markets account
Tensions involving the US, Israel and Iran drove fresh volatility in oil. Iran kept the Strait of Hormuz closed and attacked three vessels near it on Wednesday, while Iran’s military said oil could reach $200 a barrel.
The IEA recommended releasing 400 million barrels to curb rising prices. WTI traded near $87 per barrel after reaching a three-year high just under $120 on Monday.
Oil Volatility And Geopolitical Risk
US February CPI rose 0.3% month on month, matching expectations and up from 0.2% in January. Inflation remained above the Fed’s 2% target, supporting a cautious policy stance.
The US Dollar Index traded near 99.20, recovering earlier weekly losses. The dollar’s strongest move was against the Japanese yen.
EUR/USD traded near 1.1570 after giving up earlier gains. GBP/USD traded near 1.3410 and was little changed in the US session.
USD/JPY traded near 156.90, close to a one-month high, alongside higher US Treasury yields. USD/CAD traded near 1.3590 ahead of Canada’s February jobs data on Friday and February CPI next Monday, before a BoC decision next Wednesday.
Dollar Strength And Rate Differentials
Gold traded at $5,167 and was down on the day. Key releases include UK January industrial production, US housing data and jobless claims on 12 March, and UK January GDP plus US PCE, GDP and Michigan data on 13 March.
Looking back at the Iran conflict in March 2025, we saw oil volatility drive markets as WTI crude approached $90. One year later, tensions in the Strait of Hormuz remain a key risk, and any escalation could trigger a similar flight to safety. Derivative traders should consider using options to hedge against sudden spikes in oil, as OPEC+ has already shown a willingness to manage supply tightly, with their January 2026 production cut of 1 million barrels per day keeping WTI firm above $82.
The US inflation data from February 2025 reinforced the Federal Reserve’s cautious stance, a theme that has dominated the past year. We have seen inflation cool, with the latest February 2026 Consumer Price Index reading at 2.9%, but this is still well above the 2% target. Consequently, the Fed has only delivered two small rate cuts, holding the policy rate at 4.75% and supporting long-term US dollar strength.
This environment means the US Dollar Index, which rallied to 99.20 during the 2025 crisis, continues to find support at higher levels, currently trading around 104.50. The dollar’s strength is now less about a pure safe-haven dash and more about its yield advantage over other major currencies. We should anticipate that any sign of global economic weakness will likely funnel more capital into the dollar, making long positions attractive.
The surge in USD/JPY to nearly 157.00 last March highlighted the extreme sensitivity of the yen to US Treasury yields. That dynamic is still in play, as the interest rate gap between the US and Japan remains historically wide, even with minor policy shifts from the Bank of Japan. This makes selling yen volatility or maintaining carry trade positions a viable strategy, though we must remain vigilant for intervention.
Last year’s events saw the EUR/USD drop back toward 1.15 as traders sought the dollar’s safety. Today, the euro’s weakness is more tied to sluggish Eurozone industrial production figures, which contracted by 0.5% in the last quarter of 2025. Meanwhile, USD/CAD continues to be heavily influenced by oil prices and Bank of Canada policy, which is expected to diverge further from the Fed in the coming months.
Create your live VT Markets account and start trading now.
Start trading now – Click here to create your real VT Markets account
China relies on imported energy and may face disruptions to oil and LNG supply from the Middle East, including risks linked to Iran. China imports 73% of its oil, with about 40% of those imports coming from the Middle East, mainly Saudi Arabia and Iraq, and about 10% coming from Iran.
Around one-third of oil and around one-quarter of LNG passing through the Strait of Hormuz is destined for China. Chinese officials have called on ‘all sides’ of the Iran war to reduce military operations, avoid escalation, and ensure safe passage for ships through the strait.
Energy Supply Buffers And Diversification
China has built buffers by stockpiling energy when prices were lower, with total oil reserves estimated at about 80 days of consumption. Its import mix is also spread across suppliers, and it may be able to raise oil imports from Russia.
China also uses more non-fossil power, with renewable electricity rising to almost 40% in 2025. In response to the Middle East conflict, the government told large refiners to suspend exports of diesel and petrol.
Higher oil and gas prices could raise inflation, though China’s starting point is lower than the US or Europe. A firmer inflation path could lead the People’s Bank of China to be more cautious about further piecemeal monetary easing.
Given the persistent Middle East tensions from last year, we see energy costs directly constraining the People’s Bank of China. With Brent crude holding stubbornly above $95 a barrel this month, the risk of imported inflation is very real. China’s February CPI data confirmed this trend, coming in at 1.8% and marking the third straight monthly rise.
Market Implications For Policy And Assets
This sustained price pressure suggests the PBoC will be very cautious about further monetary easing in the coming weeks. Unlike the broad-based easing we saw after the 2022 energy crisis, the current environment seems to be tying the bank’s hands. We should therefore adjust expectations for rate cuts, which will be reflected in yuan-denominated interest rate swaps.
For currency traders, this limited scope for easing provides a floor for the yuan, making bets on its significant weakness a risky proposition. The interest rate differential with the US dollar is unlikely to widen substantially from here. This may lead us to consider strategies that profit from a stable or slightly strengthening yuan against the dollar.
This scenario is also a headwind for Chinese equities, which often rely on policy support to move higher. The ongoing uncertainty is reflected in the market, with implied volatility on Hang Seng Index options climbing 15% since the start of the year. We are likely to see traders hedge their stock portfolios by purchasing put options on key Chinese indices.
Create your live VT Markets account and start trading now.
Start trading now – Click here to create your real VT Markets account
Political uncertainty in Poland is rising, with reports of possible vetoes affecting EU defence funding legislation. The government has indicated it may need an alternative “plan B” if a veto blocks the bill.
The opposition party Law and Justice (PiS) has chosen former education minister Przemyslaw Czarnek as its prime ministerial candidate for the autumn 2027 general election. The bank noted PiS did not select a more moderate figure from the party wing linked to former prime minister Mateusz Morawiecki.
Commerzbank forecasts the Polish zloty will lag behind its regional peers over the coming year due to domestic political risks. The article says it was produced with an AI tool and reviewed by an editor.
Growing political friction in Poland suggests the zloty will continue to lag behind other regional currencies. The selection of a hard-right candidate for the 2027 election by the opposition party signals a strategy of confrontation, not compromise. This deepens the political instability we have been monitoring for months.
This outlook holds even as the National Bank of Poland has kept interest rates elevated at 5.75% for over a year. While inflation has cooled from its 2025 peaks, it remains stubbornly above the central bank’s target, creating a difficult environment. The zloty’s failure to gain ground despite this high yield highlights how much political risk is weighing on the currency.
Considering these factors, shorting the zloty against its peers, like the Czech koruna, appears to be a sound strategy. We saw the zloty underperform the koruna through the final months of 2025, and this trend is likely to continue. This relative value trade isolates the specific political risk in Poland from broader regional sentiment.
The rising uncertainty also suggests an increase in currency volatility. Three-month implied volatility for the euro-zloty pair has already crept up from around 6% to nearly 8% since the start of the year. Buying zloty put options could be an effective way to position for a sharp move weaker in the coming weeks.
A key near-term catalyst to watch is the potential veto of EU funding legislation. We recall similar disputes over rule-of-law issues throughout 2025, and another blockage would almost certainly trigger a negative reaction in the currency. This makes holding bearish positions particularly relevant right now.
The political maneuvering ahead of the 2027 election is not a short-term issue and will create a persistent headwind for the currency. Any periods of zloty strength in the coming weeks should be viewed as opportunities to sell. The long-term political picture appears to be deteriorating, not improving.
Start trading now – Click here to create your real VT Markets account