Germany’s industrial production fell by 1.2% year on year in January, on a non-seasonally adjusted and working-day adjusted basis.
This compares with a previous year-on-year decline of 0.6%, showing a larger drop in the latest reading.
More Defensive Positioning
The decline in German industrial production is accelerating, pointing to deepening economic weakness in Europe’s largest economy. This negative trend, worsening from -0.6% to -1.2% year-over-year, suggests we should adopt a more defensive posture. It signals that companies central to the German economy are struggling.
Given this, we should consider downside protection on German equities. The DAX index is particularly vulnerable as it is heavily weighted towards industrial and manufacturing giants. Establishing short positions in DAX futures or purchasing put options could hedge against a further market decline in the coming weeks.
This view is supported by the most recent February manufacturing PMI data, which registered a contractionary 45.2. This confirms the negative trend is not an isolated January event but is continuing. It shows that new orders are weak and business confidence is low across the sector.
The weakness in Germany will likely weigh on the common currency. A slowing German engine acts as a drag on the entire Eurozone economy, creating a bearish outlook for the Euro. We should therefore anticipate further weakness in the EUR/USD pair.
Persistently high energy costs are a major factor, with European natural gas futures still trading over 30% higher than their pre-2024 averages. This continues to squeeze margins for energy-intensive industries, directly impacting their output. This structural issue shows no signs of immediate resolution.
Rates And Bonds Implications
This poor economic data makes it much less likely the European Central Bank will consider raising interest rates. In fact, interest rate markets are now pricing in less than a 10% chance of an ECB rate hike by mid-year. This environment supports holding long positions in German government bond futures, which benefit from a flight to safety and dovish central bank policy.
We must remember the pattern observed in the third quarter of 2025, when a similar drop in industrial orders preceded a broader slowdown in GDP growth. The current data feels like a repeat of that period, suggesting we should take this signal seriously. It indicates a high probability of a challenging economic environment ahead.
Create your live VT Markets account and start trading now.
Start trading now – Click here to create your real VT Markets account
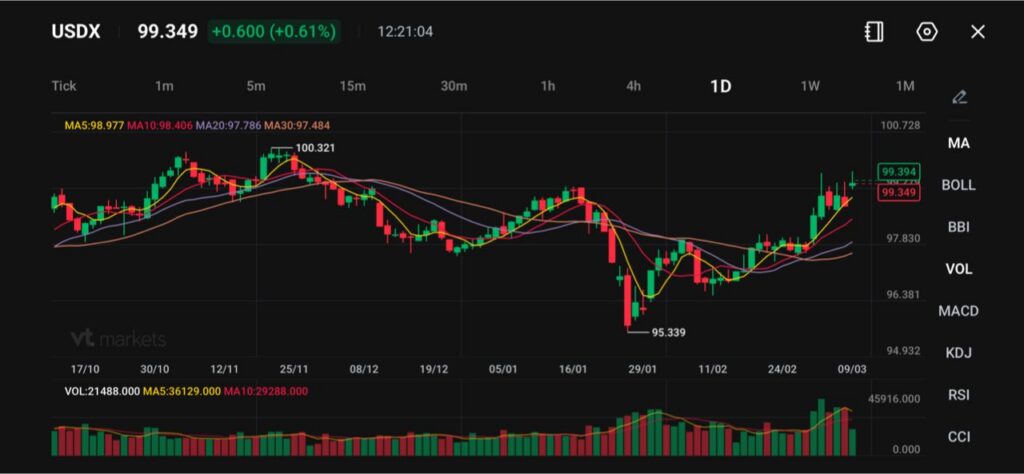
USDX trades at 99.349, up +0.600 (+0.61%), with MA5 98.977, MA10 98.406, MA20 97.786, MA30 97.484.
The euro fell 0.72% to $1.1534 and sterling dropped 0.79% to $1.3319, while USDJPY rose 0.48% to 158.59.
Traders now price around 35 basis points of Fed easing by year-end, down from more than 55 basis points in late February.
The US dollar jumped on Monday as soaring oil prices pushed investors into cash. The market did not treat this as a normal risk-off session. It sold a wide set of assets at once and bought the currency with the deepest liquidity.
The dollar strengthened against every major currency Monday as a deepening war in the Middle East pushed oil prices above $100 a barrel and boosted demand for havens https://t.co/saquegoxKe
The trigger came from energy. Oil prices spiked to just shy of $120 per barrel, and traders worried that a protracted Middle East war could disrupt supplies and weaken global growth.
A Financial Times report later said G7 finance ministers would discuss a joint release of emergency oil reserves coordinated by the International Energy Agency, which helped oil retreat slightly and cooled the dollar’s surge in the Asian afternoon.
If oil keeps hovering near the $120 area and shipping risk stays elevated, the dollar can keep its bid, even if intraday pullbacks appear after policy headlines.
Markets Reprice Fed Cuts as Inflation Risk Returns
Friday’s weak US jobs data briefly slowed the dollar and lifted rate-cut hopes, but the oil shock reversed that tone. Traders were last betting on around 35 basis points of Federal Reserve easing by year-end, after pricing more than 55 basis points in late February.
This shift matters because it tightens the path for risk assets. Higher oil can lift inflation expectations, and that can limit how quickly central banks can ease, even if growth slows.
If oil stays near the $120 area, the market may keep cutting back Fed easing bets, which can support the dollar. If oil falls sharply on policy action or de-escalation, rate-cut pricing may rebuild and cap USD strength.
Technical Analysis
The US Dollar Index (USDX) is trading near 99.35, up around 0.61%, as the dollar continues to strengthen following its rebound from the late-January low near 95.34. The index has been steadily climbing in recent sessions, suggesting renewed demand for the dollar after a period of weakness earlier in the year.
From a technical perspective, the index is now trading above its key short-term moving averages. The 5-day moving average (98.98) and 10-day (98.41) are trending upward, while the 20-day (97.79) and 30-day (97.48) remain below current price levels and are beginning to slope higher.
This alignment of moving averages indicates improving bullish momentum and suggests that the recent recovery may continue if the dollar maintains its current trajectory.
Immediate resistance is located near 100.32, which previously capped gains and represents a key psychological level. A decisive break above 100 could strengthen the bullish outlook and potentially open the path toward the 101.00–101.50 region.
On the downside, initial support is seen around 98.80–99.00, followed by stronger structural support near 97.80, where the 20-day moving average is currently positioned.
Overall, the short-term bias appears constructive for the dollar, with the index attempting to reclaim the 100 handle. However, the market may experience short-term consolidation as it approaches this resistance zone before determining the next directional move.
War Headlines Drive the Tail Risk Premium
The conflict has entered a phase where traders focus on the plumbing of energy supply. Iran has targeted shipping in the Strait of Hormuz and attacked regional energy infrastructure. Reuters reporting says the conflict has already led to the suspension of around one-fifth of global crude and natural gas supplies.
Traders have been closely looking for any sign that ship traffic is beginning to move through Hormuz https://t.co/NGG57KvJKq
Qatar’s energy minister told the Financial Times he expects Gulf producers to shut down exports within weeks, and warned oil could reach $150 a barrel.
If markets keep treating supply disruption as open-ended, the dollar can stay supported and volatility can remain elevated. If shipping resumes and the “one-fifth” disruption risk eases, the dollar’s haven premium may shrink quickly.
What to Watch Next
Whether USDX can hold above 98.406 and keep pressing the 100.321 area on the chart.
Any confirmed signal from the G7 and the IEA on a joint release of emergency oil reserves, beyond the discussion reported.
EURUSD at $1.1534 and GBPUSD at $1.3319 for signs of forced selling versus stabilisation.
USDJPY at 158.59 as traders weigh oil, yields, and Japan’s tolerance for speed.
The market’s pricing of 35 basis points of Fed easing, because any further unwind can extend USD strength.
Why Did the US Dollar Jump Today? The dollar jumped because investors rushed into cash as oil prices surged and war risk raised fears of weaker global growth. This “cash dash” tends to favour the most liquid reserve currency, especially when markets sell stocks, bonds, and metals at the same time.
What is USDX, and What Does a Move to 99.349 Mean? USDX measures the US dollar against a basket of major currencies. A reading of 99.349, up +0.600 (+0.61%), signals broad-based dollar strength rather than a move driven by one single currency pair.
Why Does Oil Strengthen the Dollar in This Scenario? Higher oil can lift global inflation risk and reduce appetite for risk assets. The US also benefits from its net energy exporter status compared with much of Europe, so traders often treat the dollar as a relative winner when energy prices jump.
How Does the G7 Oil Reserve Talk Affect the Dollar and Oil? A coordinated release of emergency reserves can reduce immediate supply fear and cool oil prices. When oil retreats, the dollar can give back some gains because the market’s inflation panic eases. That is why the dollar pared gains after the report that G7 ministers will discuss a joint release coordinated by the IEA.
What Do Fed Easing Bets Tell Us About Dollar Direction? They show how traders see the interest-rate path. Markets now price around 35 basis points of Fed easing by year-end, down from more than 55 basis points in late February. Fewer expected cuts often support the dollar because it keeps US yields relatively attractive.
Start trading now – Click here to create your real VT Markets account
Germany’s seasonally adjusted industrial production fell by 0.5% month on month in January. The market forecast was a rise of 0.9%.
The January result came in below expectations when comparing the actual figure with the forecast. It indicates output declined during the month rather than increasing.
German Output Surprise And Dax Implications
The unexpected -0.5% drop in German industrial production for January 2026, against a forecast of 0.9% growth, signals significant weakness in Europe’s core economy. This data suggests we should consider short positions on the German DAX index through futures or by purchasing put options. The miss is substantial and points toward a challenging first quarter.
This weak industrial data makes it less likely the European Central Bank will consider raising interest rates in the near term. With Eurozone HICP inflation recently reported to have cooled to 2.4% in February 2026, the ECB has room to be more cautious. Therefore, we should anticipate a dovish stance, potentially looking at trades that benefit from stable or falling short-term interest rates.
The economic divergence with the United States, where recent jobs data has remained strong, will likely put downward pressure on the EUR/USD currency pair. This is a notable shift from the more synchronized economic picture we observed for much of 2025. Buying put options on the Euro or shorting EUR futures contracts seems like a prudent strategy over the coming weeks.
Increased uncertainty surrounding the German economy should lead to higher market volatility. The VSTOXX index, which measures Eurozone equity volatility, has already ticked up to 18.5 following similar weak sentiment indicators. We could profit from further swings by buying VSTOXX call options or establishing straddles on major German industrial stocks.
Sector Exposure And Single Name Trades
Specifically, we are looking at weakness in the automotive and heavy manufacturing sectors. Companies like Siemens and Volkswagen have seen their order books soften since late last year, a trend this new data confirms. We see an opportunity in buying puts on these individual names or on ETFs with heavy exposure to German industry.
Create your live VT Markets account and start trading now.
Start trading now – Click here to create your real VT Markets account
AUD/USD rebounded from the mid-0.6900s after hitting a four-day low on Monday and closed the weekly bearish gap. It then struggled near 0.7000 and was down almost 0.25% on the day.
China’s consumer inflation rose to 1.3% year on year in February 2026, above forecasts and the highest in three years. A small pullback in the US Dollar from its highest level since November 2025 also supported the pair.
Oil Surge And Risk Off Dollar Bid
Crude Oil rose by over 25% intraday, adding to inflation concerns and reducing expectations for near-term Federal Reserve rate cuts. Risk-off trading and the chance of wider Middle East tensions supported the US Dollar and limited gains in AUD/USD.
On the 4-hour chart, price sat just below the rising 200-period simple moving average, with near-term bias neutral but slightly lower. MACD was near flat around zero, while RSI was near 46.
Resistance was seen at 0.7050 and then 0.7080. Support was near the 200-period SMA around 0.7020, then 0.6990 and 0.6960.
We are seeing the AUD/USD pair struggle to gain any real traction above the 0.7000 level. While positive inflation news out of China offers some support, the bigger story is the rush to the safe-haven US dollar. This is driven by significant geopolitical tensions in the Middle East that are overpowering minor positive factors.
Fed Policy Expectations Shift
The recent intraday surge in WTI crude oil prices, which jumped over 25% to briefly top $105 per barrel, is a major concern. This sharp rise directly fuels fears of global inflation and makes it much less likely the US Federal Reserve will consider cutting interest rates anytime soon. This expectation of higher US rates for longer is providing a strong foundation for the dollar.
Looking at the data, we see the market has rapidly changed its tune on Fed policy, with fed funds futures now pricing in less than a 20% chance of a rate cut before the June meeting. This is a dramatic shift from just a month ago when expectations were closer to 50%. The stubborn US CPI print of 3.5% we saw for January 2026 has only confirmed that inflation is not yet defeated.
Although China’s consumer inflation hitting 1.3% is a welcome sign, it is not enough to move the needle for the Aussie dollar right now. After the persistent weakness we observed in China’s economy throughout 2025, one data point cannot outweigh the global risk-off mood. Therefore, we view the Aussie’s upside as very limited.
For traders, this suggests the path of least resistance is lower, or at best, sideways. Given the strong resistance near 0.7050, we should consider strategies that benefit from this ceiling holding firm, such as selling call spreads with a strike price above 0.7080. Alternatively, buying put options could be a direct way to position for a potential break below the key 0.6990 support level.
Create your live VT Markets account and start trading now.
Start trading now – Click here to create your real VT Markets account
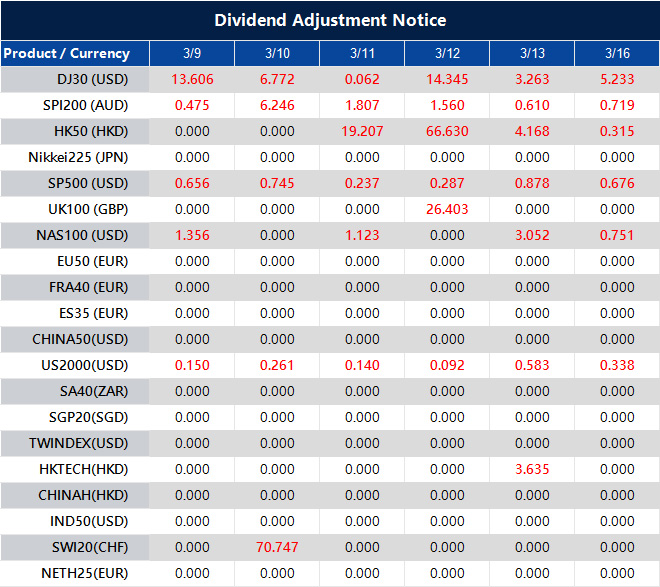
Please note that the dividends of the following products will be adjusted accordingly. Index dividends will be executed separately through a balance statement directly to your trading account, and the comment will be in the following format “Div & Product Name & Net Volume”.
Please refer to the table below for more details:
The above data is for reference only, please refer to the MT4/MT5 software for specific data.
If you’d like more information, please don’t hesitate to contact [email protected].
GBP/USD slipped to about 1.3300 in Asian trading on Monday, giving back the prior session’s modest gains. The move followed stronger demand for the US Dollar as risk aversion rose amid the Iran war with no clear end.
Mojtaba Khamenei was named Iran’s new supreme leader just over a week after Ayatollah Ali Khamenei was killed in US-Israeli strikes. US President Donald Trump said the appointment would be “unacceptable” and said Washington should have a role in choosing Iran’s next supreme leader.
Risk Aversion Drives Dollar Demand
Over the week, the Pound hit a three-month low near 1.3250 against the Dollar before a modest rebound, but still finished the week lower. The Dollar strengthened as markets moved towards safe-haven assets during the United States-Israel attack on Iran and wider market unease.
The conflict expanded after the Israel Defense Force struck Hezbollah targets in Beirut and across Lebanon after rocket fire. The UK Defence Ministry said British forces responded to a suspected drone strike at its military base in Cyprus.
Trump said attacks would continue until US objectives were met. He also said the US would respond to an attack on its embassy in Riyadh and to deaths of US military personnel during the Iran conflict.
We are still feeling the effects of the major risk-off event in 2025, when the conflict in Iran sent markets scrambling for the safe-haven US Dollar. This pushed GBP/USD down to near 1.3250, a level that created lasting sensitivity in the pair. The underlying geopolitical tension from that period continues to simmer, keeping the dollar in demand on any signs of instability.
Looking back, we saw the VIX index spike to over 35 during the peak of the conflict last year. While it has since fallen, it remains elevated today at around 19, suggesting traders are still pricing in higher-than-normal uncertainty. Consequently, buying GBP/USD put options with a three-month expiry could be a prudent way to hedge against any sudden flare-ups reminiscent of 2025.
Strategy And Macro Backdrop
The Pound’s weakness isn’t solely a dollar story, as fresh data shows UK inflation remains sticky at 2.8% for February 2026. This puts the Bank of England in a difficult position, hesitant to raise rates further and risk a recession. This economic uncertainty makes long positions on Sterling fundamentally risky.
In contrast, the US economy continues to show resilience, with the latest Non-Farm Payrolls data adding a robust 250,000 jobs. This persistent strength supports the Federal Reserve’s current stance and reinforces the dollar’s appeal as the world’s reserve currency. Therefore, any rallies in GBP/USD are likely to be seen as opportunities to sell or establish short positions using futures.
For those wanting to position for further downside while managing costs, a bearish put spread on GBP/USD could be effective. This involves buying a put option at a higher strike price and selling one at a lower strike, limiting potential profit but significantly reducing the initial premium outlay. This strategy offers a defined-risk way to capitalize on the prevailing market sentiment.
Create your live VT Markets account and start trading now.
Start trading now – Click here to create your real VT Markets account
Japan’s Prime Minister Sanae Takaichi said it is too early to judge how the Middle East conflict could affect Japan’s economy. The government is watching public concern about higher petrol costs and reviewing possible responses.
Measures to limit the impact are not expected to involve changes to the fiscal 2026 budget. The government is considering using reserves so petrol prices do not rise to levels households cannot tolerate, and said there are reserves available under the fiscal 2025 and 2026 budgets.
Yen Market Drivers
At the time of writing, USD/JPY was up 0.30% on the day at 158.35. The yen is among the world’s most traded currencies and its value is influenced by Japan’s economic performance, Bank of Japan (BoJ) policy, the gap between Japanese and US bond yields, and market risk sentiment.
The BoJ has a currency control mandate and has sometimes intervened to weaken the yen, though it does so infrequently due to political concerns with major trading partners. Ultra-loose policy between 2013 and 2024 weakened the yen, while a gradual unwind in 2024 and rate cuts elsewhere have helped narrow the 10-year US–Japan yield gap.
The yen is often treated as a safe-haven, tending to strengthen when markets are under stress.
We see that uncertainty around the Middle East conflict is creating headwinds for Japan’s economy. The government’s immediate focus is on rising gasoline prices, which have climbed over 8% in the last quarter to an average of ¥192 per liter, putting pressure on households. This is a primary concern that will guide short-term policy decisions.
Implications For Volatility
The government intends to use existing reserve funds from the 2025 and 2026 budgets to manage any energy price shocks. This tells us not to expect any new, large-scale fiscal stimulus that could significantly alter the economic outlook. Therefore, the main driver for the Yen will continue to be monetary policy and external risk factors, not government spending.
With the USD/JPY trading at a high of 158.35, the Yen is unusually weak for a period of global stress where it typically acts as a safe haven. This level is near the same points where we saw market intervention back in 2024, suggesting that the risk of the Bank of Japan stepping in is increasing. This tension between safe-haven status and interest rate differentials is creating a fragile situation.
From a policy perspective, the Bank of Japan has been slowly unwinding its loose policy since 2024, with its key rate now at 0.25%. While the US Federal Reserve has also cut its rates to around 3.50%, the yield difference between the two nations remains significant, which continues to favour the dollar. This ongoing, though narrowing, gap explains the Yen’s persistent weakness despite the BoJ’s gradual tightening.
This mix of geopolitical uncertainty, a hands-off fiscal approach, and a tense currency level points towards higher market volatility. For derivative traders, this suggests that strategies built around sharp price movements could be advantageous in the coming weeks. We should be prepared for a potential spike in volatility in the USD/JPY pair as these conflicting pressures play out.
Create your live VT Markets account and start trading now.
Start trading now – Click here to create your real VT Markets account
Silver (XAG/USD) fell to about $82.80 in early European trading on Monday, down 1.28% on the day and below $83.00. A firmer US Dollar and reduced expectations for Federal Reserve rate cuts added pressure to the price.
Oil gains and supply disruption risks in the Strait of Hormuz increased inflation concerns. This added uncertainty to the interest rate outlook and supported demand for cash in volatile markets.
Dollar Strength And Rate Expectations
Markets price nearly a 95% chance that US rates will stay unchanged at the March meeting, according to the CME FedWatch tool. A stronger US Dollar tends to weigh on dollar-priced metals by making them costlier for buyers using other currencies.
US labour data were weaker than expected. Nonfarm Payrolls fell by 92,000 in February, versus a 126,000 rise in January (revised from 130,000), while forecasts had pointed to a 59,000 increase.
The Unemployment Rate rose to 4.4% in February from 4.3% in January. Weaker data can reduce support for the US Dollar and may affect prices of commodities priced in dollars.
With silver pulling back to the $82.80 level, we see an immediate conflict for traders. The strong US Dollar, bolstered by persistent inflation fears from oil supply shocks, is creating significant headwinds for the metal. This environment suggests that near-term call options could be vulnerable, and traders might consider buying puts to hedge against further downside.
Options And Relative Value Strategies
The market is now pricing in a 95% chance that the Federal Reserve will hold interest rates steady this month, which supports the dollar’s strength. Recent inflation data from late February 2026 showed the Core Consumer Price Index (CPI) remaining stubbornly high at 3.2%, justifying the Fed’s cautious stance. This high-rate environment caps silver’s upside, as the metal offers no yield.
However, the surprising decline of 92,000 in the February Nonfarm Payrolls report is a major warning sign for the economy. We saw a similar dynamic develop in the second half of 2025, where initial labor market weakness eventually forced a more dovish policy shift. This suggests that while short-term pressure remains, buying longer-dated call options for late Q2 2026 could be a strategic play on an eventual economic slowdown.
Geopolitical tensions in the Strait of Hormuz are a double-edged sword, fueling the inflationary pressures that hurt silver while also boosting its safe-haven appeal. The Volatility Index (VIX) has crept up to 18.5, its highest level this year, reflecting broad market uncertainty. Traders could use straddle or strangle option strategies to profit from the expected increase in price swings, regardless of the direction.
We are also watching the gold/silver ratio, which has widened to over 90:1, a level not seen since the market turbulence of early 2025. Historically, such a high ratio has often indicated that silver is undervalued relative to gold. This may present a pair trading opportunity, going long on silver futures while simultaneously shorting gold futures to bet on the ratio narrowing.
Create your live VT Markets account and start trading now.
Start trading now – Click here to create your real VT Markets account
Gold prices fell in Saudi Arabia on Monday, based on FXStreet data. Gold was priced at SAR 613.83 per gram, down from SAR 621.96 on Friday.
Gold also dropped to SAR 7,160.01 per tola from SAR 7,254.39 on Friday. Other listed rates were SAR 6,138.66 for 10 grams and SAR 19,092.45 per troy ounce.
Saudi Gold Pricing Method
FXStreet derives Saudi gold prices by converting international prices using the USD/SAR rate and local units. The figures are updated daily at the time of publication and are for reference, as local market prices may differ slightly.
Gold is used as a store of value and a medium of exchange, and is commonly bought during periods of market stress. It is also used as a hedge against inflation and currency weakness.
Central banks hold the largest gold reserves and may buy gold to diversify holdings. In 2022, central banks added 1,136 tonnes of gold worth about $70 billion, the highest annual total on record, according to the World Gold Council.
Gold often moves inversely to the US Dollar and US Treasuries and can also move against risk assets. Price drivers include geopolitical events, recession concerns, interest rates, and changes in the US Dollar because gold is priced in dollars (XAU/USD).
Market Outlook And Key Drivers
The recent small dip in gold prices to 613.83 SAR per gram should be seen as a brief pause rather than a trend reversal. We have seen gold rally significantly over the last several months, so some consolidation is expected. Traders should focus on the larger macroeconomic factors now at play.
The key driver to watch is the market’s reaction to recent inflation data. After cooling for much of 2025, the latest US Consumer Price Index for February 2026 came in hotter than expected at 3.5%, raising concerns about the Federal Reserve’s next move. This renewed uncertainty around interest rates creates volatility, which is significant for gold’s safe-haven appeal.
This inflation report has caused the US Dollar to strengthen, which typically acts as a headwind for gold. We saw this inverse relationship play out throughout the rate-cutting cycle of 2025, where a weaker dollar supported higher gold prices. Now, traders must weigh if a resurgent dollar will cap gold’s potential upside in the near term.
However, a strong underlying support for gold remains the aggressive buying from central banks. Following the record purchases we saw in 2022 and 2023, data confirmed that central banks, particularly from emerging markets, continued to add to their reserves through all of 2025. This sustained demand creates a solid floor under the price, suggesting dips may be short-lived.
The inverse correlation with risk assets is also becoming more pronounced. With equity markets looking overextended after a strong performance last year, any sign of a stock market sell-off could trigger a flight to safety. Gold remains a primary beneficiary of such a rotation.
Given these conflicting signals, derivative traders should consider strategies that benefit from increased volatility. Options strategies like straddles or strangles could be effective in capturing a large price move in either direction. We are also watching implied volatility on gold options, as a spike would signal that the market is preparing for a significant breakout.
Create your live VT Markets account and start trading now.
Start trading now – Click here to create your real VT Markets account
Gold prices in the United Arab Emirates fell on Monday, based on FXStreet data. Gold was priced at AED 600.72 per gram, down from AED 608.57 on Friday.
Gold also dropped to AED 7,006.65 per tola from AED 7,098.24 on Friday. Other listed prices were AED 6,007.17 for 10 grams and AED 18,684.40 per troy ounce.
How FXStreet Calculates Local Gold Rates
FXStreet converts international gold prices into local rates using the USD/AED exchange rate and local measurement units. Prices are updated daily at the time of publication and are for reference, as local rates may vary slightly.
Central banks are the largest holders of gold and may buy it to diversify reserves. In 2022, central banks added 1,136 tonnes of gold worth about $70 billion, the highest annual total on record.
Gold can move inversely to the US Dollar and US Treasuries, and it may also move opposite to risk assets such as shares. Its price can also react to geopolitical events, recession fears, and interest-rate changes, and it is commonly priced in US dollars (XAU/USD).
The recent dip in gold to around 600 AED per gram should be seen as a minor fluctuation rather than a new trend. For traders using derivatives, this small pullback could represent a window of opportunity. The fundamental reasons for holding gold have not weakened, suggesting this price softness may be temporary.
Key Market Drivers In Focus
We are paying close attention to US interest rate expectations, as markets are currently pricing in a more than 70% chance of a rate cut by mid-2026. After the restrictive monetary policy we saw through 2024 and 2025, this shift is significant for a non-yielding asset like gold. The US Dollar Index (DXY) has already reflected this sentiment, falling from its highs in the last quarter of 2025.
The battle against inflation remains a supporting factor, as it proved to be persistent throughout 2025, with core inflation figures rarely dropping below 3.5% in the United States. This environment makes gold a valuable hedge against the slow erosion of purchasing power. Geopolitical instability also continues to provide a solid base of support for safe-haven assets.
We also see sustained physical demand from a key source: central banks. Following the record-breaking acquisitions seen in 2022 and 2023, data from the World Gold Council confirmed that central banks collectively purchased another 1,037 tonnes in 2024 and maintained a similar pace in 2025. This consistent buying creates a strong price floor and limits the potential for any major downside.
Therefore, we believe traders should consider buying call options or using futures to gain long exposure on these price dips. The inverse correlation to falling treasury yields, which have declined steadily since late 2025, provides another tailwind. The current market conditions suggest a strategy that favors upside potential in the coming weeks.
Create your live VT Markets account and start trading now.
Start trading now – Click here to create your real VT Markets account