Gold prices in Pakistan fell on Monday, based on data compiled by FXStreet. Gold was priced at PKR 45,929.69 per gram, down from PKR 46,491.04 on Friday.
Gold also dropped to PKR 535,714.90 per tola from PKR 542,262.40 per tola on Friday. Other listed rates were PKR 459,296.80 for 10 grams and PKR 1,428,563.00 per troy ounce.
How FXStreet Calculates Local Gold Rates
FXStreet converts international gold prices into Pakistani Rupees using USD/PKR and local units. The figures are updated daily using market rates at the time of publication, and local prices may differ slightly.
Central banks are the largest holders of gold. They added 1,136 tonnes worth around $70 billion in 2022, according to the World Gold Council, the highest annual total since records began.
Gold often moves inversely to the US Dollar and US Treasuries, and can also move opposite to risk assets such as shares. Price drivers include geopolitical events, recession fears, interest rates, and shifts in the US Dollar because gold is priced in dollars (XAU/USD).
Gold is seen as a hedge against currency depreciation, and its recent dip presents a complex picture for us. While prices have fallen locally, this reflects a strong US Dollar more than a fundamental weakness in the metal itself. This inverse correlation remains a key factor to watch in the coming weeks.
Strategy Considerations For Traders
We see that the US Federal Reserve’s actions through 2025 have created a high-interest-rate environment, which typically weighs on non-yielding assets like gold. The market is now pricing in potential rate cuts later this year, but recent strong labor market data from February 2026 has introduced uncertainty. This tension is creating volatility, which presents opportunities for options traders.
Looking back, we know central banks have provided a strong floor for prices, a trend that continued through 2025 with net purchases reportedly exceeding 800 tonnes. This consistent buying from large institutions suggests that significant dips are likely to be viewed as buying opportunities. It makes aggressive short positions, such as selling naked calls, particularly risky.
Geopolitical instability also remains a significant, if unpredictable, driver. Lingering conflicts and recent maritime tensions in Asia mean that gold’s safe-haven status could be triggered at any moment. These risks are not fully priced in, suggesting that long-dated call options could be an inexpensive way to position for a sudden flight to safety.
Given the conflicting signals, we should consider strategies that benefit from a significant price move in either direction. The current stability is an opportunity to enter positions before the next major catalyst. A drop below recent support levels could trigger further selling, while a dovish signal from the central banks could initiate a sharp rally.
Create your live VT Markets account and start trading now.
Start trading now – Click here to create your real VT Markets account
Brent cleared $100 at the open, hit $119.50, and sits up 25% on the day, taking gains since Trump ordered the attack on Iran to 60%.
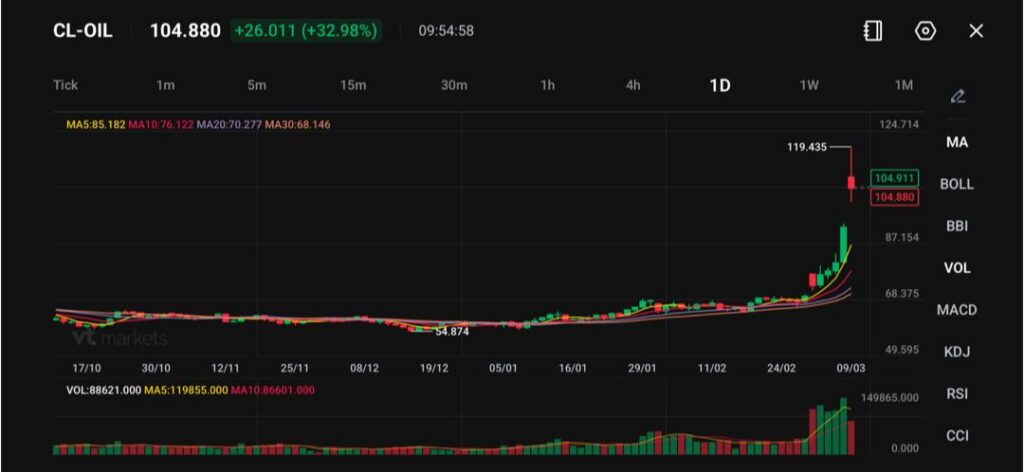
US crude shows the same shock on the chart at 104.880, up +26.011 (+32.98%), with MA5 85.182, MA10 76.122, MA20 70.277, MA30 68.146.
Risk assets fall hard: the Nikkei is off around 7%, South Korea 8%, Taiwan 5%, while European share futures drop 1% to 3% and Wall Street futures around 2%.
Oil has stopped behaving like a normal macro input and started behaving like a constraint. Brent cleared $100 at the open and did not look back. It hit a top of $119.50 so far and trades up 25%, which would rank as the biggest daily rise on record if it holds. It also lifts Brent’s gains since President Trump ordered the attack on Iran to 60%.
Oil just smashed through $100 a barrel as the Middle East conflict enters its second week. Ruth Carson breaks down what’s driving the surge as supply fears rattle markets: https://t.co/nG4cG3rY6mpic.twitter.com/v0zFMZQ7B5
Those are recession-style numbers because energy acts like a tax. It lifts costs for transport, power, and food. It also hits confidence fast. The world uses less oil per unit of output than it did in the 1970s, but the market still struggles to replace lost barrels quickly when a chokepoint shuts. Traders now price duration risk. They do not price a one-day disruption.
If crude holds anywhere near a 25% daily gain, risk assets may stay under pressure as investors hedge a higher inflation path and weaker growth. If Brent slips back below $100 quickly, markets may still keep a risk premium in place until shipping flows resume at a sizeable level.
The Strait of Hormuz Turns a Price Spike Into a Supply Event
The key driver sits in shipping, not production geology. Tankers are not braving the Strait of Hormuz. Traders also doubt insurers will cover routes at a price that makes commercial sense while the conflict stays hot. Data showed traffic collapsing, supporting the idea that flows have stalled rather than slowed.
Saudi Aramco has offered prompt crude supply through a series of rare tenders, as the effective closure of the Strait of Hormuz traps shipments and forces a rerouting of flows via the Red Sea https://t.co/KYt9roSAOx
When crude cannot move, storage fills. Some Gulf states then have to scale back production because they cannot load cargoes. That matters because shutting wells and restarting them often takes time and care, even when the fields themselves remain intact.
If tanker flow stays near zero for another few sessions, oil may remain disorderly and spreads may stay wide. If navies reopen a safe corridor and insurers return, crude could fall sharply, but the market may still price higher volatility until it sees steady transit rates.
Fuel Markets Show the Pain First
Refined products often lead to crude during real disruptions. Europe’s jet fuel market gives a clean signal. Around half of Europe’s jet fuel comes through the strait, and prices have hit record highs equivalent to about $190 per barrel.
That sort of move hits airlines, freight, and tourism in days, not months. It also bleeds into inflation prints through transport costs. When airlines reprice tickets, households feel it quickly. When logistics reprice freight, companies pass it through into goods.
If jet fuel holds near the $190 per barrel equivalent area, airlines and travel names may keep sliding, and Europe may import inflation even if demand cools.
Technical Analysis
WTI crude oil (CL-OIL) has surged dramatically, trading near $104.88, marking an extraordinary +32.98% jump on the session. The explosive rally follows a powerful breakout from the mid-$80 range, sending prices to a recent high near $119.43 before a modest pullback.
The move represents one of the strongest single-session advances in recent history and reflects intense bullish momentum across energy markets.
Technically, price has accelerated far above its moving averages, confirming the strength of the breakout. The 5-day moving average (85.18) and 10-day (76.12) have turned sharply upward, while the 20-day (70.27) and 30-day (68.15) remain significantly below current levels.
This extreme separation between price and the moving averages highlights the magnitude of the rally and indicates that the market is currently trading in a high-volatility expansion phase.
In the near term, $119.40 represents immediate resistance after acting as the intraday peak during the rally. A sustained break above this level could open the door toward the $120–$125 range.
On the downside, the first meaningful support now sits around $95–$100, which aligns with the recent breakout area. Stronger structural support is located near $87, where the previous consolidation occurred before the sharp upward move.
Overall, the broader trend has shifted decisively bullish, but the steepness of the advance suggests the market may experience short-term volatility or consolidation as traders digest the rapid gains. Even so, as long as prices remain above the $95–$100 region, the bullish structure remains firmly intact.
What Traders Should Watch Next
Brent’s ability to hold $100 and the day’s gain near 25%, because that sets the tone for risk appetite and inflation hedging.
Any sign that tankers resume crossings, because the strait drives the physical squeeze and the fear premium.
Equity futures reaction to the current drawdown levels: Nikkei -7%, South Korea -8%, Taiwan -5%, Europe -1% to -3%, Wall Street -2%.
US petrol sensitivity if pump prices jump 10%, 20% or more, because domestic politics can change war duration risk faster than markets expect.
Learn more about trading Energies on VT Markets here.
FAQs
What Makes This Move in Oil Different From a Normal Rally? The market is pricing a supply shock, not stronger demand. Brent cleared $100 at the open, hit $119.50, and sits up 25% on the day. It also puts Brent up 60% since Trump ordered the attack on Iran. Moves of 25% in a day usually come from disrupted flows and forced repricing, not gradual macro trends.
Why Does the Strait of Hormuz Matter So Much for Prices? The Strait acts like a valve for global energy flows. When tankers stop moving, physical crude cannot reach buyers. Even if producers still pump, storage fills, and exports stall. That is how a political event becomes a pricing event fast.
How Does a Shutdown Turn Into a Longer Problem for Producers? If crude cannot leave the Gulf, some states must cut output because they run out of storage. Restarting scaled-back production can take time and careful steps, which can keep supply tight even after the immediate danger eases.
Why Are Jet Fuel Prices a Key Signal in This Shock? Refined products often show stress first. Around half of Europe’s jet fuel comes through the strait, and jet fuel has hit record highs equivalent to about $190 per barrel. When jet fuel spikes, airlines, freight, and travel costs usually reprice quickly, which can spill into inflation.
What Do the Equity Index Falls Tell Us About Market Positioning? They show fast de-risking across regions. The Nikkei is off by around 7%, South Korea by 8%, and Taiwan by 5%. European share futures are down 1% to 3%, and Wall Street futures are around 2%. Moves of that size often reflect systematic selling, hedging, and tighter financial conditions rather than single-sector weakness.
Start trading now – Click here to create your real VT Markets account
GBP/USD fell to about 1.3300 in Asian trading on Monday, after mild gains in the prior session. The move came as the US Dollar rose on safe-haven demand linked to the Iran war.
Mojtaba Khamenei was named Iran’s new supreme leader just over a week after Ayatollah Ali Khamenei was killed in US-Israeli strikes. US President Donald Trump said the appointment would be “unacceptable” and said Washington should have a role in choosing Iran’s next leader.
Oil Prices And Safe Haven Flows
The US Dollar also gained support from rising oil prices on fears that the conflict could disrupt energy supplies. WTI climbed above $111.00 per barrel at the time of writing.
Traders also raised inflation expectations after hostilities began last week. This increased bets that the Federal Reserve might delay interest rate cuts.
In the UK, higher energy prices added to inflation concerns and reduced expectations of a Bank of England rate cut this month. Futures markets signalled no further policy changes for the rest of the year.
UK Prime Minister Keir Starmer repeated that he did not join the initial US-Israel strikes and pointed to diplomacy. Trump rejected reports that the UK planned to deploy HMS Prince of Wales to the Middle East, and called Britain a “once great ally.”
Rates Divergence And Market Positioning
Given the market memory of last year’s conflict, we see the US Dollar’s strength as a key theme that has persisted. The initial flight to safety in 2025 has since evolved into a yield-driven trade, with the Federal Reserve having held interest rates higher for longer than anticipated. Current Fed funds futures are only pricing in a 60% chance of a single rate cut by the third quarter of this year, reflecting stubborn inflation that took root after the oil shock.
Traders should consider that while the WTI oil price has fallen from its peak above $111 last year, it remains elevated, trading this morning near $85 per barrel. This lingering price pressure is keeping implied volatility in energy derivatives high, creating opportunities for those positioning for either a fragile peace or a sudden re-escalation of hostilities in the Middle East. Any renewed tension could quickly send prices back toward the $100 mark.
For those trading interest rate derivatives, the divergence between the Fed and the Bank of England is critical. Last year, both central banks abandoned rate-cut expectations, but with UK inflation now tracking at 3.8% for January 2026—slightly above the latest US CPI of 3.5%—the BoE may be forced to delay easing even longer than the Fed. This suggests that trades positioning for a wider US-UK rate differential could be profitable in the coming months.
In the foreign exchange space, GBP/USD is still feeling the effects of the diplomatic strains that emerged in 2025, currently struggling below 1.2900. Options traders should note that while spot prices are subdued, one-month volatility for the pair remains higher than historical averages, indicating the market is still pricing in political and economic uncertainty. Using option structures like risk reversals could be an effective way to position for a potential pound recovery while limiting downside risk.
Create your live VT Markets account and start trading now.
Start trading now – Click here to create your real VT Markets account
IMF Managing Director Kristalina Georgieva said resilience is being tested again due to new conflict in the Middle East. She said a prolonged conflict could affect market sentiment, growth and inflation.
She said imported oil and gas facilities have suffered damage and stoppages. She said energy security has become the top concern.
Resilience Tested By Middle East Conflict
Georgieva said every 10% increase in oil prices, if it lasts through most of the year, would raise global inflation by 40 basis points. She described current conditions as a world of uncertainty and said this is the new normal.
She advised policymakers to prepare for extreme scenarios. She said independent central banks, fiscal rules and policy frameworks can support faster growth.
She said countries should keep fiscal space so it can be used during shocks. She said Japan’s central bank is responding to a move away from prolonged below-target inflation with a series of policy decisions.
We recall the warnings from late 2025 about resilience being tested by the new Middle East conflict. Those concerns about energy security have now kept crude oil prices elevated for months. This situation implies that volatility in the energy sector will likely persist, creating opportunities in options trading to hedge against or speculate on sharp price movements.
Derivatives Strategies For Volatility
With West Texas Intermediate crude hovering around $95 a barrel, recent data shows a 15% increase since the start of this year. This reflects the continued production discipline from OPEC+ and minor but persistent supply disruptions we have seen in the region. Derivative traders should therefore consider positioning for further upside risk in crude prices through call options or bull call spreads on major energy ETFs.
The persistent 10% year-over-year increase in oil prices is adding the expected 40 basis points to global inflation, a concern we were warned about. February’s CPI data already showed inflation remaining stubbornly above the Federal Reserve’s target, leading markets to price out one anticipated rate cut for this year. This makes derivatives that protect against higher-for-longer interest rates, such as interest rate swaps or options on treasury futures, increasingly relevant.
This uncertainty is the ‘new normal’ we were told to prepare for, and it is reflected in broader market sentiment. The CBOE Volatility Index (VIX) has been holding firmly above 18, a notable premium compared to historical averages during periods of economic expansion. Traders should therefore look at using VIX futures or options to hedge equity portfolios against sudden geopolitical shocks.
We are also seeing the divergence in central bank policy that was hinted at in 2025, particularly with Japan. While the Bank of Japan continues its slow, ‘nimble’ path out of its ultra-loose policy, the Fed remains hawkish due to energy-driven inflation. This widening policy gap suggests continued strength in the U.S. dollar against the yen, presenting opportunities in USD/JPY currency options.
Create your live VT Markets account and start trading now.
Start trading now – Click here to create your real VT Markets account
EUR/JPY traded lower near 182.95 in early European trading on Monday, slipping below 183.00 as the Japanese Yen strengthened against the Euro. Germany’s January Industrial Production data is due later on Monday, while Japan’s Q4 Gross Domestic Product report is scheduled for Tuesday.
The US-Israeli war with Iran has entered its 10th day. Iran named Mojtaba Khamenei, the second son of Ayatollah Ali Khamenei, as the new Supreme Leader after his father was killed in the first wave of US-Israeli strikes.
Escalation Drives Safe Haven Demand
US President Donald Trump demanded Iran’s “unconditional surrender” and said he expects a role in selecting a leader acceptable to the White House. Iran has launched missiles and drones at Israel and Gulf states, including Saudi Arabia, the UAE, Kuwait, and Bahrain.
The rise in regional tensions supported demand for the Yen and pressured the currency pair. Attention remains on how the conflict may affect market moves in the near term.
Uncertainty over the Bank of Japan’s interest rate path may limit further Yen gains. Governor Kazuo Ueda signalled a prolonged hold, and Reuters reported that while some expected a March hike, many now see no change until at least April or July.
Given the high tension, holding unhedged positions is extremely risky, and we are seeing a scramble for protection. We should consider buying options to guard against sudden, sharp moves in EUR/JPY, as currency market volatility has surged over 30% in the past ten days. This spike is reminiscent of the market shocks we saw back in 2024.
Euro Vulnerability And Positioning
Capital is flowing into traditional safe havens like the Japanese Yen, a pattern we have seen in every major global crisis. This demand for the Yen is occurring even though the Bank of Japan is signaling it will delay interest rate hikes. This suggests the geopolitical risk is currently the market’s primary driver.
The Euro is under intense pressure because Europe is highly vulnerable to energy price shocks from the Middle East. With Brent crude oil now trading above $145 a barrel, a level not seen since late 2023, the risk of a European recession has increased significantly. Germany’s latest ZEW Economic Sentiment survey, released last week, already showed a sharp fall into negative territory.
In this environment, we should be looking at strategies that profit from falling prices or rising volatility. We are advising on buying EUR/JPY put options to position for a move towards the 180.00 level in the coming weeks. The options market shows a heavy bias for JPY strength, with the cost of protecting against a fall in the cross at its highest point in over a year.
Create your live VT Markets account and start trading now.
Start trading now – Click here to create your real VT Markets account
EUR/USD traded near 1.1520 in Asian hours on Monday after small gains in the prior session. The daily chart shows the pair still moving within a descending channel, keeping the bias bearish.
The pair has fallen below the nine-day Exponential Moving Average (EMA), with that EMA turning lower, and it remains under the 50-day EMA. This keeps both short-term pressure and the wider trend tilted to the downside.
Oversold Signals And Momentum
The 14-day Relative Strength Index (RSI) has dropped below 30, which points to oversold conditions. The RSI move lower suggests selling momentum is still present rather than a clear end to the fall.
Support is first seen at the seven-month low of 1.1468. Below that, levels to watch include the channel base near 1.1430 and the nine-month low of 1.1391.
Resistance is seen at the nine-day EMA near 1.1650. A move higher would need a daily close above the 50-day EMA at 1.1742, then the channel top near 1.1790, with 1.2082 as the highest level since June 2021.
Looking back at the analysis from late 2025, we saw a strong bearish momentum for EUR/USD as it approached seven-month lows near 1.1468. The pair was trading within a descending channel, and the Relative Strength Index signaled oversold conditions. However, the fundamental picture has changed significantly in the first quarter of 2026.
Macro Drivers And Policy Divergence
The primary driver for us now is the clear divergence in inflation data between the two economic blocs. The Eurozone’s flash CPI estimate for February 2026 came in higher than expected at 2.8%, showing persistent price pressures. Conversely, the latest U.S. inflation figures have cooled to 2.5%, reinforcing the case for the Federal Reserve to begin its easing cycle.
This data has forced a shift in central bank expectations, which we believe is fueling the pair’s recent recovery towards the 1.1600 handle. We now see the market pricing in a delayed rate cut from the European Central Bank, possibly not until Q3 2026. Meanwhile, futures markets indicate a greater than 70% probability of a Federal Reserve rate cut by its June meeting.
For derivative traders, this environment suggests considering strategies that benefit from a potential grind higher, while hedging against volatility. We see value in buying put options with a strike near 1.1450 as a hedge against any sudden reversal or hawkish surprise from the Fed. The Cboe EuroCurrency Volatility Index (EVZ) has risen to 8.5, indicating that the market is pricing in more movement in the coming weeks.
On the upside, we think a bull call spread could be an effective strategy to capture further gains with limited risk. For example, buying an April 1.1650 call while simultaneously selling an April 1.1750 call could profit from a move through the old nine-day EMA resistance level mentioned in last year’s analysis. This structure takes advantage of the current upward momentum driven by policy divergence.
Create your live VT Markets account and start trading now.
Start trading now – Click here to create your real VT Markets account
AUD/CAD fell more than 0.5% to about 0.9485 in Asian trading on Monday, dropping below 0.9500 as the Canadian Dollar strengthened. The move followed rising oil prices linked to the Middle East conflict involving the US, Israel and Iran.
WTI crude rose over 25% to above $110.00 during Asian trade. The BBC reported that several Iranian oil depots were struck in a joint US and Israeli operation over the weekend.
Oil Prices Support The Canadian Dollar
Higher oil prices tend to support the Canadian Dollar because Canada is the largest exporter of oil to the US. Attention now turns to Canada’s February employment report due on Friday.
Markets expect employment to rise by 9.5K after a 24.8K fall in January. The figures may affect expectations for the Bank of Canada’s monetary policy outlook.
The Australian Dollar weakened as demand fell for risk-sensitive assets amid the escalating conflict. S&P 500 futures dropped over 2% at the open, indicating reduced risk appetite.
Given the sharp move in AUD/CAD, we should consider short positions to ride this momentum. Put options on the pair could be an effective way to capitalize on further downside while limiting risk. The break below the key 0.9500 level suggests more weakness is likely in the near term.
Positioning And Risk Sentiment
The driving force is oil, and this conflict appears to be in its early stages. We remember how WTI crude futures spiked to over $120 a barrel in early 2022 after the conflict in Ukraine began, so the current price of $110 has room to run, especially with warnings of $150 oil. Long positions in oil futures or call options on energy-related ETFs seem prudent.
This is a classic risk-off environment, confirmed by the significant drop in S&P 500 futures. We should anticipate continued fear in the market, which makes buying volatility a direct and potentially profitable strategy. VIX call options are likely to perform well if geopolitical tensions continue to escalate throughout the week.
The Canadian dollar’s strength is fundamentally supported by Canada’s position as a top-five global oil producer. With Canada exporting over four million barrels per day, primarily to the US, a sustained period of higher oil prices directly benefits its terms of trade. This provides a strong tailwind for the loonie against other currencies.
Meanwhile, the Australian dollar is suffering as a risk-proxy currency, a role we saw it play during the market downturns of 2022 and 2025. As long as global equity markets remain under pressure, the Aussie will likely struggle to find buyers. The currency’s fate in the coming weeks is tied to the broader market’s appetite for risk.
We must keep an eye on the Canadian employment data scheduled for this Friday. While the current geopolitical narrative is overwhelming, a surprisingly weak jobs report could temporarily halt the Canadian dollar’s advance. This event presents a key risk, and positions should be managed accordingly heading into the release.
Create your live VT Markets account and start trading now.
Start trading now – Click here to create your real VT Markets account
The Australian Dollar fell 0.65% to about 0.6985 against the US Dollar in Asian trading on Monday. AUD/USD was down over 0.6% as oil prices rose amid conflict involving the US, Israel and Iran.
S&P 500 futures dropped more than 2% in early trade. The US Dollar Index (DXY) rose over 0.7% to around 99.60, its highest level in more than three months.
Risk Aversion Hits Australian Dollar
WTI crude jumped over 25% in Asian trade to above $110.00. The move followed strikes on several Iranian oil depots over the weekend, reported by the BBC, in an operation involving the US and Israel.
Higher energy prices tend to pressure riskier currencies as funding flows shift towards safer assets. US President Donald Trump said on Truth.Social that higher oil prices were a “very small price to pay” in relation to Iran’s nuclear programme.
Markets will watch the US Consumer Price Index (CPI) for February, due on Wednesday. The report may have limited effect on Federal Reserve policy expectations because it does not reflect the latest oil price rises linked to the Middle East conflict.
We have seen this playbook before during past Middle East conflicts where the Australian dollar gets hit hard. Looking back at the events of 2025, a sudden escalation saw the AUD/USD tumble below 0.7000 as WTI crude surged over $110 a barrel. This kind of geopolitical shock creates a classic flight to safety, punishing risk-sensitive currencies like the Aussie.
Positioning And Hedging Ideas
Today, with AUD/USD trading around 0.6540 and WTI crude oil near a more stable $80 a barrel, we see significant room for a volatile move. Any renewed conflict in the region could easily trigger a repeat of the 2025 scenario, pushing oil prices dramatically higher. This would place immediate and severe downward pressure on the Australian dollar.
The US Dollar Index (DXY) is currently holding firm above the 103 mark, partly because the latest US Consumer Price Index data from February showed inflation remains sticky at 3.2%. A geopolitical crisis would likely accelerate the rush into the US dollar for safety, pushing the DXY much higher. This would create a powerful dual headwind for the AUD/USD pair.
Given this historical precedent, we should consider positioning for a potential drop in the AUD/USD over the coming weeks. Buying put options on the Australian dollar against the US dollar offers a defined-risk way to profit from a sudden downturn. This strategy acts as a direct bet on history repeating itself should tensions flare up once again.
Similarly, we should look at the volatility in energy and equity markets. Call options on WTI or Brent crude futures would benefit directly from an oil price spike caused by supply fears. At the same time, buying put options on the S&P 500 could hedge against the broad market sell-off that typically accompanies such global uncertainty.
Create your live VT Markets account and start trading now.
Start trading now – Click here to create your real VT Markets account
USD/CHF rose above 0.7800 and traded near 0.7820 in Asian hours on Monday, after falling in the previous session. The move came as demand for the US Dollar increased on safe-haven flows and higher energy prices.
The US Dollar Index (DXY) climbed towards three-month highs and traded around 99.50. Support also came as West Texas Intermediate (WTI) crude oil rose above $100.00 per barrel to over three-year highs, on worries that a longer Middle East conflict could disrupt global energy supply.
Geopolitical Risk And Oil Price Support
CBA economists reported that Iran may respond to gain leverage in future talks to end the war. They also said the US and Israel may seek to reduce Iran’s offensive capacity to gain leverage in future talks.
The Telegraph reported that US President Donald Trump called the rise in oil prices a “very small price to pay” for defeating Iran and ensuring global peace. It also reported that Trump wrote on Truth Social that Iran’s only option is unconditional surrender, after which he would help select its next leader.
Gains in USD/CHF may be limited if the Swiss Franc strengthens on safe-haven demand. Traders are also watching for Swiss National Bank intervention, as SNB Vice-President Antoine Martin repeated that the bank is ready to act against excessive Franc strength, while Swiss inflation remains weak.
Last year, we saw USD/CHF rally past 0.7800 driven by conflict fears in the Middle East and a spike in oil prices. That situation was a clear signal for long US Dollar positions against the Franc. Today, the environment is different, with West Texas Intermediate crude having stabilized around $82 per barrel after a production increase from non-OPEC members late last year.
Shifting SnB Policy And Trade Implications
A key shift is the Swiss National Bank’s focus, which is no longer on capping Franc appreciation but on fighting persistent inflation, which clocked in at 2.1% for February 2026. This contrasts with last year’s environment where the US Dollar Index was near 99.50; today it trades closer to 95.20. Consequently, the SNB is far less likely to intervene against Franc strength, removing a major headwind for the CHF.
For the coming weeks, buying call options on USD/CHF seems misplaced given the changed fundamentals. Instead, traders could consider purchasing put options to speculate on a further decline towards the 0.7650 level seen earlier this year. This strategy benefits from a stronger Franc driven by the SNB’s hawkish stance and calmer energy markets.
However, we must remember how quickly volatility surged after the events in Ukraine back in 2022, reminding us that geopolitical calm is fragile. Implied volatility on USD/CHF options is now at a multi-month low, making long-dated straddles relatively cheap. This could be a prudent way to position for a potential, unexpected spike in market tension without betting on a specific direction.
Create your live VT Markets account and start trading now.
Start trading now – Click here to create your real VT Markets account
S&P 500 futures fell close to 2.5% in the Asian session on Monday and opened with a bearish gap. The move was linked to fears that the Middle East conflict will keep oil prices high and weigh on global growth.
The US-Israeli campaign against Iran reached its tenth day, with no clear end in sight. Iran appointed Mojtaba Khamenei as Supreme Leader more than a week after Ayatollah Ali Khamenei was killed in US-Israeli strikes.
Oil Supply Risks
Tankers have avoided the Strait of Hormuz, raising concern about supply problems. Crude Oil prices have risen by over 25%, which has increased worries about energy-led inflation.
Higher oil prices may add pressure for major central banks, including the US Federal Reserve, to keep policy tighter. Higher energy costs may also reduce economic activity and lower demand for riskier assets.
Markets are also watching for this week’s US consumer inflation figures for clues on the Federal Reserve’s rate-cut path. Geopolitical developments remain a main driver of wider market risk mood.
We remember how the market was shaken last year by the sudden escalation in the Middle East and the death of Ayatollah Khamenei. The S&P 500 reacted immediately with a sharp drop, as we saw oil prices surge in a way that reminded many of the 2022 energy crisis. This event set the stage for a year of heightened inflation and cautious central bank policy.
Market Conditions Now
The effects are still with us today, in March 2026. WTI crude oil has settled into a high range, currently trading around $95 a barrel, and the latest US consumer inflation report for February showed a stubbornly high 4.1% year-over-year increase. Because of this persistent inflation, the Federal Reserve has paused its rate-cutting cycle, keeping borrowing costs elevated for longer than anyone anticipated last year.
This persistent uncertainty is clearly reflected in the derivatives market. The CBOE Volatility Index, or VIX, has been trading in an elevated range, currently sitting at 24, well above the long-term average. This signals that traders are actively pricing in the risk of large, sudden market swings in the near future.
For traders, this means the cost of portfolio insurance remains high. Buying protective put options on major indices like the SPX is an expensive strategy, as the high implied volatility inflates option premiums across the board. The market is paying a premium for downside protection, reflecting the deep-seated fear of another geopolitical shock.
The tension has also fueled a flight to safety, strengthening the US dollar. The Dollar Index (DXY) is trading near multi-year highs, putting pressure on commodity prices and the earnings of multinational corporations. Meanwhile, government bond yields remain high as investors demand more compensation for inflation risk.
In the coming weeks, all eyes will be on the upcoming OPEC+ meeting at the end of the month. Any statements regarding production quotas or the stability of supply through the Strait of Hormuz will be a major catalyst for the market. We should also watch the next round of inflation data for any signs that price pressures are finally easing.
Create your live VT Markets account and start trading now.
Start trading now – Click here to create your real VT Markets account